| Param | Original file | Final file |
|---|---|---|
| Filename | modeM0/AS1A14_057T04_9000006508_53948cztM0_level2.fits | modeM0/AS1A14_057T04_9000006508_53948cztM0_level2_quad_clean.evt |
| Size (bytes) | 795,816,000 | 72,671,040 |
| Size | 758.9 MB | 69.3 MB |
| Events in quadrant A | 3,252,443 | 641,187 |
| Events in quadrant B | 3,897,561 | 667,802 |
| Events in quadrant C | 9,457,020 | 366,383 |
| Events in quadrant D | 12,352,004 | 77,109 |
| Mode M0 | |||
|---|---|---|---|
| Quadrant | BADHDUFLAG | Total packets | Discarded packets |
| A | 0 | 13994 | 1 |
| B | 0 | 15992 | 1 |
| C | 0 | 32624 | 1 |
| D | 0 | 41106 | 1 |
| Mode SS | |||
|---|---|---|---|
| Quadrant | BADHDUFLAG | Total packets | Discarded packets |
| A | 0 | 130 | 0 |
| B | 0 | 130 | 0 |
| C | 0 | 130 | 0 |
| D | 0 | 130 | 0 |
| Mode M9 | |||
|---|---|---|---|
| Quadrant | BADHDUFLAG | Total packets | Discarded packets |
| A | 0 | 12 | 0 |
| B | 0 | 12 | 0 |
| C | 0 | 12 | 0 |
| D | 0 | 12 | 0 |
| Quadrant | Total seconds | Saturated seconds | Saturation percentage |
|---|---|---|---|
| A | 6419 | 43 | 0.669886% |
| B | 6420 | 240 | 3.738318% |
| C | 6420 | 2719 | 42.352025% |
| D | 6420 | 5628 | 87.663551% |
Noise dominated data is calculated using 1-second bins in cleaned event files. If a bin has >2000 counts, and if more than 50% of those come from <1% of pixels, then it is considered to be noise-dominated and hence unusable.
| Quadrant | # 1 sec bins | Bins with >0 counts | Bins with >2000 counts | High rate bins dominated by noise | Noise dominated (total time) | Noise dominated (detector-on time) | Marked lightcurve |
|---|---|---|---|---|---|---|---|
| A | 7569 | 6420 | 16 | 16 | 0.21% | 0.25% | 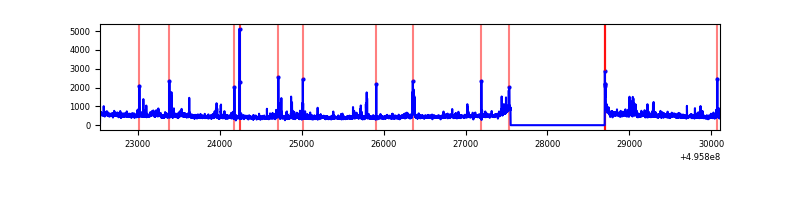 |
| B | 7570 | 6421 | 160 | 160 | 2.11% | 2.49% | 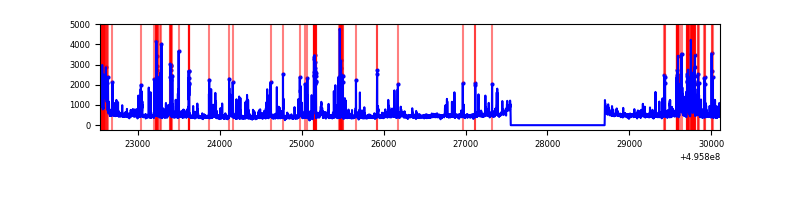 |
| C | 7570 | 6421 | 2580 | 2580 | 34.08% | 40.18% | 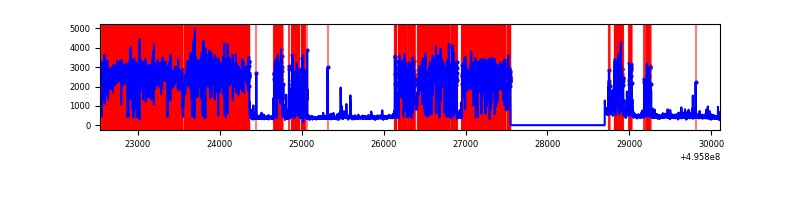 |
| D | 7569 | 6420 | 3128 | 3128 | 41.33% | 48.72% | 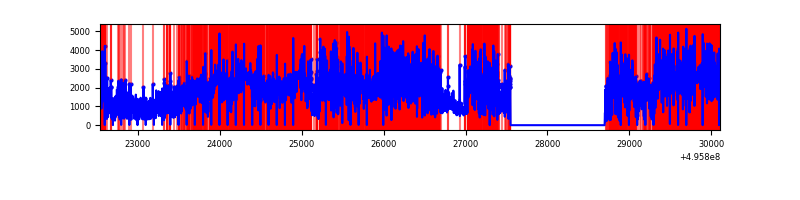 |
Top three noisy pixels from each quadrant. If the there are fewer than three noisy pixels in the level2.evt file, extra rows are filled as -1
| Pixel properties | Quadrant properties | ||||||
|---|---|---|---|---|---|---|---|
| Quadrant | DetID | PixID | Counts | Sigma | Mean | Median | Sigma |
| A | 3 | 14 | 162401 | 926.87 | 697 | 680 | 174.5 |
| A | 3 | 62 | 79921 | 454.16 | 697 | 680 | 174.5 |
| A | 15 | 174 | 66539 | 377.46 | 697 | 680 | 174.5 |
| B | 0 | 213 | 820937 | 5601.26 | 686 | 662 | 146.4 |
| B | 0 | 155 | 88678 | 601.02 | 686 | 662 | 146.4 |
| B | 3 | 16 | 55437 | 374.03 | 686 | 662 | 146.4 |
| C | 1 | 241 | 7115447 | 47683.91 | 538 | 531 | 149.2 |
| C | 13 | 3 | 73566 | 489.47 | 538 | 531 | 149.2 |
| C | 12 | 2 | 51627 | 342.44 | 538 | 531 | 149.2 |
| D | 8 | 176 | 11141145 | 197747.51 | 191 | 182 | 56.3 |
| D | 6 | 239 | 108809 | 1928.08 | 191 | 182 | 56.3 |
| D | 2 | 172 | 83185 | 1473.27 | 191 | 182 | 56.3 |
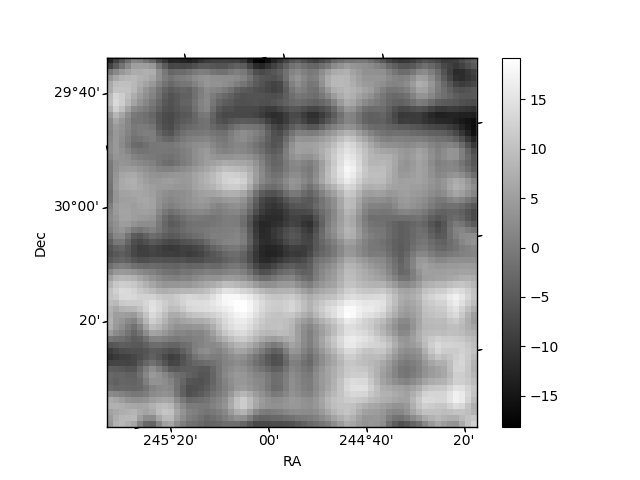
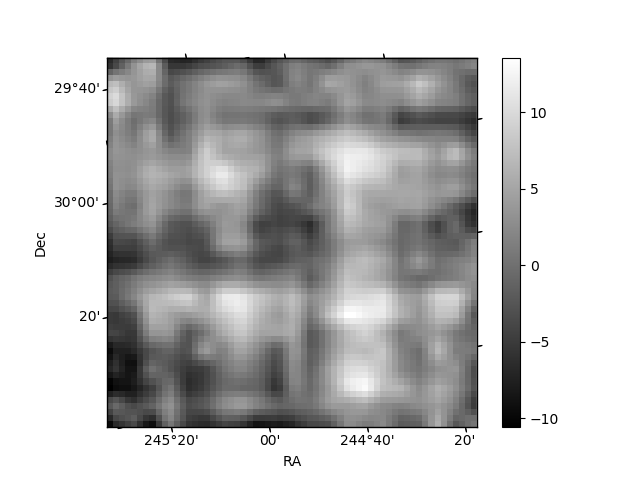
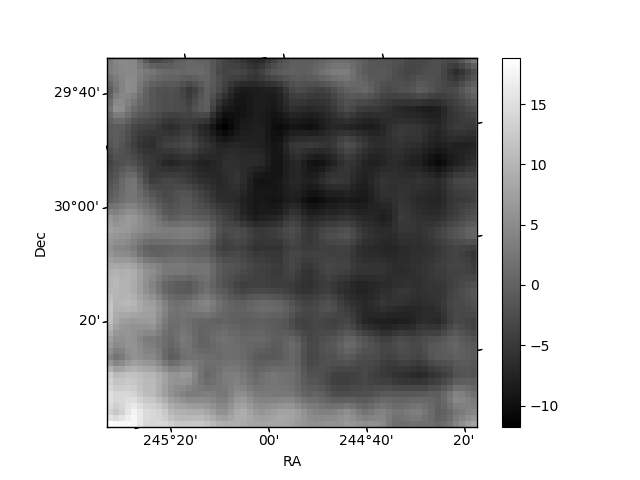
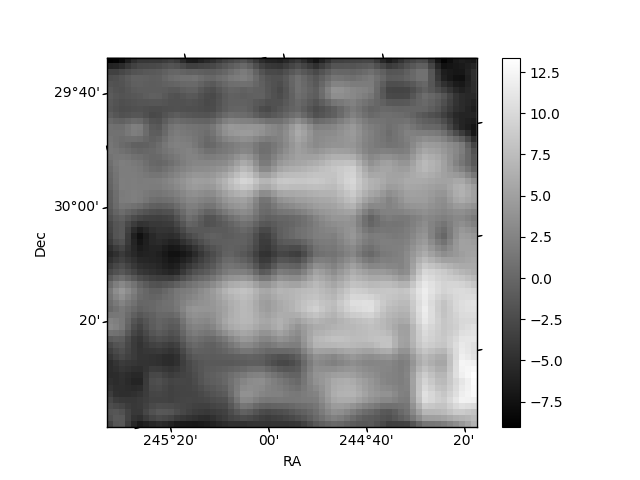
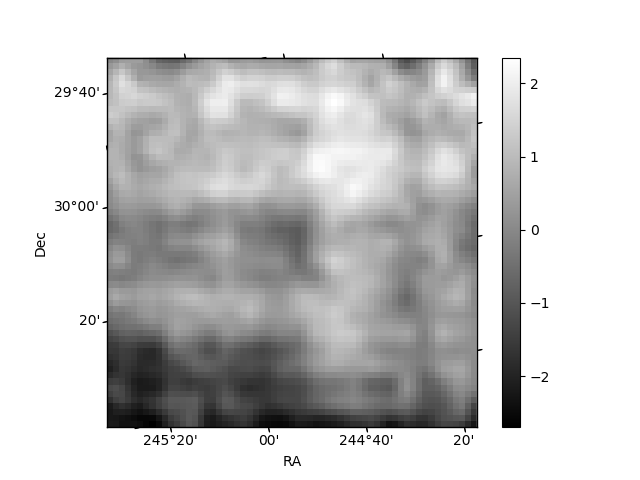
Histogram calculated using DETX and DETY for each event in the final _common_clean file
| Quadrant A | 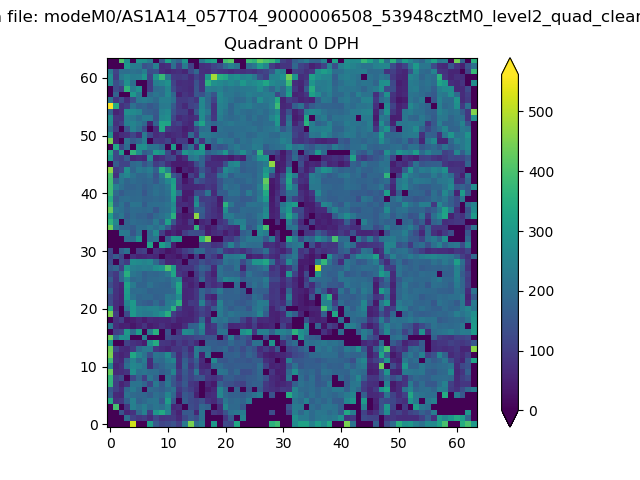 |
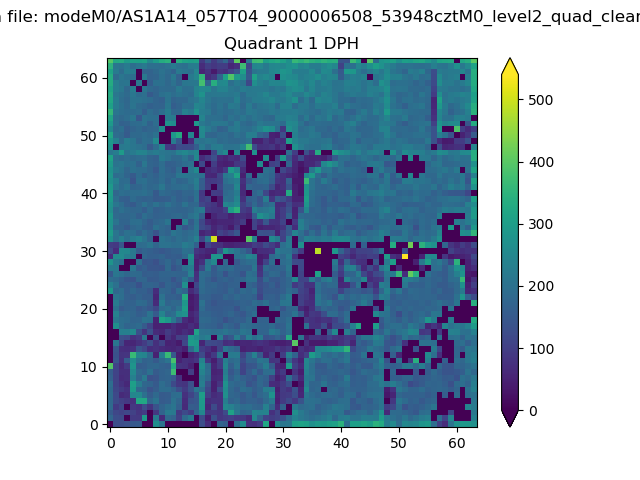 |
Quadrant B |
|---|---|---|---|
| Quadrant D | 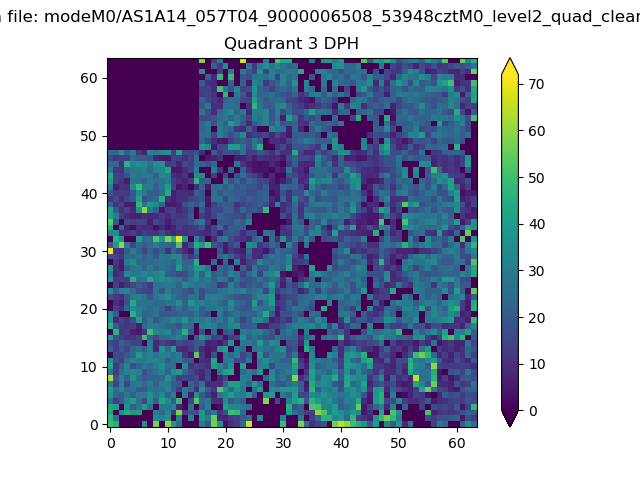 |
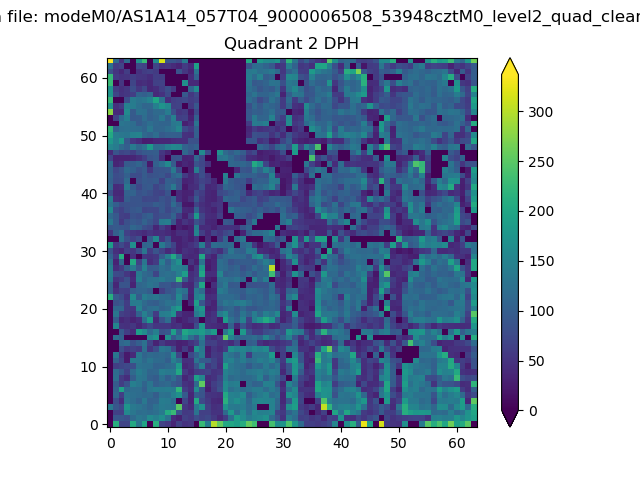 |
Quadrant C |
| Plot type | Count rate plots | Images |
|---|---|---|
| Comparison with Poisson distribution Blue bars denote a histogram of data divided into 1 sec bins. Red curve is a Poisson curve with rate = median count rate of data. |
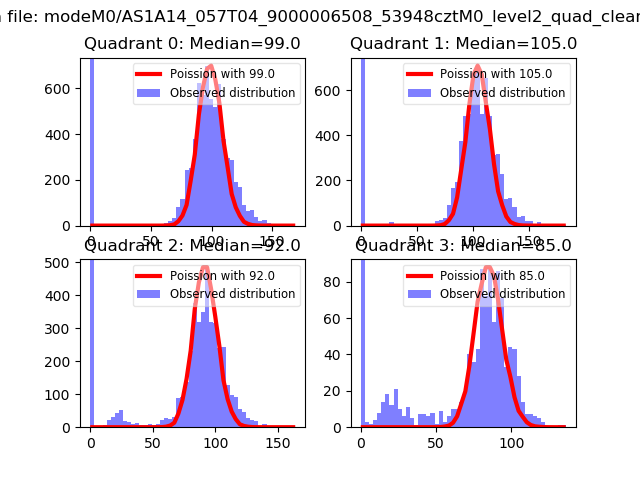 |
 |
| Quadrant-wise count rates Data is divided into 100 sec bins |
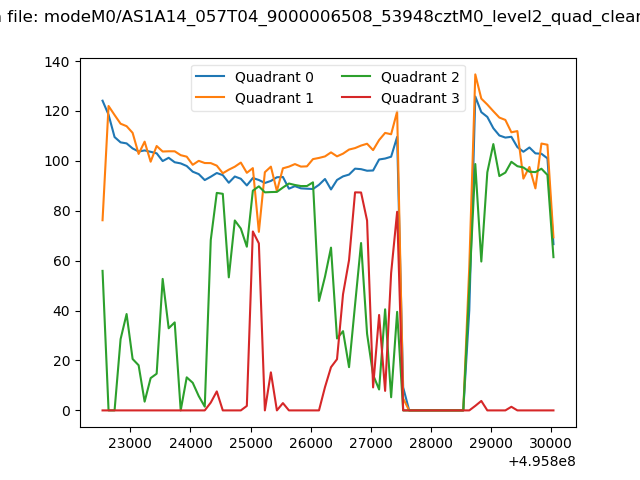 |
|
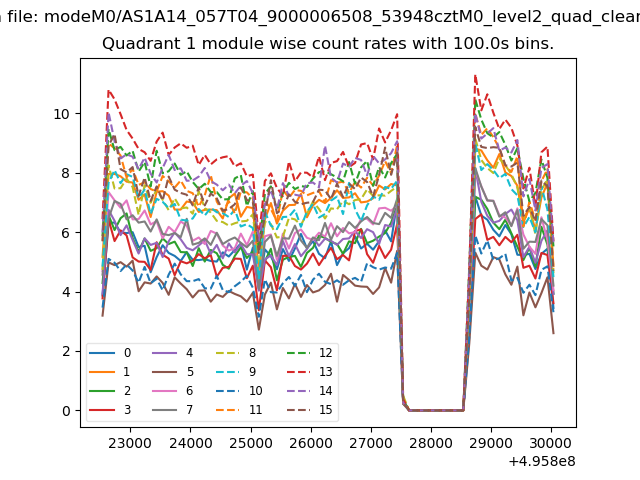
| Module-wise count rates for Quadrant A Data is divided into 100 sec bins |
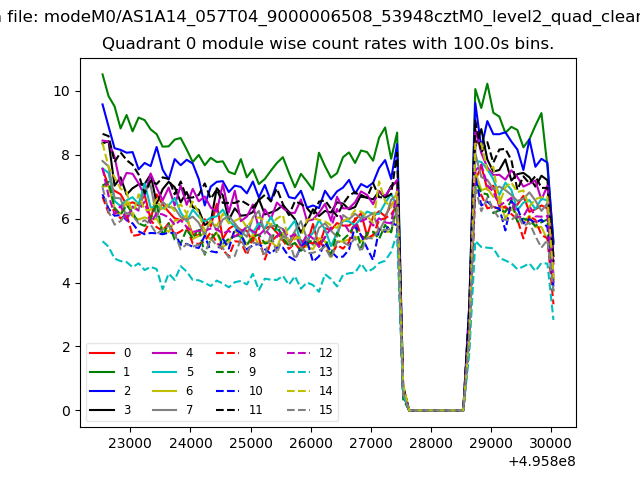 |
 |
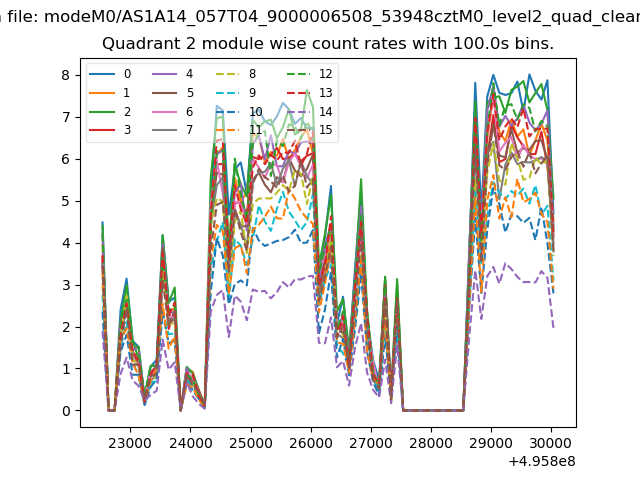
| Module-wise count rates for Quadrant B Data is divided into 100 sec bins |
 |
 |
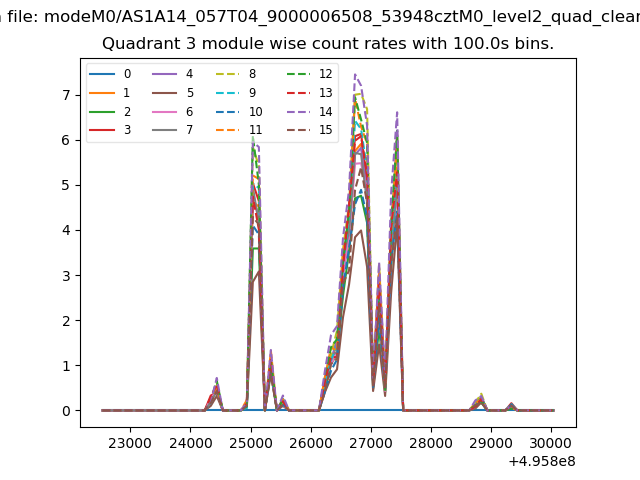
| Module-wise count rates for Quadrant C Data is divided into 100 sec bins |
 |
 |
| Module-wise count rates for Quadrant D Data is divided into 100 sec bins |
 |
 |
| Parameter | Plot |
|---|---|
| CZT HV Monitor |  |
| D_VDD | 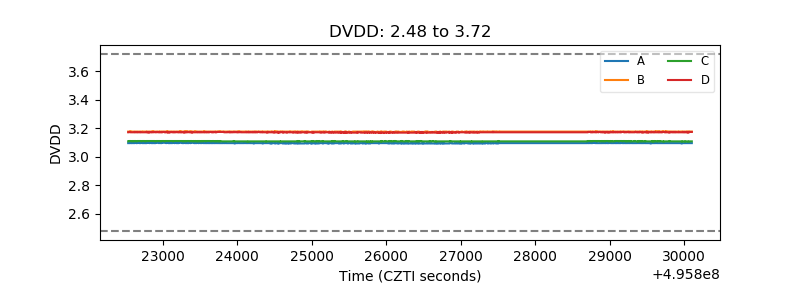 |
| Temperature 1 | 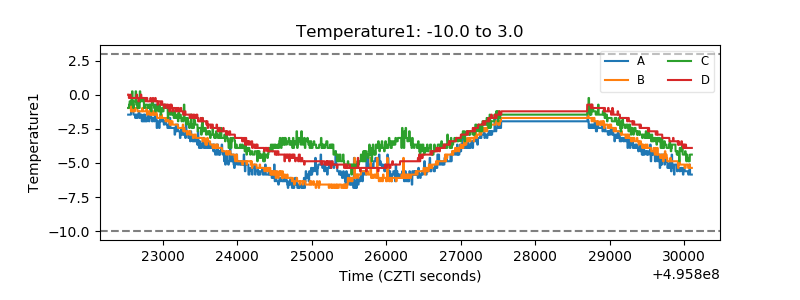 |
| Veto HV Monitor | 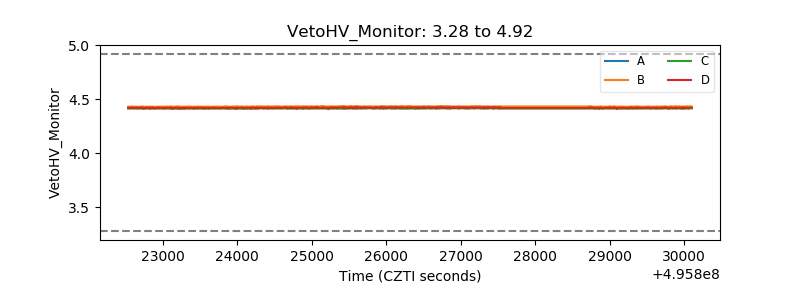 |
| Veto LLD | 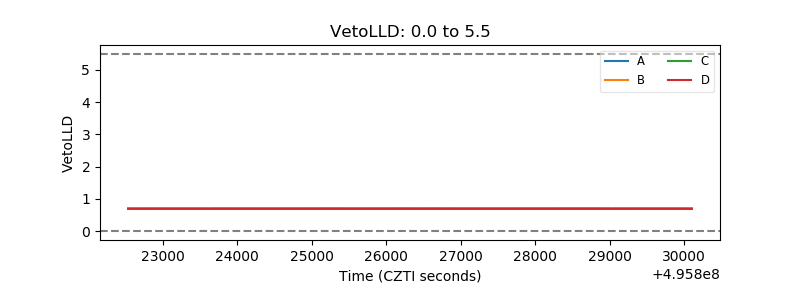 |
| Alpha Counter | 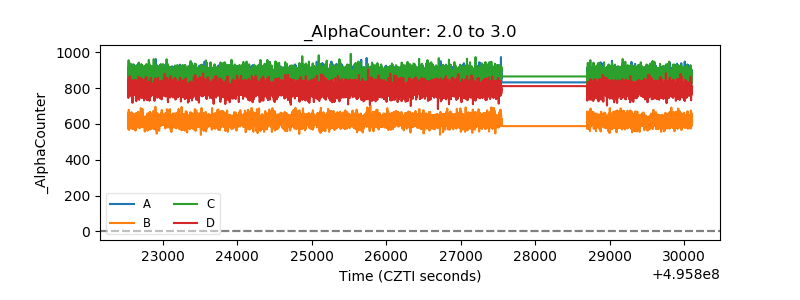 |
| _CPM_Rate | 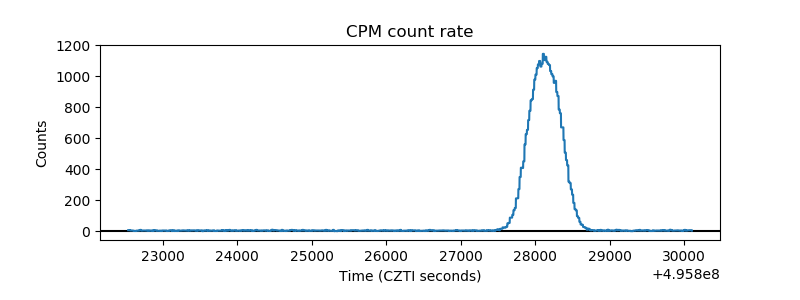 |
| CZT Counter | 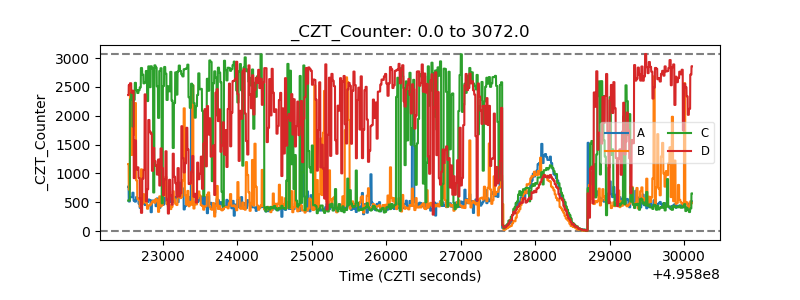 |
| +2.5 Volts monitor | 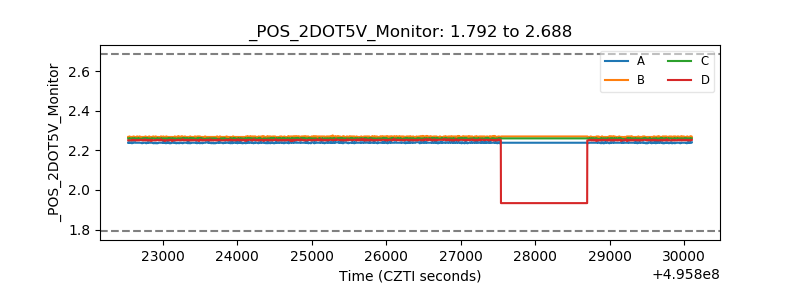 |
| +5 Volts monitor | 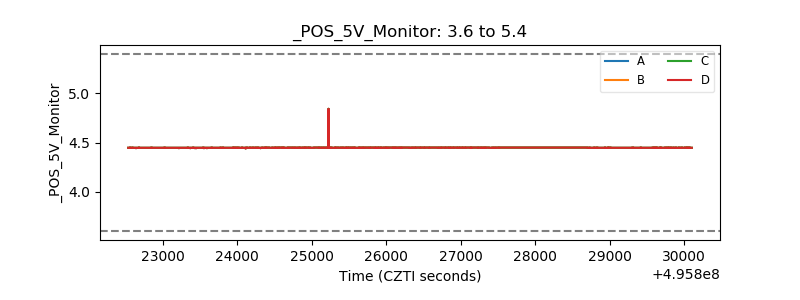 |
| _ROLL_ROT | 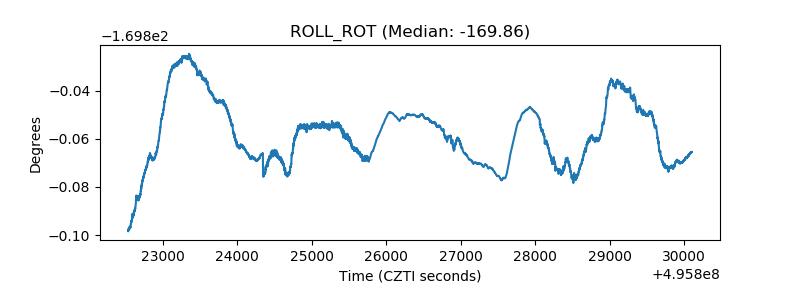 |
| _Roll_DEC | 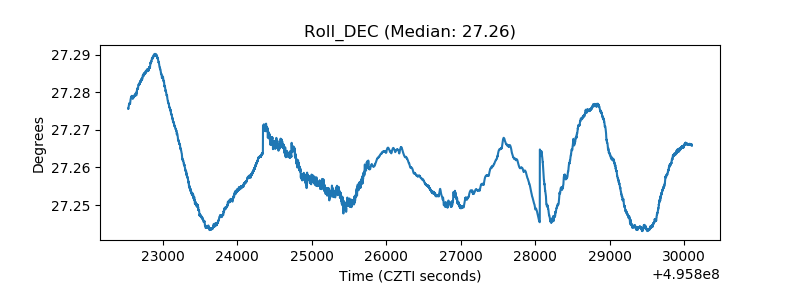 |
| _Roll_RA | 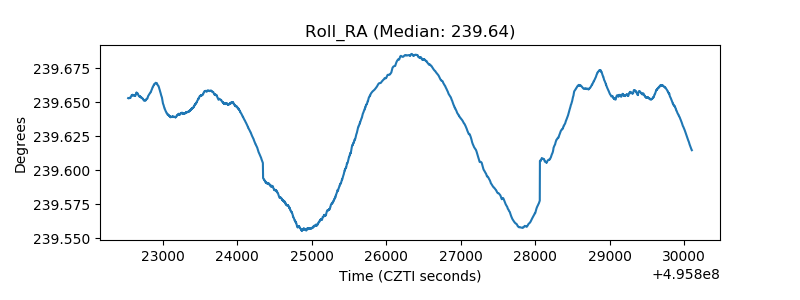 |
| Veto Counter | 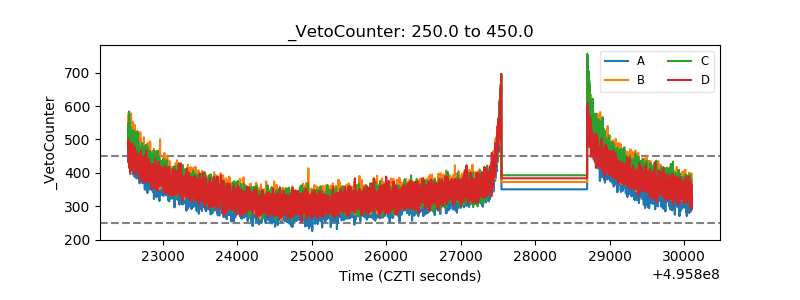 |