| Param | Original file | Final file |
|---|---|---|
| Filename | modeM0/AS1A14_057T04_9000006508_53949cztM0_level2.fits | modeM0/AS1A14_057T04_9000006508_53949cztM0_level2_quad_clean.evt |
| Size (bytes) | 755,902,080 | 73,347,840 |
| Size | 720.9 MB | 69.9 MB |
| Events in quadrant A | 2,914,482 | 614,399 |
| Events in quadrant B | 3,484,044 | 643,419 |
| Events in quadrant C | 7,852,032 | 399,084 |
| Events in quadrant D | 13,255,479 | 137,037 |
| Mode M0 | |||
|---|---|---|---|
| Quadrant | BADHDUFLAG | Total packets | Discarded packets |
| A | 0 | 13003 | 1 |
| B | 0 | 14556 | 6 |
| C | 0 | 27729 | 9 |
| D | 0 | 43536 | 26 |
| Mode SS | |||
|---|---|---|---|
| Quadrant | BADHDUFLAG | Total packets | Discarded packets |
| A | 0 | 124 | 0 |
| B | 0 | 124 | 0 |
| C | 0 | 124 | 0 |
| D | 0 | 124 | 0 |
| Mode M9 | |||
|---|---|---|---|
| Quadrant | BADHDUFLAG | Total packets | Discarded packets |
| A | 0 | 12 | 0 |
| B | 0 | 12 | 0 |
| C | 0 | 12 | 0 |
| D | 0 | 12 | 0 |
| Quadrant | Total seconds | Saturated seconds | Saturation percentage |
|---|---|---|---|
| A | 6117 | 61 | 0.997221% |
| B | 6113 | 202 | 3.304433% |
| C | 6117 | 2019 | 33.006376% |
| D | 6115 | 4685 | 76.614881% |
Noise dominated data is calculated using 1-second bins in cleaned event files. If a bin has >2000 counts, and if more than 50% of those come from <1% of pixels, then it is considered to be noise-dominated and hence unusable.
| Quadrant | # 1 sec bins | Bins with >0 counts | Bins with >2000 counts | High rate bins dominated by noise | Noise dominated (total time) | Noise dominated (detector-on time) | Marked lightcurve |
|---|---|---|---|---|---|---|---|
| A | 7297 | 6118 | 10 | 10 | 0.14% | 0.16% | 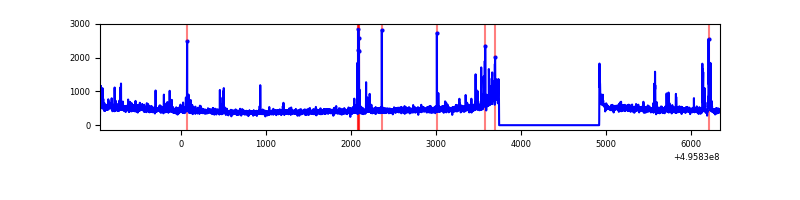 |
| B | 7297 | 6117 | 125 | 125 | 1.71% | 2.04% | 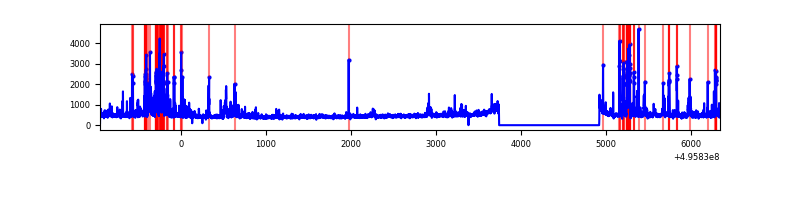 |
| C | 7298 | 6119 | 1936 | 1936 | 26.53% | 31.64% | 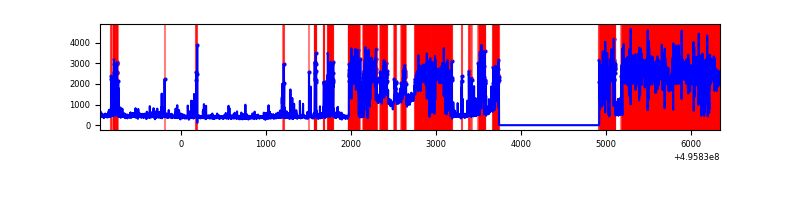 |
| D | 7298 | 6118 | 3853 | 3853 | 52.80% | 62.98% | 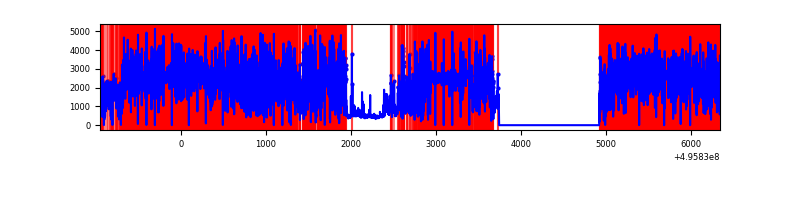 |
Top three noisy pixels from each quadrant. If the there are fewer than three noisy pixels in the level2.evt file, extra rows are filled as -1
| Pixel properties | Quadrant properties | ||||||
|---|---|---|---|---|---|---|---|
| Quadrant | DetID | PixID | Counts | Sigma | Mean | Median | Sigma |
| A | 15 | 174 | 77758 | 465.85 | 671 | 657 | 165.5 |
| A | 3 | 14 | 47046 | 280.29 | 671 | 657 | 165.5 |
| A | 0 | 8 | 36758 | 218.13 | 671 | 657 | 165.5 |
| B | 0 | 213 | 528540 | 3734.92 | 663 | 640 | 141.3 |
| B | 0 | 155 | 134139 | 944.51 | 663 | 640 | 141.3 |
| B | 5 | 250 | 84290 | 591.83 | 663 | 640 | 141.3 |
| C | 1 | 241 | 5457412 | 35810.95 | 551 | 546 | 152.4 |
| C | 12 | 2 | 61884 | 402.53 | 551 | 546 | 152.4 |
| C | 13 | 3 | 51903 | 337.03 | 551 | 546 | 152.4 |
| D | 8 | 176 | 11156706 | 130313.91 | 297 | 283 | 85.6 |
| D | 6 | 239 | 246007 | 2870.21 | 297 | 283 | 85.6 |
| D | 2 | 172 | 225211 | 2627.3 | 297 | 283 | 85.6 |
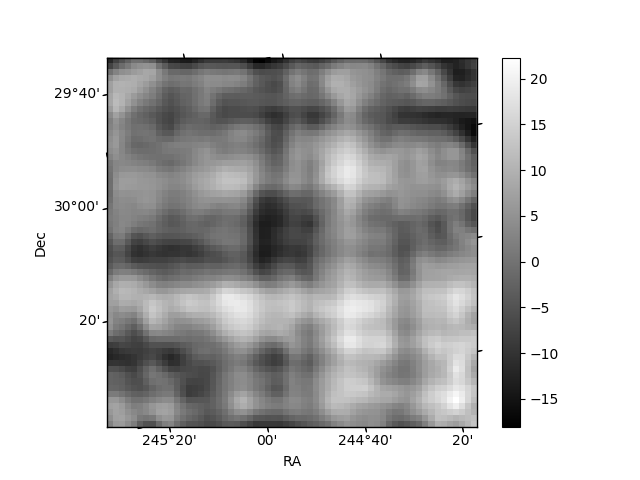
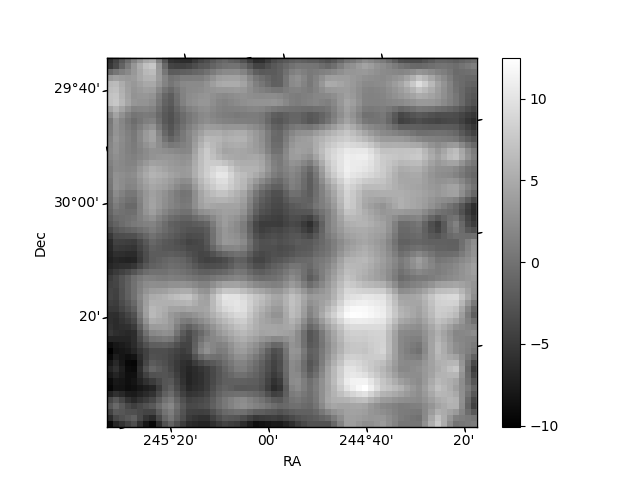
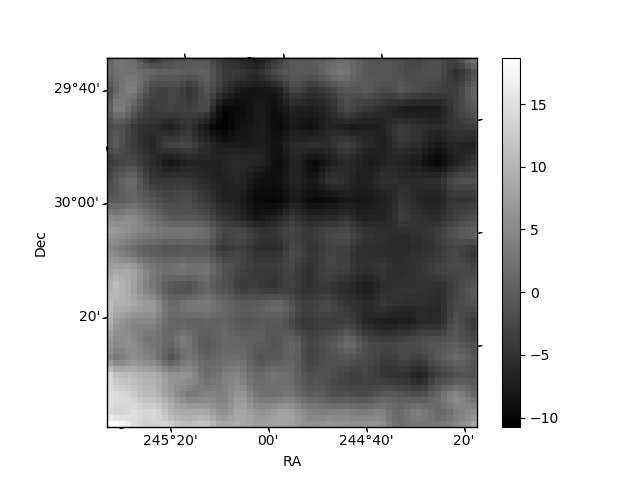
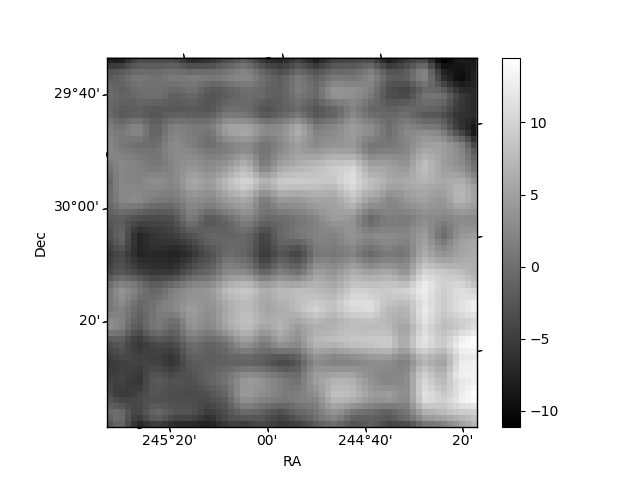
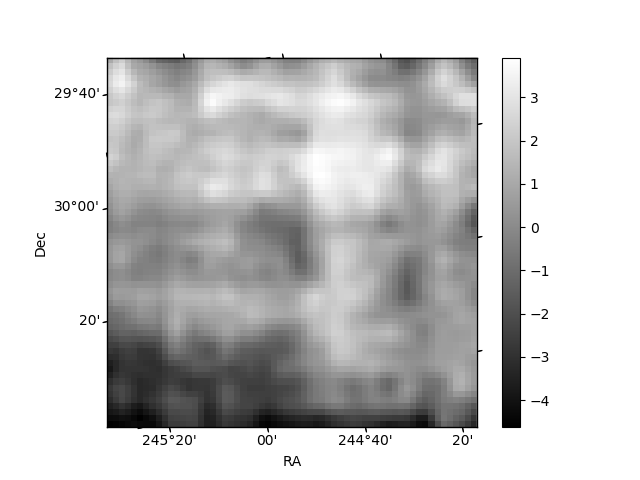
Histogram calculated using DETX and DETY for each event in the final _common_clean file
| Quadrant A | 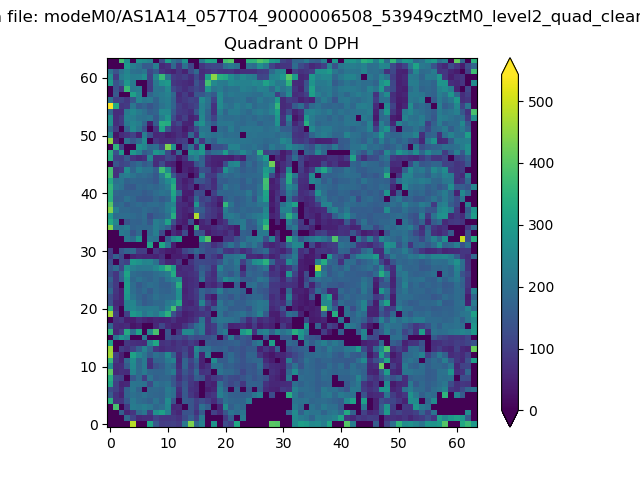 |
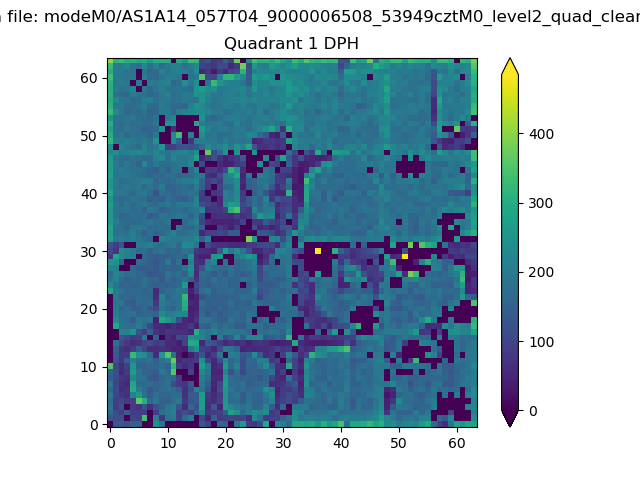 |
Quadrant B |
|---|---|---|---|
| Quadrant D | 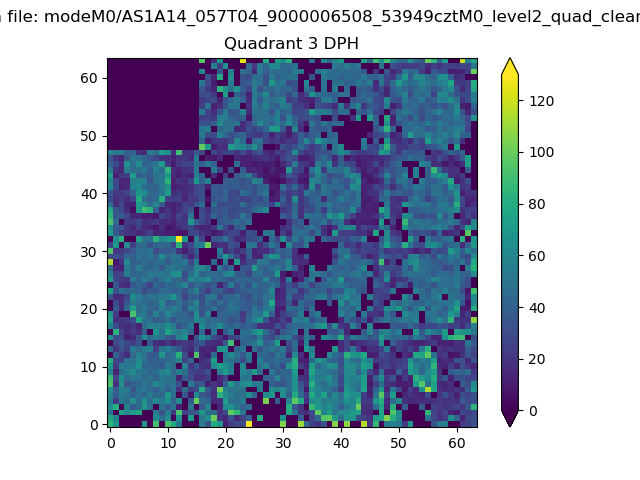 |
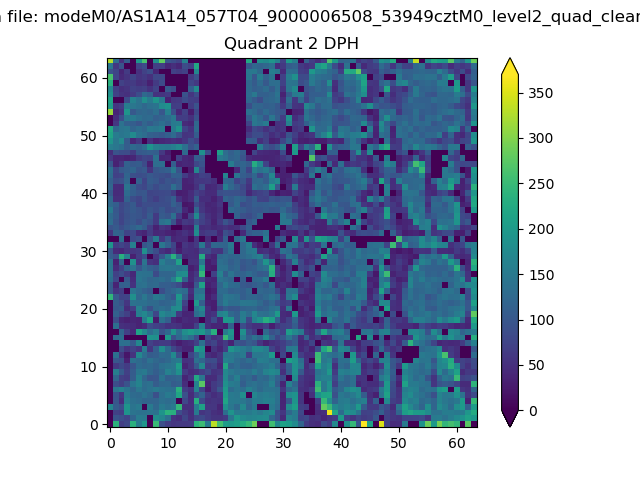 |
Quadrant C |
| Plot type | Count rate plots | Images |
|---|---|---|
| Comparison with Poisson distribution Blue bars denote a histogram of data divided into 1 sec bins. Red curve is a Poisson curve with rate = median count rate of data. |
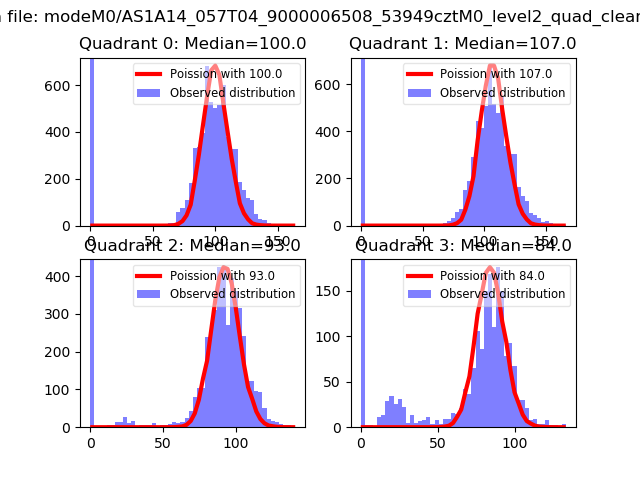 |
 |
| Quadrant-wise count rates Data is divided into 100 sec bins |
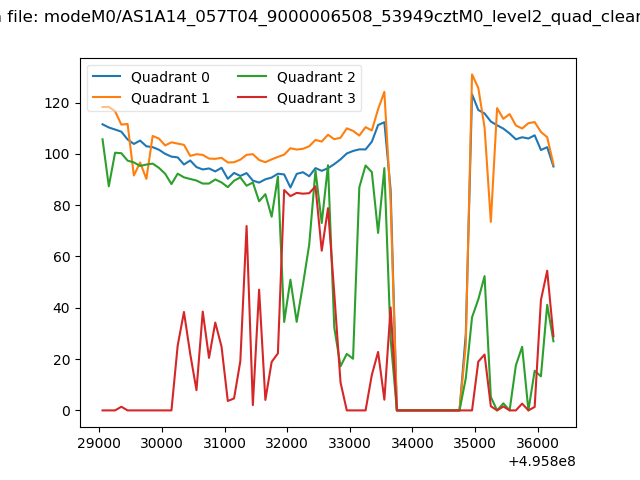 |
|
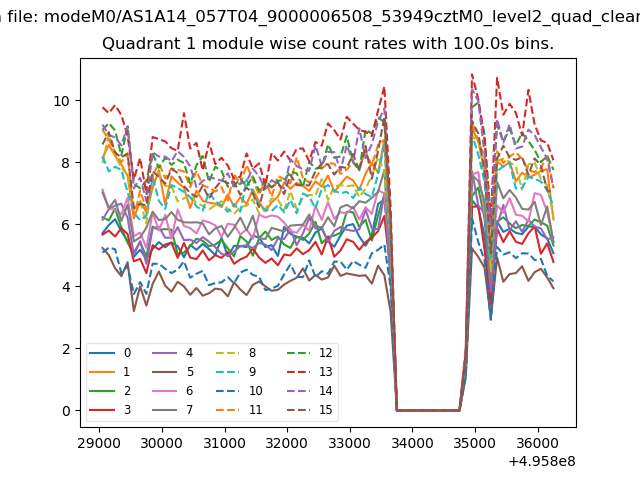
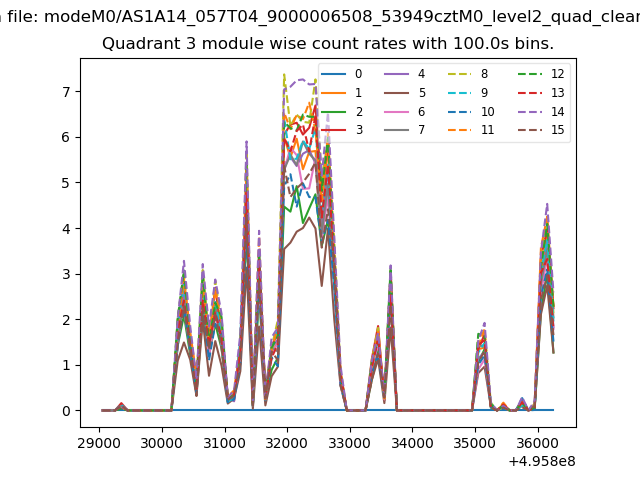
| Module-wise count rates for Quadrant A Data is divided into 100 sec bins |
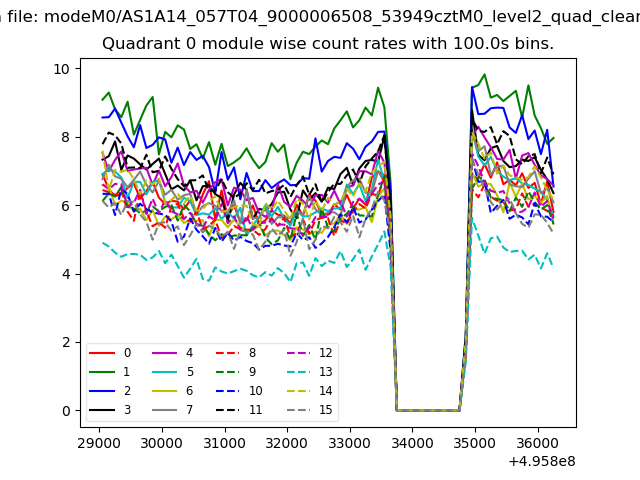 |
 |
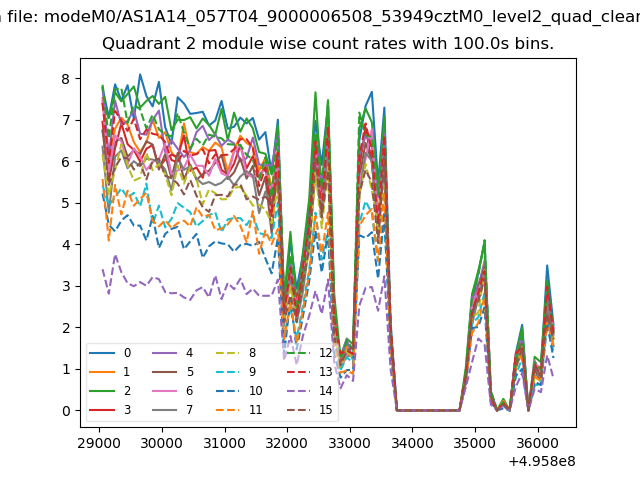
| Module-wise count rates for Quadrant B Data is divided into 100 sec bins |
 |
 |
| Module-wise count rates for Quadrant C Data is divided into 100 sec bins |
 |
 |
| Module-wise count rates for Quadrant D Data is divided into 100 sec bins |
 |
 |
| Parameter | Plot |
|---|---|
| CZT HV Monitor | 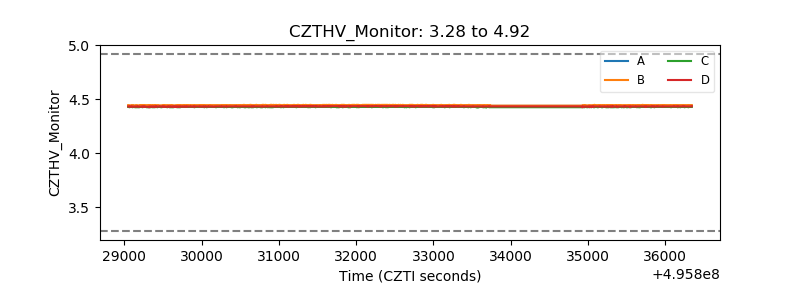 |
| D_VDD | 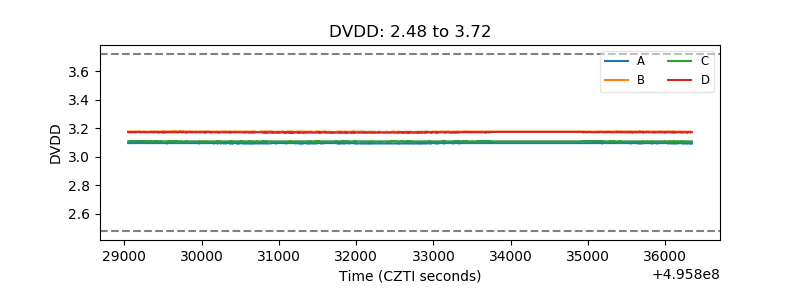 |
| Temperature 1 | 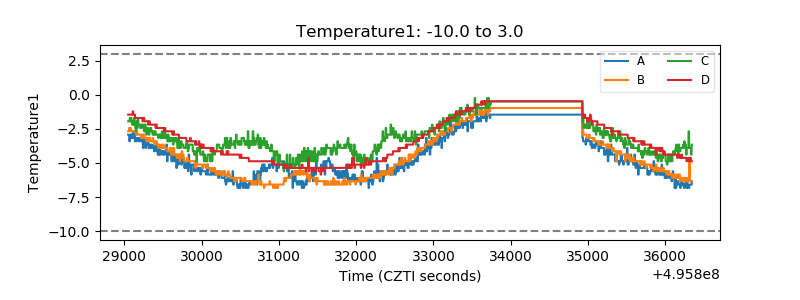 |
| Veto HV Monitor | 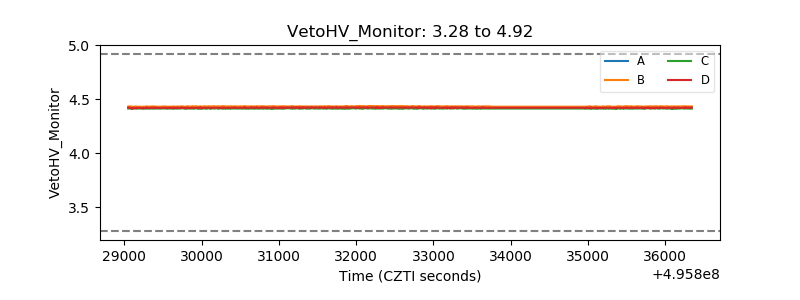 |
| Veto LLD | 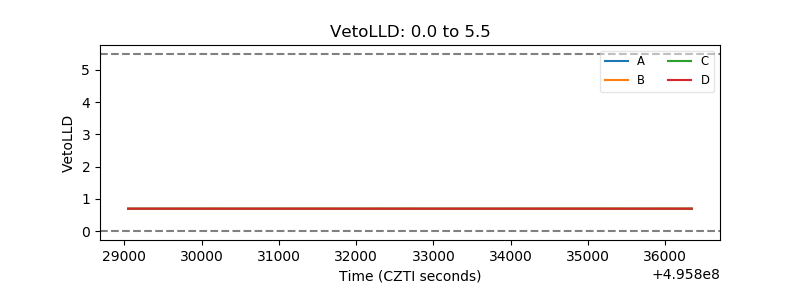 |
| Alpha Counter | 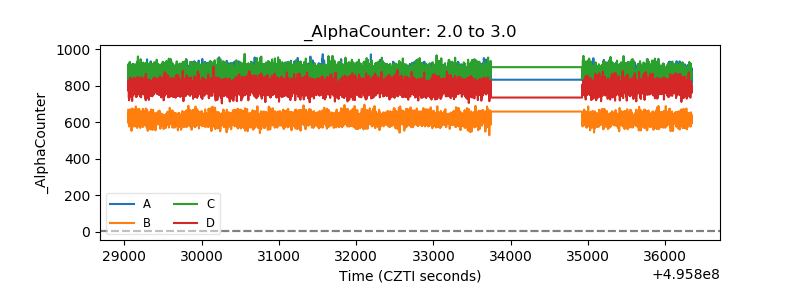 |
| _CPM_Rate | 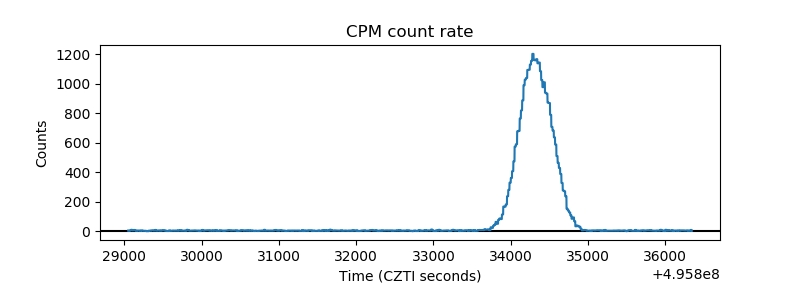 |
| CZT Counter | 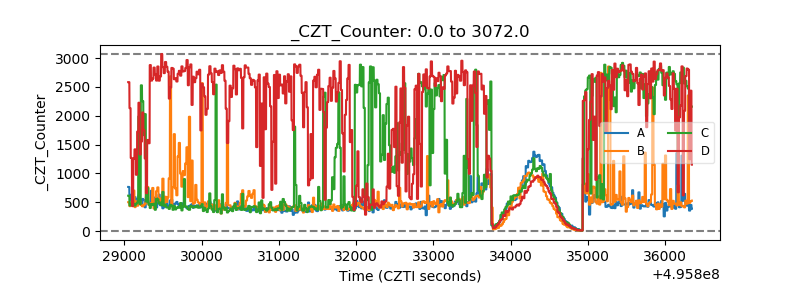 |
| +2.5 Volts monitor |  |
| +5 Volts monitor |  |
| _ROLL_ROT | 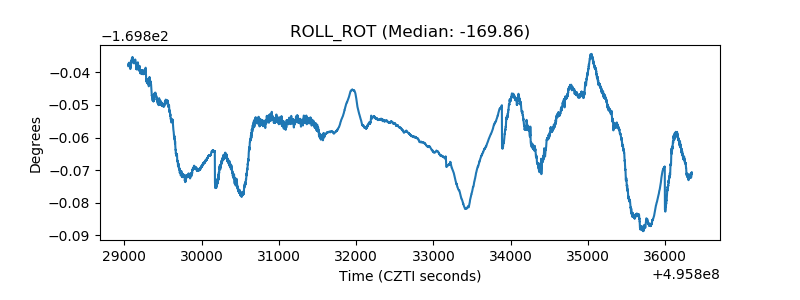 |
| _Roll_DEC | 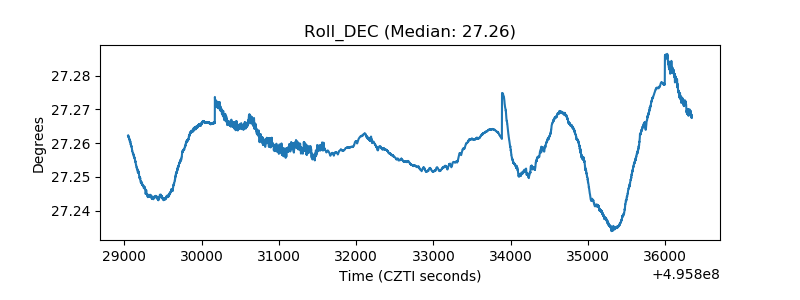 |
| _Roll_RA | 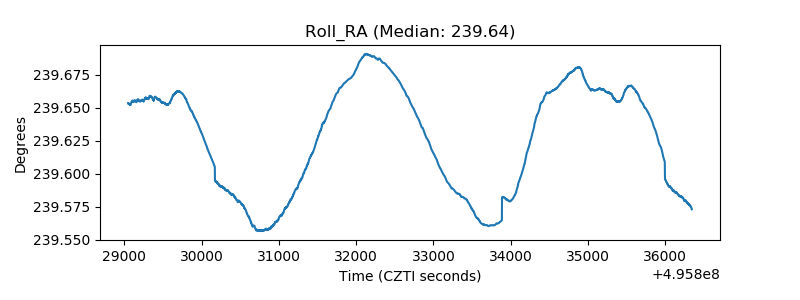 |
| Veto Counter | 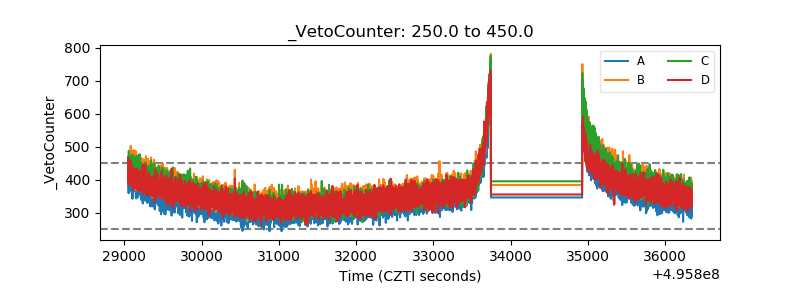 |