| Param | Original file | Final file |
|---|---|---|
| Filename | modeM0/AS1A14_057T04_9000006508_53950cztM0_level2.fits | modeM0/AS1A14_057T04_9000006508_53950cztM0_level2_quad_clean.evt |
| Size (bytes) | 940,109,760 | 53,357,760 |
| Size | 896.6 MB | 50.9 MB |
| Events in quadrant A | 3,249,612 | 476,598 |
| Events in quadrant B | 3,814,275 | 503,288 |
| Events in quadrant C | 13,739,132 | 103,979 |
| Events in quadrant D | 13,506,979 | 90,365 |
| Mode M0 | |||
|---|---|---|---|
| Quadrant | BADHDUFLAG | Total packets | Discarded packets |
| A | 0 | 14079 | 5 |
| B | 0 | 15682 | 13 |
| C | 0 | 45207 | 51 |
| D | 0 | 44541 | 85 |
| Mode SS | |||
|---|---|---|---|
| Quadrant | BADHDUFLAG | Total packets | Discarded packets |
| A | 0 | 128 | 0 |
| B | 0 | 128 | 0 |
| C | 0 | 128 | 0 |
| D | 0 | 128 | 0 |
| Mode M9 | |||
|---|---|---|---|
| Quadrant | BADHDUFLAG | Total packets | Discarded packets |
| A | 0 | 12 | 0 |
| B | 0 | 12 | 0 |
| C | 0 | 12 | 0 |
| D | 0 | 12 | 0 |
| Quadrant | Total seconds | Saturated seconds | Saturation percentage |
|---|---|---|---|
| A | 6327 | 67 | 1.058954% |
| B | 6323 | 244 | 3.858928% |
| C | 6322 | 4649 | 73.536855% |
| D | 6319 | 5238 | 82.892863% |
Noise dominated data is calculated using 1-second bins in cleaned event files. If a bin has >2000 counts, and if more than 50% of those come from <1% of pixels, then it is considered to be noise-dominated and hence unusable.
| Quadrant | # 1 sec bins | Bins with >0 counts | Bins with >2000 counts | High rate bins dominated by noise | Noise dominated (total time) | Noise dominated (detector-on time) | Marked lightcurve |
|---|---|---|---|---|---|---|---|
| A | 7555 | 6330 | 32 | 32 | 0.42% | 0.51% | 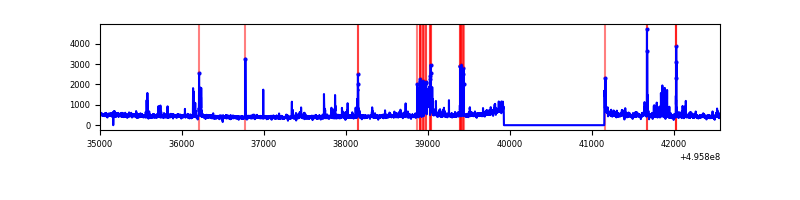 |
| B | 7555 | 6329 | 133 | 133 | 1.76% | 2.10% | 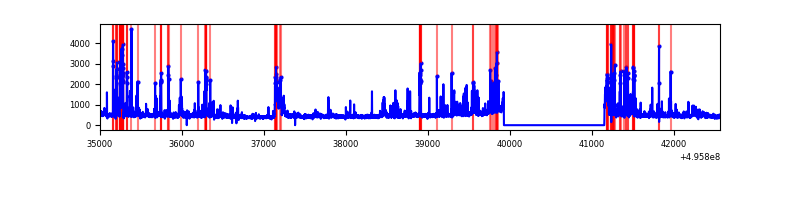 |
| C | 7555 | 6330 | 4535 | 4535 | 60.03% | 71.64% | 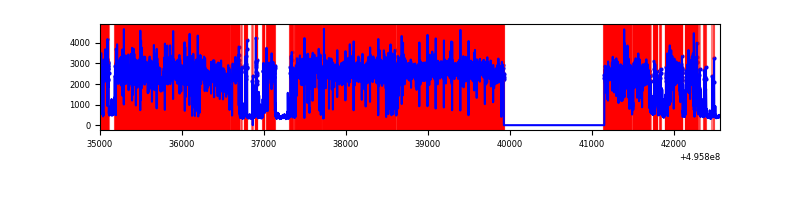 |
| D | 7554 | 6322 | 3936 | 3936 | 52.10% | 62.26% | 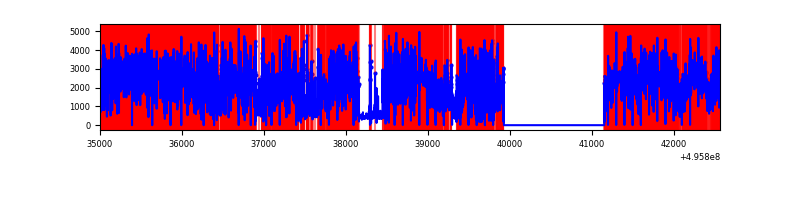 |
Top three noisy pixels from each quadrant. If the there are fewer than three noisy pixels in the level2.evt file, extra rows are filled as -1
| Pixel properties | Quadrant properties | ||||||
|---|---|---|---|---|---|---|---|
| Quadrant | DetID | PixID | Counts | Sigma | Mean | Median | Sigma |
| A | 13 | 248 | 178752 | 1033.88 | 696 | 679 | 172.2 |
| A | 15 | 174 | 146477 | 846.49 | 696 | 679 | 172.2 |
| A | 3 | 14 | 42456 | 242.55 | 696 | 679 | 172.2 |
| B | 0 | 213 | 496344 | 3391.16 | 685 | 662 | 146.2 |
| B | 0 | 155 | 201517 | 1374.13 | 685 | 662 | 146.2 |
| B | 6 | 255 | 135206 | 920.47 | 685 | 662 | 146.2 |
| C | 1 | 241 | 11555057 | 100463.74 | 415 | 412 | 115.0 |
| C | 13 | 3 | 387692 | 3367.27 | 415 | 412 | 115.0 |
| C | 12 | 249 | 69111 | 597.31 | 415 | 412 | 115.0 |
| D | 8 | 176 | 11221074 | 151382.41 | 253 | 242 | 74.1 |
| D | 2 | 165 | 380216 | 5126.3 | 253 | 242 | 74.1 |
| D | 6 | 239 | 305028 | 4111.93 | 253 | 242 | 74.1 |
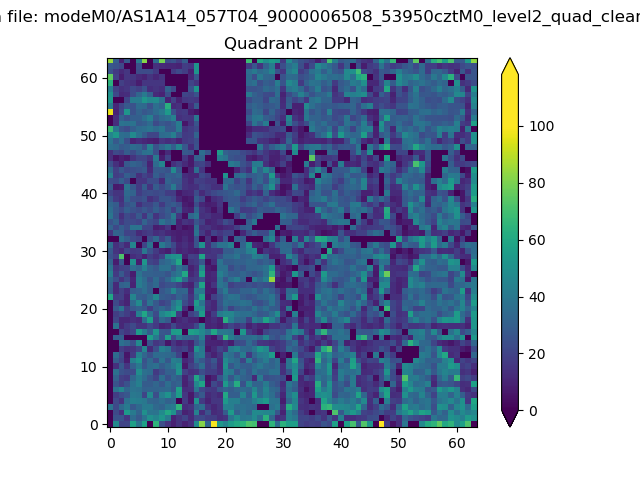
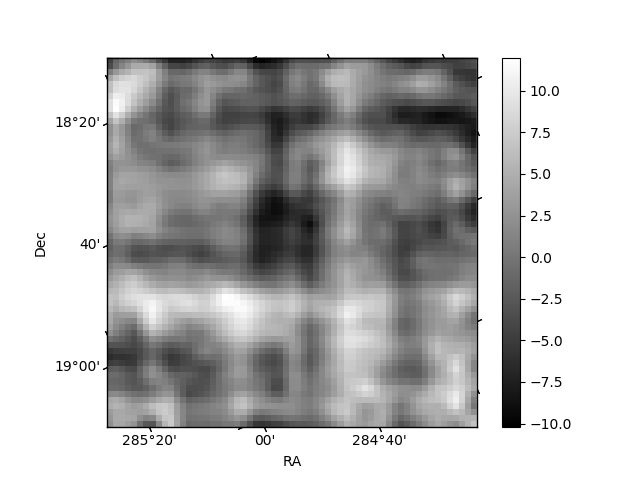
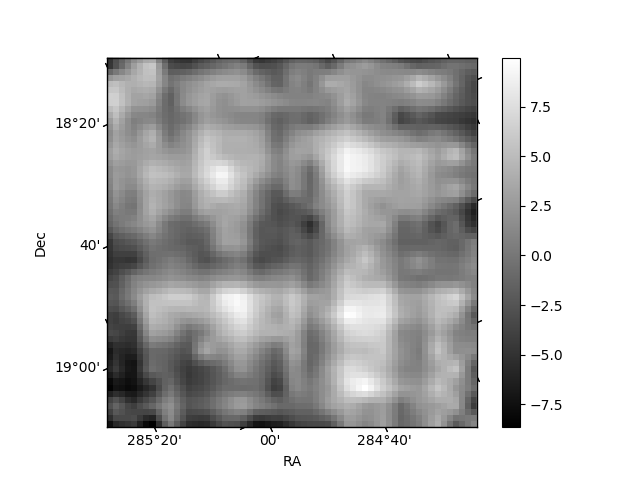
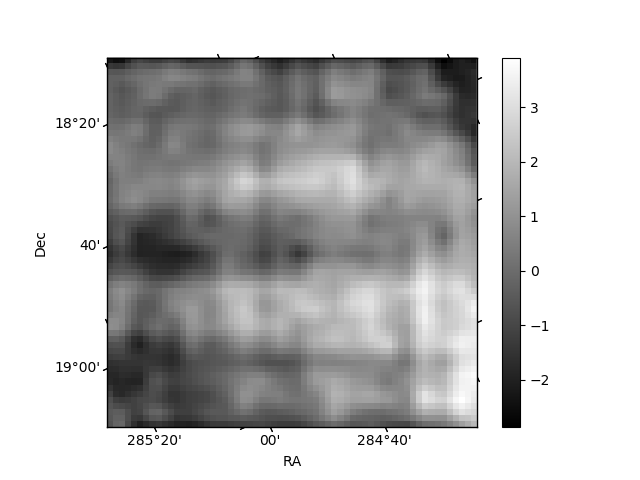
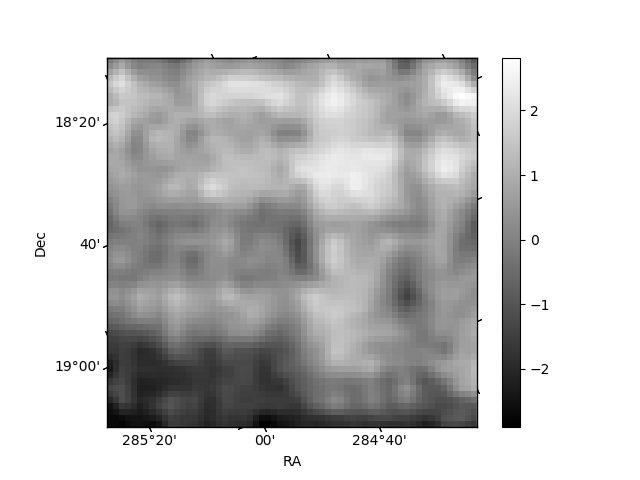
Histogram calculated using DETX and DETY for each event in the final _common_clean file
| Quadrant A | 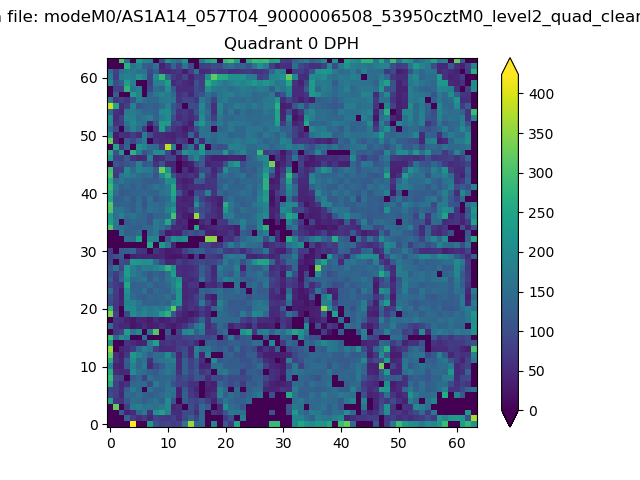 |
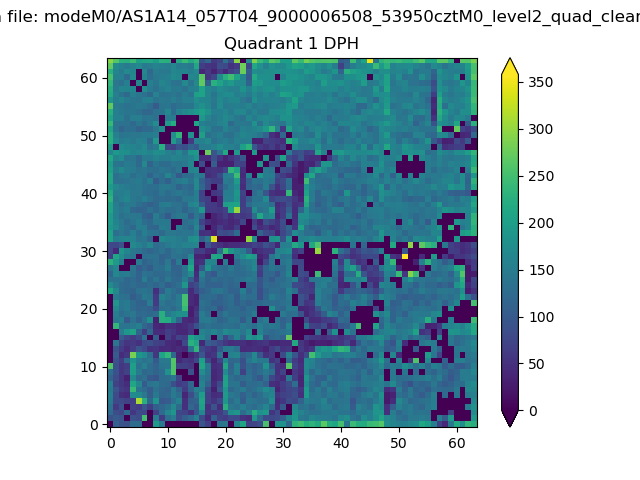 |
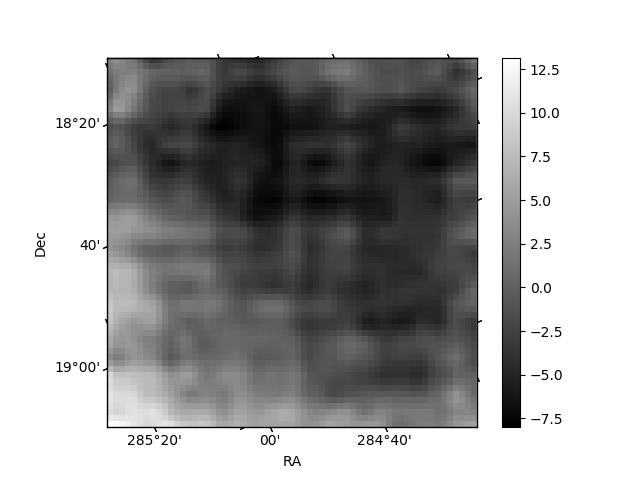
Quadrant B |
|---|---|---|---|
| Quadrant D | 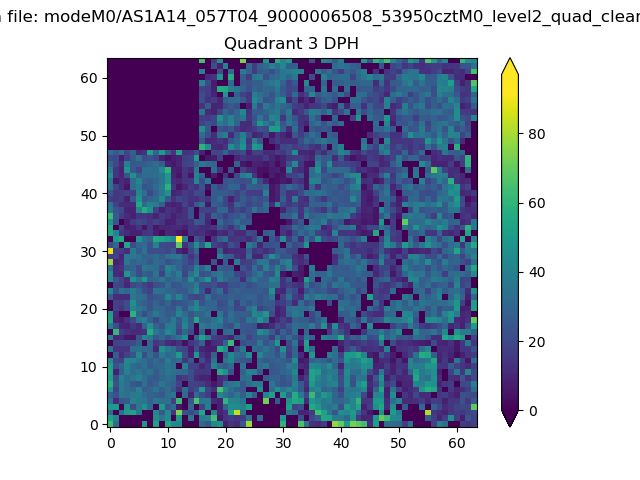 |
 |
Quadrant C |
| Plot type | Count rate plots | Images |
|---|---|---|
| Comparison with Poisson distribution Blue bars denote a histogram of data divided into 1 sec bins. Red curve is a Poisson curve with rate = median count rate of data. |
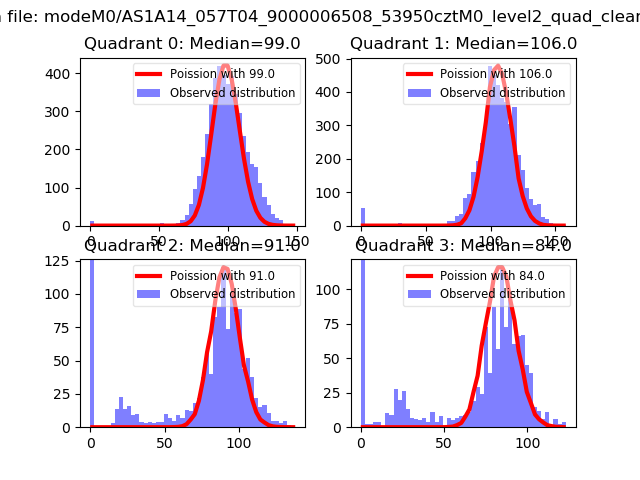 |
 |
| Quadrant-wise count rates Data is divided into 100 sec bins |
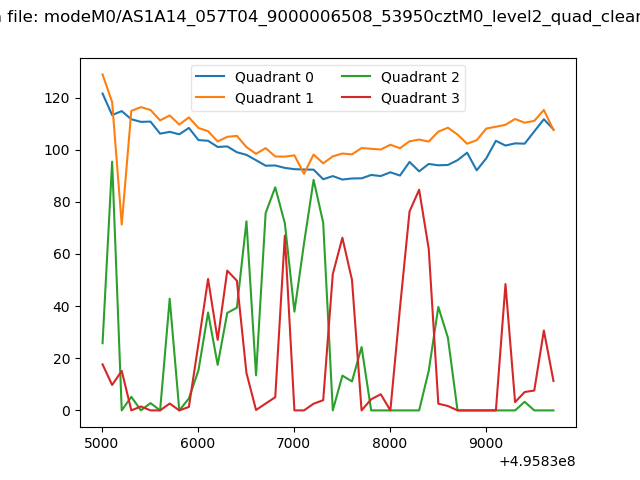 |
|
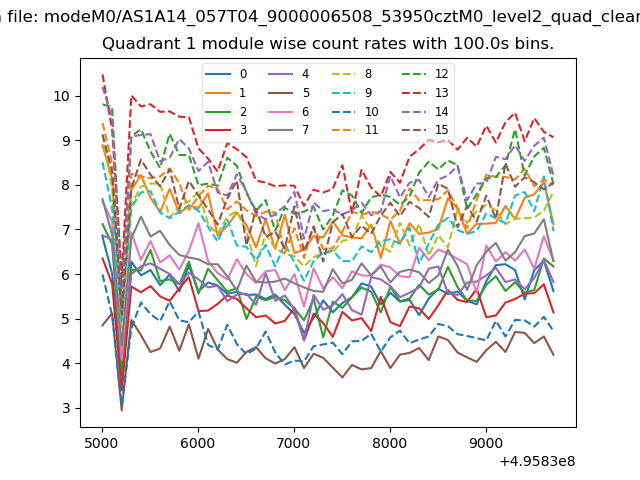
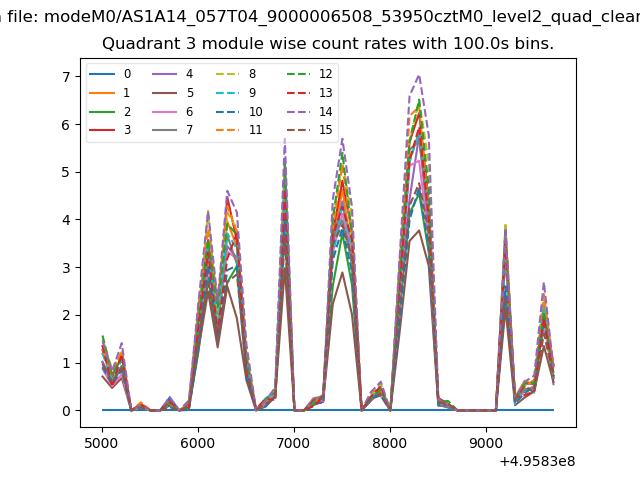
| Module-wise count rates for Quadrant A Data is divided into 100 sec bins |
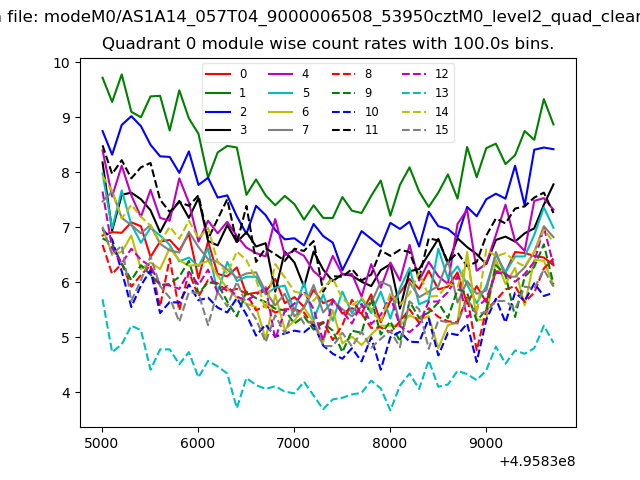 |
 |
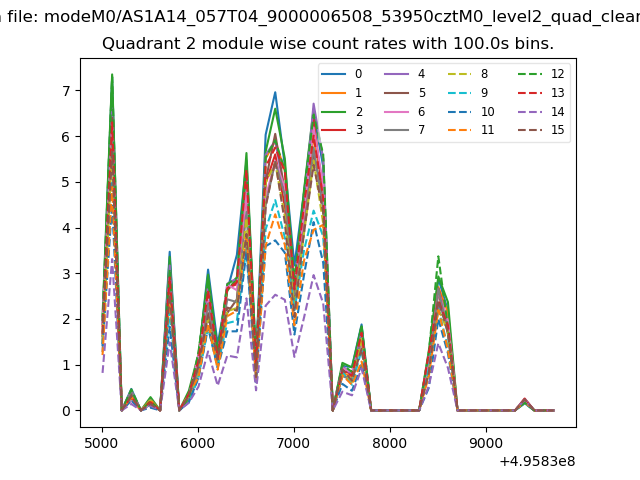
| Module-wise count rates for Quadrant B Data is divided into 100 sec bins |
 |
 |
| Module-wise count rates for Quadrant C Data is divided into 100 sec bins |
 |
 |
| Module-wise count rates for Quadrant D Data is divided into 100 sec bins |
 |
 |
| Parameter | Plot |
|---|---|
| CZT HV Monitor | 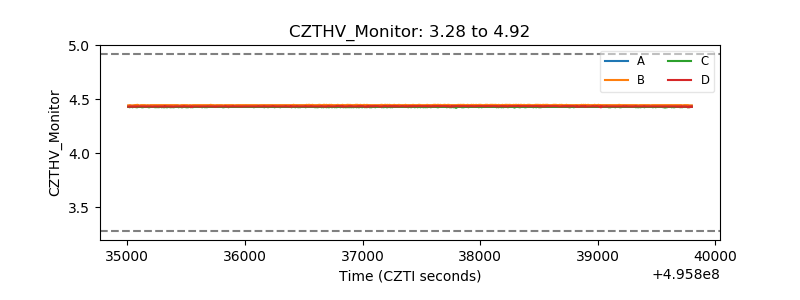 |
| D_VDD | 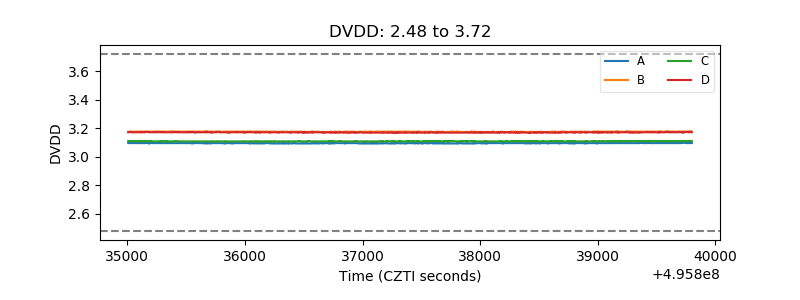 |
| Temperature 1 | 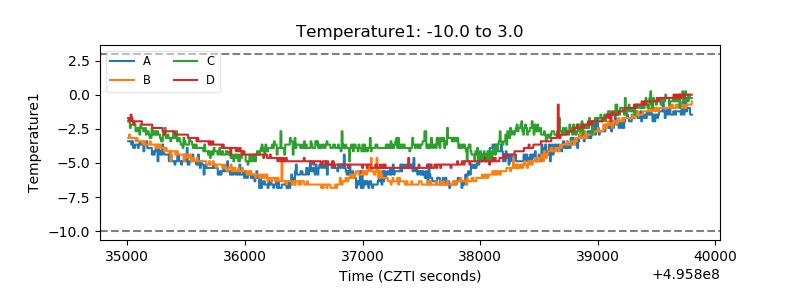 |
| Veto HV Monitor | 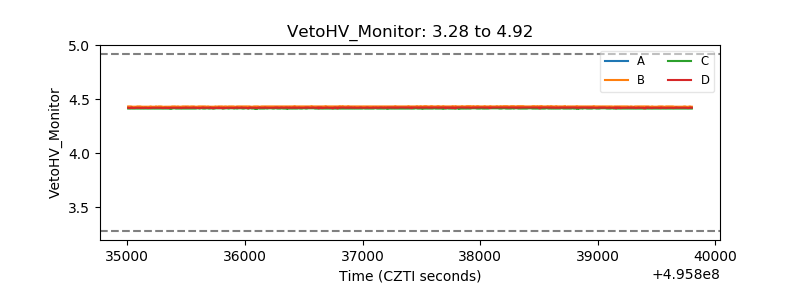 |
| Veto LLD | 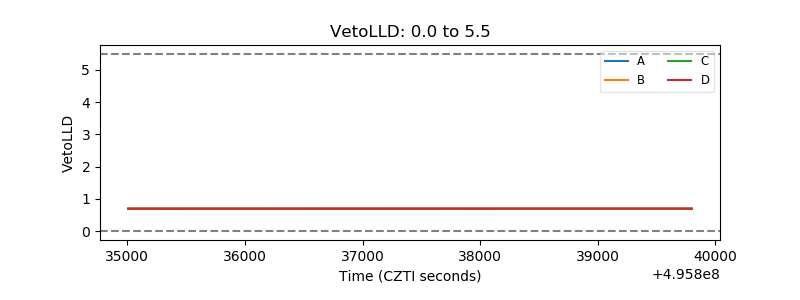 |
| Alpha Counter | 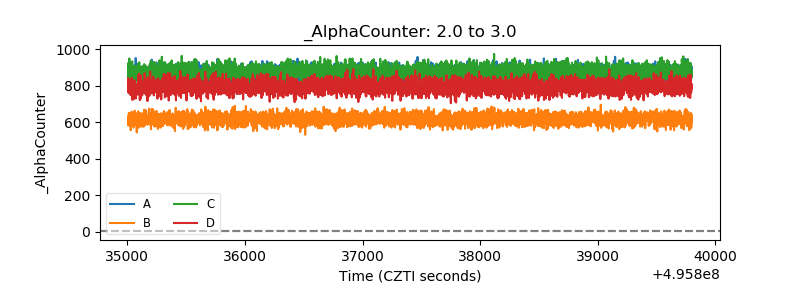 |
| _CPM_Rate | 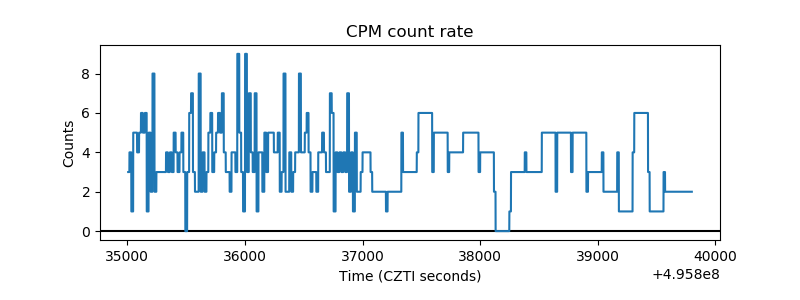 |
| CZT Counter | 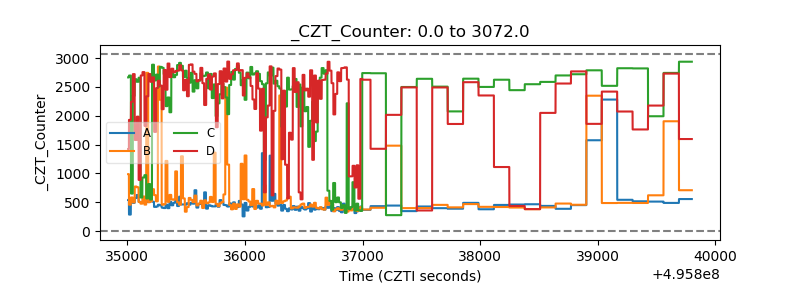 |
| +2.5 Volts monitor |  |
| +5 Volts monitor | 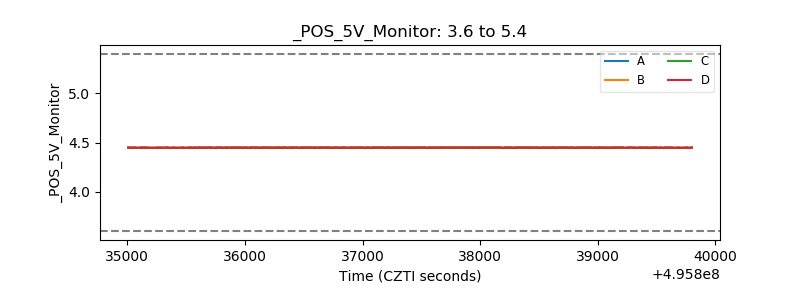 |
| _ROLL_ROT | 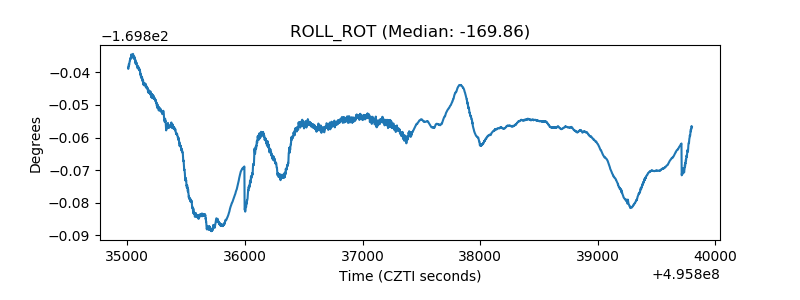 |
| _Roll_DEC | 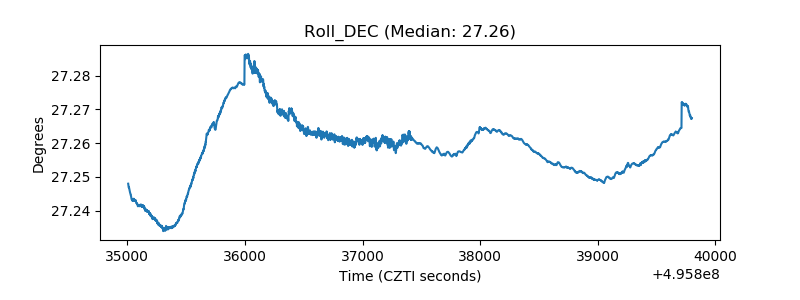 |
| _Roll_RA | 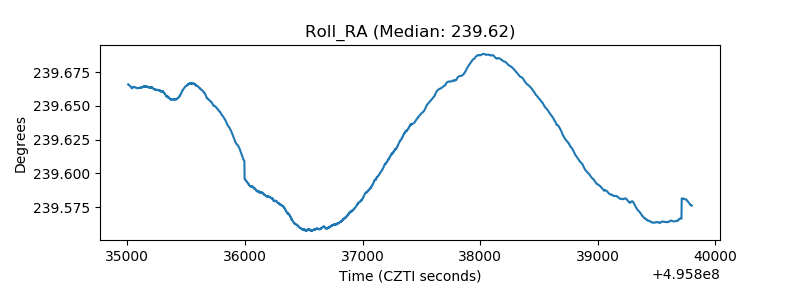 |
| Veto Counter | 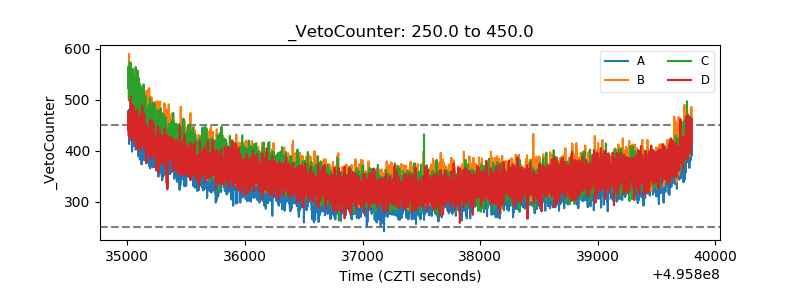 |