| Param | Original file | Final file |
|---|---|---|
| Filename | modeM0/AS1A14_057T04_9000006508_53951cztM0_level2.fits | modeM0/AS1A14_057T04_9000006508_53951cztM0_level2_quad_clean.evt |
| Size (bytes) | 779,302,080 | 78,105,600 |
| Size | 743.2 MB | 74.5 MB |
| Events in quadrant A | 3,303,154 | 640,878 |
| Events in quadrant B | 3,729,344 | 672,091 |
| Events in quadrant C | 7,306,667 | 496,092 |
| Events in quadrant D | 14,000,391 | 100,053 |
| Mode M0 | |||
|---|---|---|---|
| Quadrant | BADHDUFLAG | Total packets | Discarded packets |
| A | 0 | 14430 | 1 |
| B | 0 | 15798 | 2 |
| C | 0 | 26187 | 1 |
| D | 0 | 46063 | 1 |
| Mode SS | |||
|---|---|---|---|
| Quadrant | BADHDUFLAG | Total packets | Discarded packets |
| A | 0 | 132 | 0 |
| B | 0 | 132 | 0 |
| C | 0 | 132 | 0 |
| D | 0 | 132 | 0 |
| Mode M9 | |||
|---|---|---|---|
| Quadrant | BADHDUFLAG | Total packets | Discarded packets |
| A | 0 | 12 | 0 |
| B | 0 | 12 | 0 |
| C | 0 | 12 | 0 |
| D | 0 | 12 | 0 |
| Quadrant | Total seconds | Saturated seconds | Saturation percentage |
|---|---|---|---|
| A | 6534 | 67 | 1.025406% |
| B | 6533 | 197 | 3.015460% |
| C | 6533 | 1376 | 21.062299% |
| D | 6533 | 5523 | 84.540028% |
Noise dominated data is calculated using 1-second bins in cleaned event files. If a bin has >2000 counts, and if more than 50% of those come from <1% of pixels, then it is considered to be noise-dominated and hence unusable.
| Quadrant | # 1 sec bins | Bins with >0 counts | Bins with >2000 counts | High rate bins dominated by noise | Noise dominated (total time) | Noise dominated (detector-on time) | Marked lightcurve |
|---|---|---|---|---|---|---|---|
| A | 7679 | 6535 | 48 | 48 | 0.63% | 0.73% | 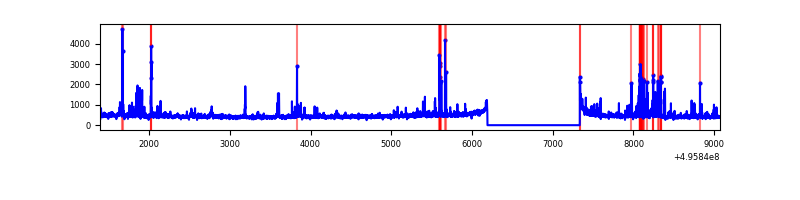 |
| B | 7678 | 6534 | 84 | 84 | 1.09% | 1.29% | 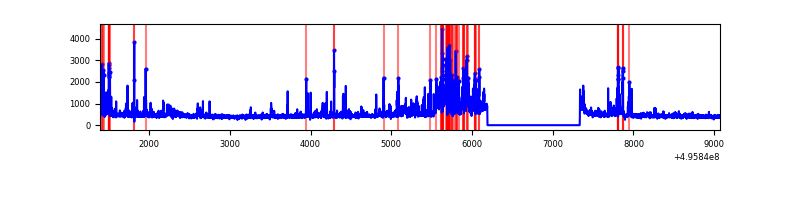 |
| C | 7678 | 6534 | 1234 | 1234 | 16.07% | 18.89% | 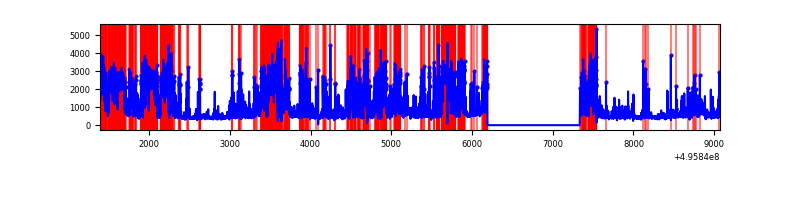 |
| D | 7677 | 6530 | 3994 | 3994 | 52.03% | 61.16% | 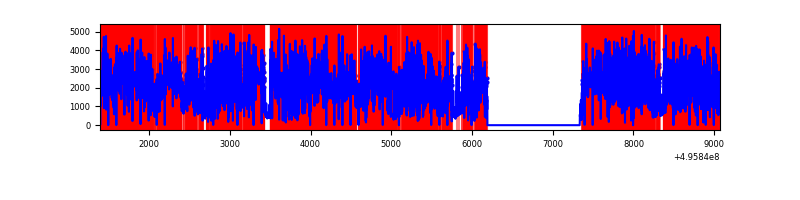 |
Top three noisy pixels from each quadrant. If the there are fewer than three noisy pixels in the level2.evt file, extra rows are filled as -1
| Pixel properties | Quadrant properties | ||||||
|---|---|---|---|---|---|---|---|
| Quadrant | DetID | PixID | Counts | Sigma | Mean | Median | Sigma |
| A | 12 | 115 | 174593 | 994.84 | 708 | 691 | 174.8 |
| A | 15 | 174 | 135314 | 770.14 | 708 | 691 | 174.8 |
| A | 3 | 14 | 35769 | 200.67 | 708 | 691 | 174.8 |
| B | 0 | 213 | 536533 | 3533.9 | 700 | 676 | 151.6 |
| B | 0 | 155 | 174863 | 1148.74 | 700 | 676 | 151.6 |
| B | 5 | 185 | 73416 | 479.71 | 700 | 676 | 151.6 |
| C | 1 | 241 | 2523101 | 14580.86 | 627 | 622 | 173.0 |
| C | 13 | 3 | 1497228 | 8650.94 | 627 | 622 | 173.0 |
| C | 9 | 38 | 386819 | 2232.36 | 627 | 622 | 173.0 |
| D | 8 | 176 | 11926902 | 166061.41 | 243 | 231 | 71.8 |
| D | 10 | 172 | 256705 | 3571.02 | 243 | 231 | 71.8 |
| D | 6 | 239 | 207707 | 2888.8 | 243 | 231 | 71.8 |
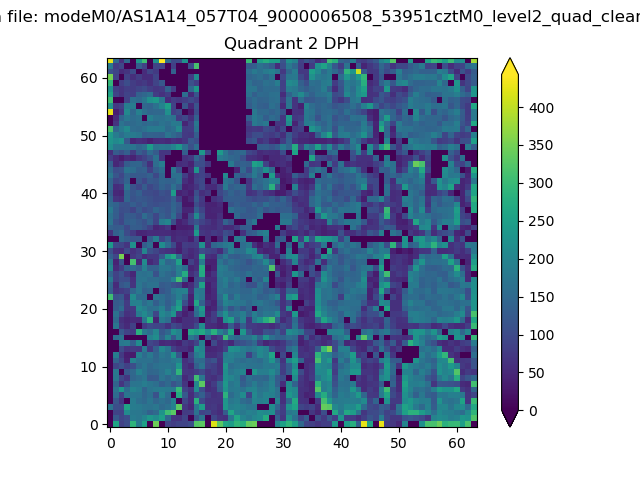
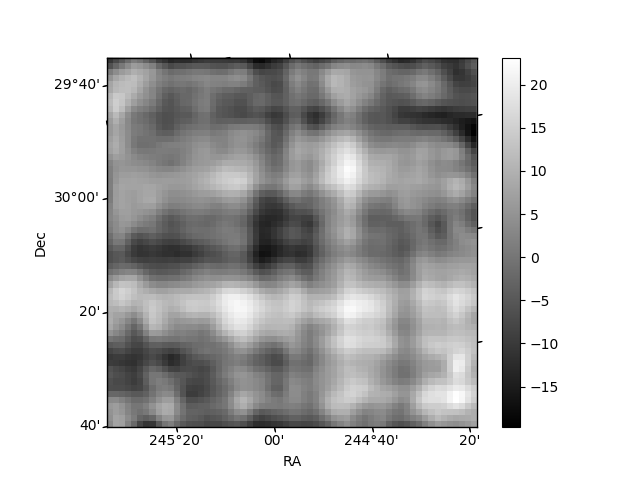
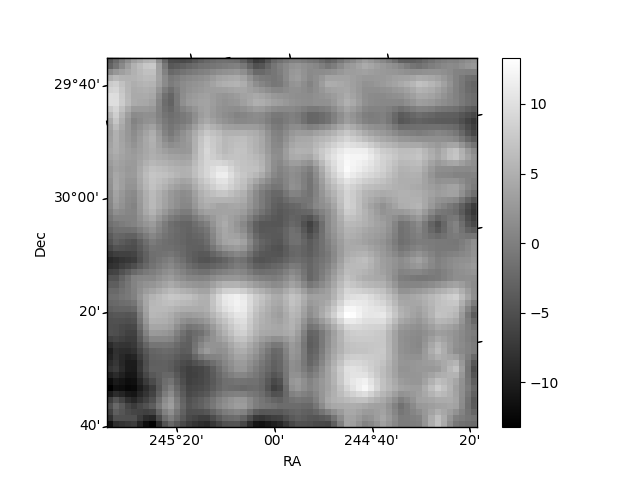
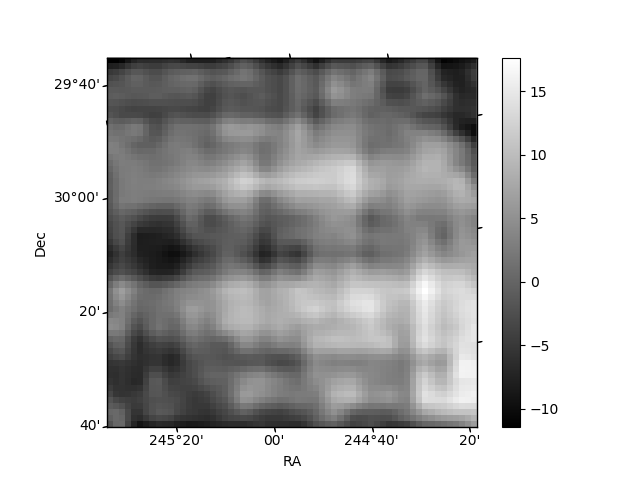
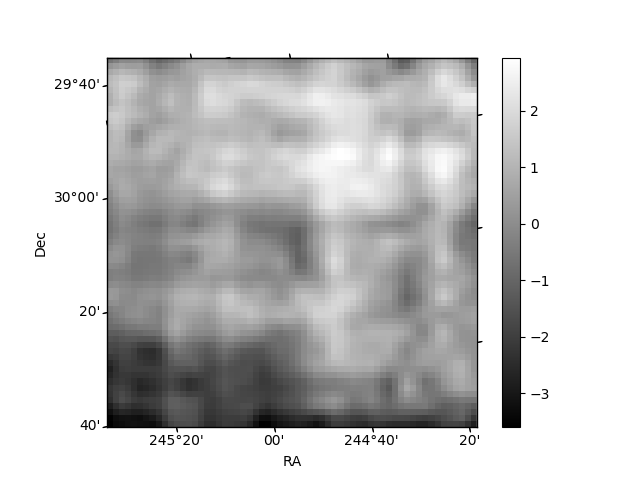
Histogram calculated using DETX and DETY for each event in the final _common_clean file
| Quadrant A | 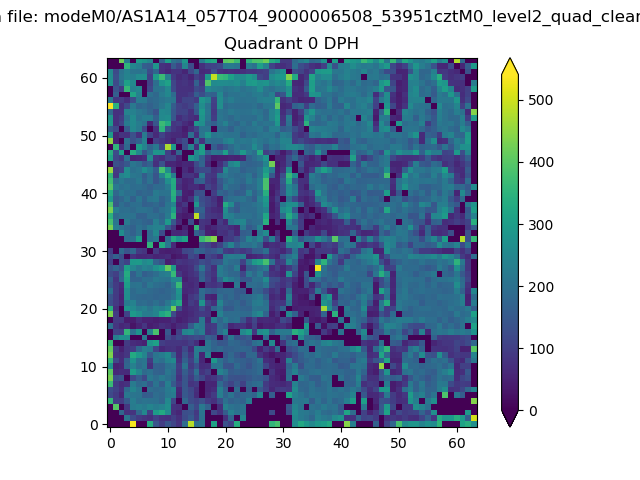 |
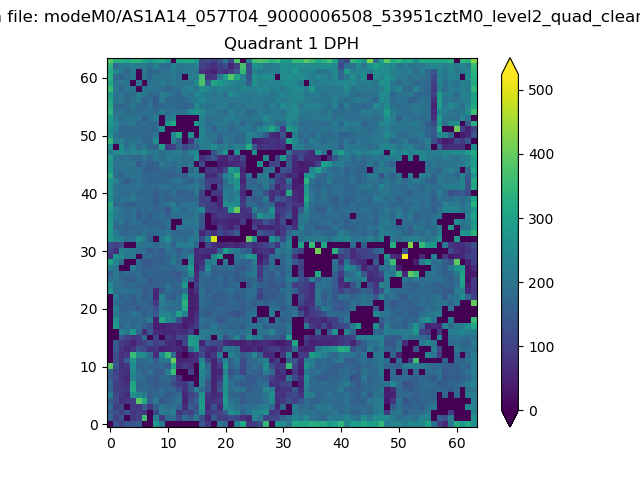 |
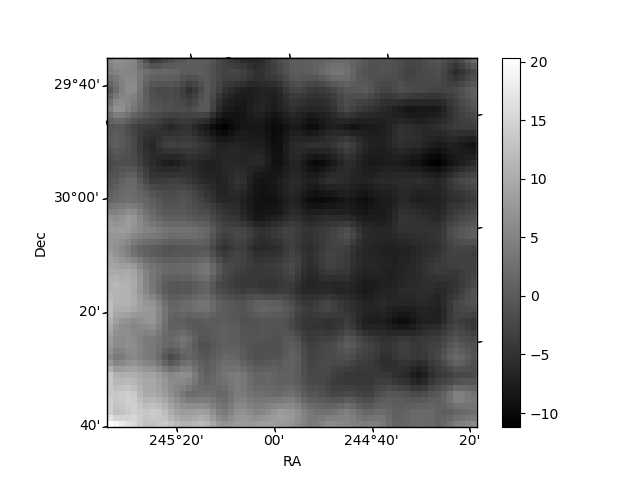
Quadrant B |
|---|---|---|---|
| Quadrant D | 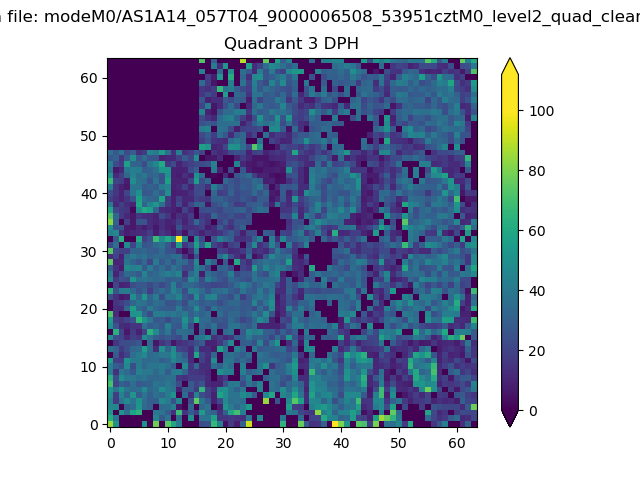 |
 |
Quadrant C |
| Plot type | Count rate plots | Images |
|---|---|---|
| Comparison with Poisson distribution Blue bars denote a histogram of data divided into 1 sec bins. Red curve is a Poisson curve with rate = median count rate of data. |
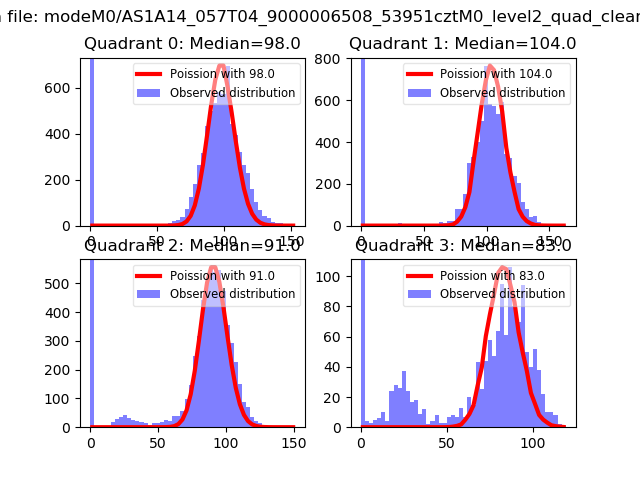 |
 |
| Quadrant-wise count rates Data is divided into 100 sec bins |
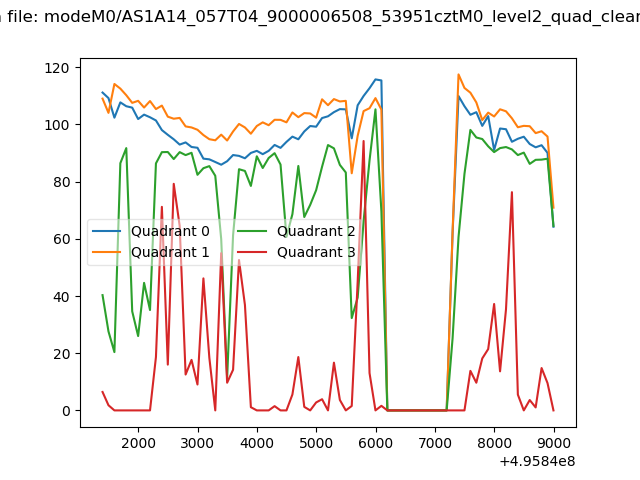 |
|
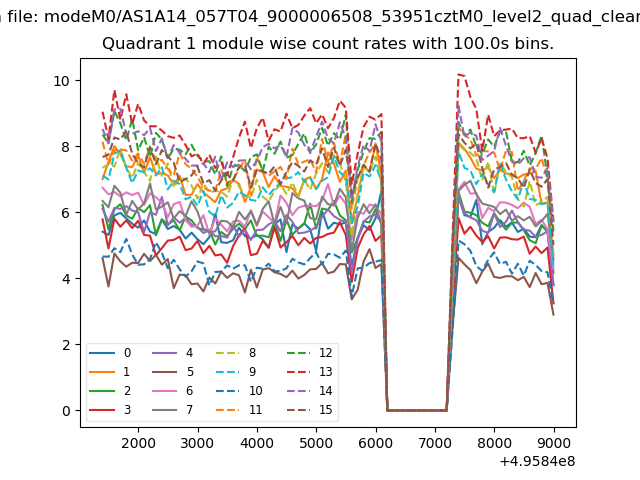
| Module-wise count rates for Quadrant A Data is divided into 100 sec bins |
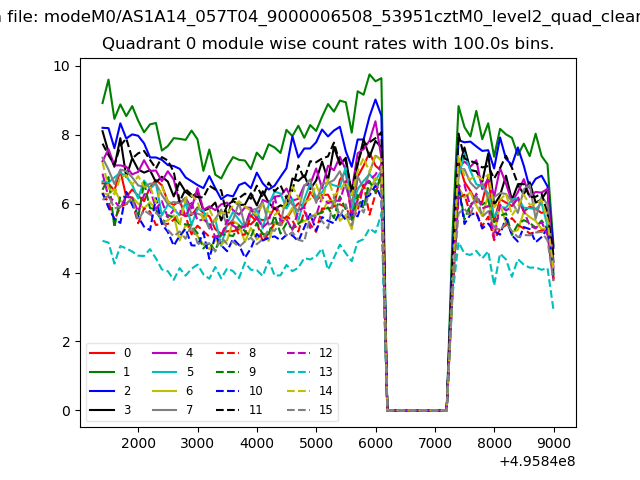 |
 |
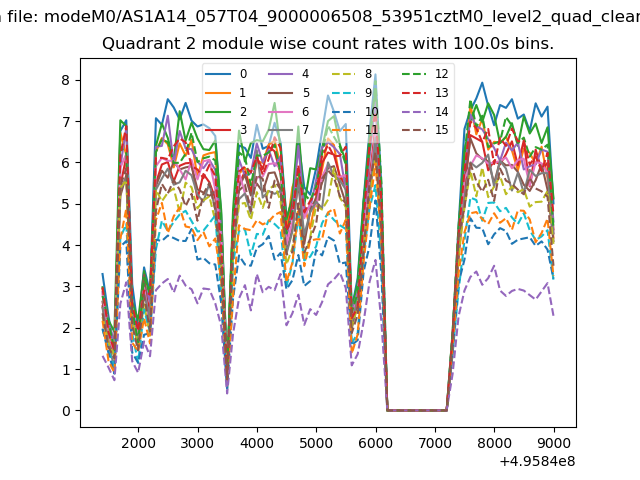
| Module-wise count rates for Quadrant B Data is divided into 100 sec bins |
 |
 |
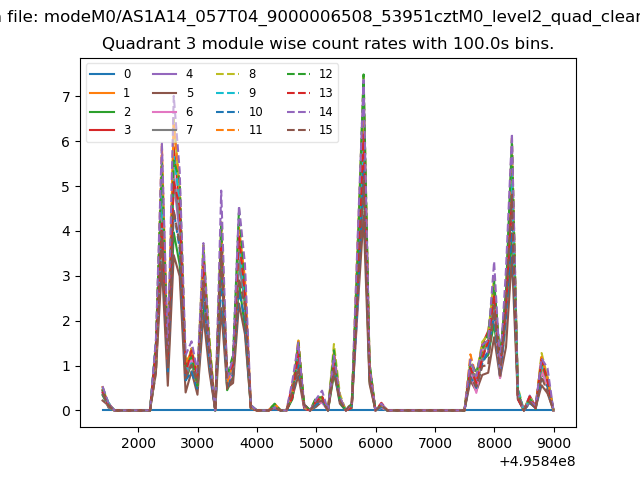
| Module-wise count rates for Quadrant C Data is divided into 100 sec bins |
 |
 |
| Module-wise count rates for Quadrant D Data is divided into 100 sec bins |
 |
 |
| Parameter | Plot |
|---|---|
| CZT HV Monitor | 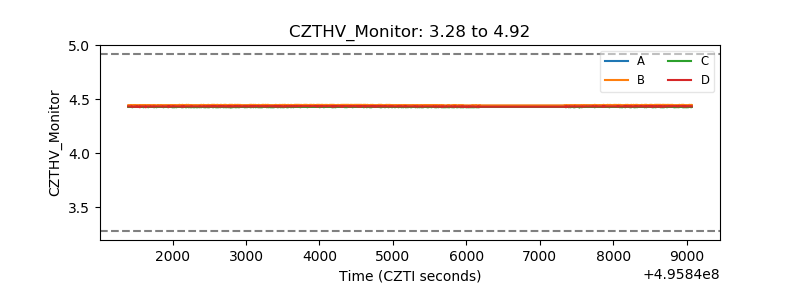 |
| D_VDD | 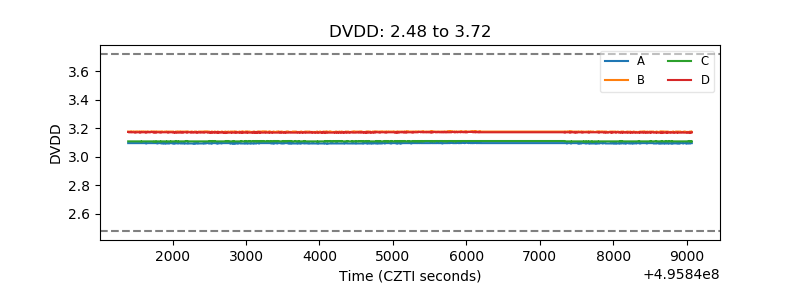 |
| Temperature 1 | 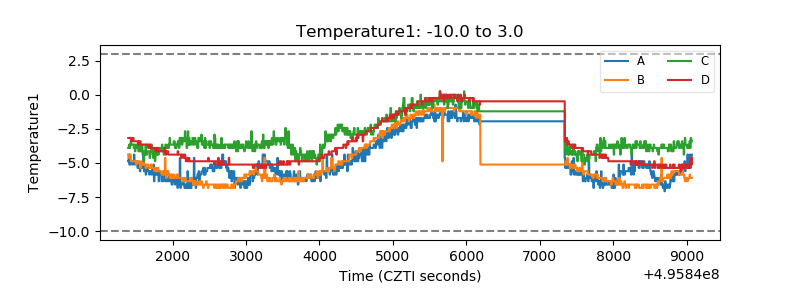 |
| Veto HV Monitor | 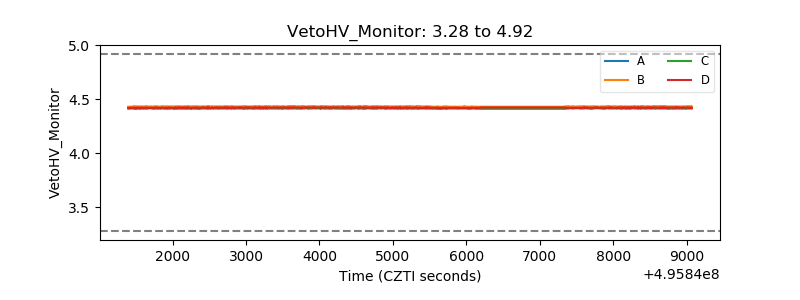 |
| Veto LLD | 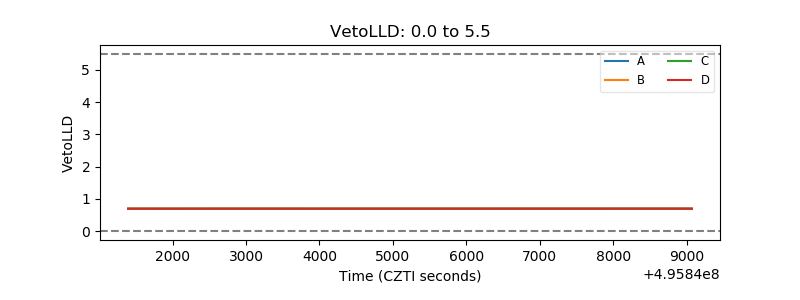 |
| Alpha Counter | 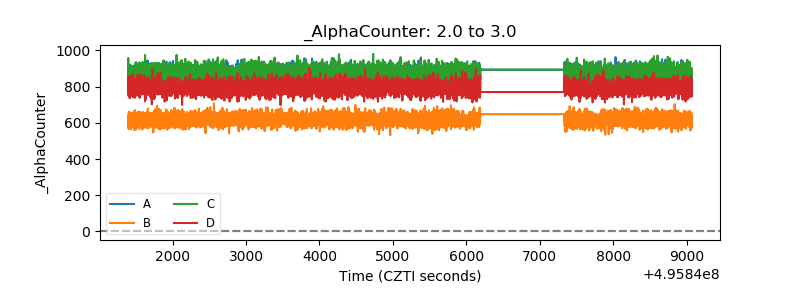 |
| _CPM_Rate | 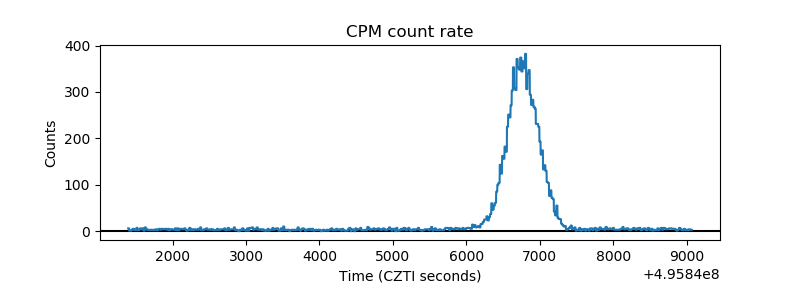 |
| CZT Counter | 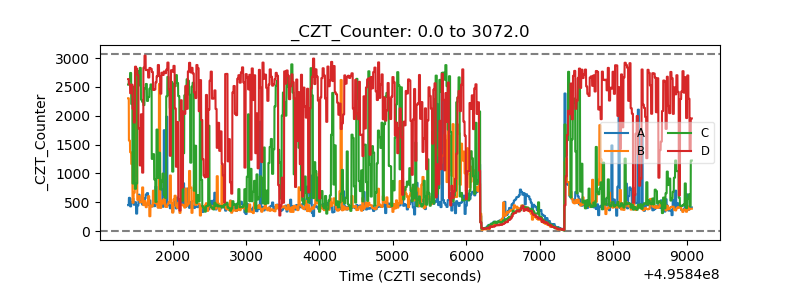 |
| +2.5 Volts monitor |  |
| +5 Volts monitor |  |
| _ROLL_ROT | 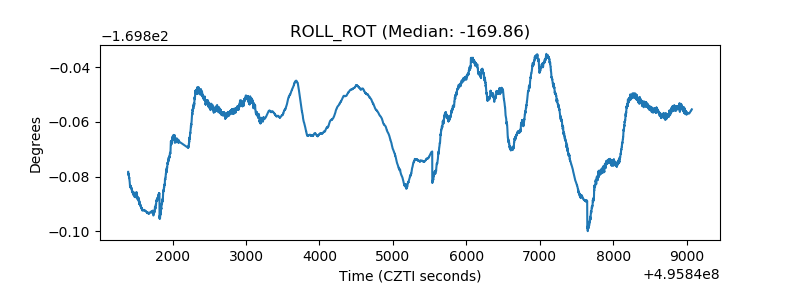 |
| _Roll_DEC | 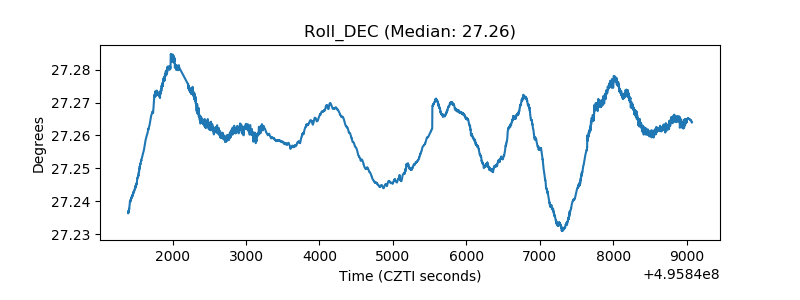 |
| _Roll_RA | 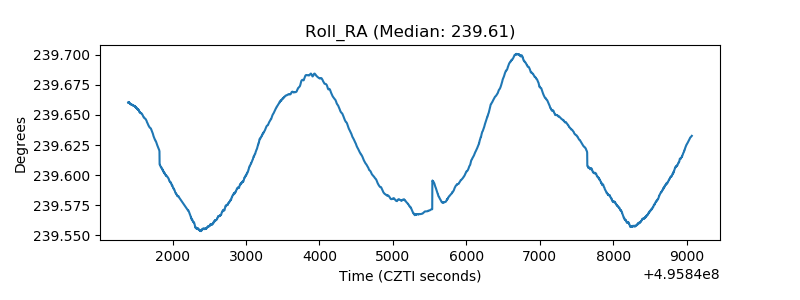 |
| Veto Counter | 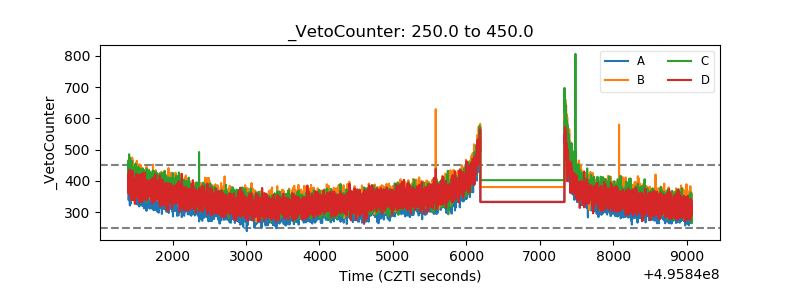 |