| Param | Original file | Final file |
|---|---|---|
| Filename | modeM0/AS1A14_057T04_9000006508_53952cztM0_level2.fits | modeM0/AS1A14_057T04_9000006508_53952cztM0_level2_quad_clean.evt |
| Size (bytes) | 713,537,280 | 87,560,640 |
| Size | 680.5 MB | 83.5 MB |
| Events in quadrant A | 3,833,504 | 671,507 |
| Events in quadrant B | 3,876,591 | 711,744 |
| Events in quadrant C | 5,046,521 | 615,932 |
| Events in quadrant D | 13,105,635 | 159,864 |
| Mode M0 | |||
|---|---|---|---|
| Quadrant | BADHDUFLAG | Total packets | Discarded packets |
| A | 0 | 16417 | 2 |
| B | 0 | 16555 | 2 |
| C | 0 | 20020 | 2 |
| D | 0 | 43857 | 2 |
| Mode SS | |||
|---|---|---|---|
| Quadrant | BADHDUFLAG | Total packets | Discarded packets |
| A | 0 | 142 | 0 |
| B | 0 | 142 | 0 |
| C | 0 | 142 | 0 |
| D | 0 | 142 | 0 |
| Mode M9 | |||
|---|---|---|---|
| Quadrant | BADHDUFLAG | Total packets | Discarded packets |
| A | 0 | 11 | 0 |
| B | 0 | 12 | 0 |
| C | 0 | 12 | 0 |
| D | 0 | 12 | 0 |
| Quadrant | Total seconds | Saturated seconds | Saturation percentage |
|---|---|---|---|
| A | 7070 | 140 | 1.980198% |
| B | 7070 | 206 | 2.913720% |
| C | 7069 | 488 | 6.903381% |
| D | 7069 | 5369 | 75.951337% |
Noise dominated data is calculated using 1-second bins in cleaned event files. If a bin has >2000 counts, and if more than 50% of those come from <1% of pixels, then it is considered to be noise-dominated and hence unusable.
| Quadrant | # 1 sec bins | Bins with >0 counts | Bins with >2000 counts | High rate bins dominated by noise | Noise dominated (total time) | Noise dominated (detector-on time) | Marked lightcurve |
|---|---|---|---|---|---|---|---|
| A | 7905 | 7071 | 53 | 53 | 0.67% | 0.75% | 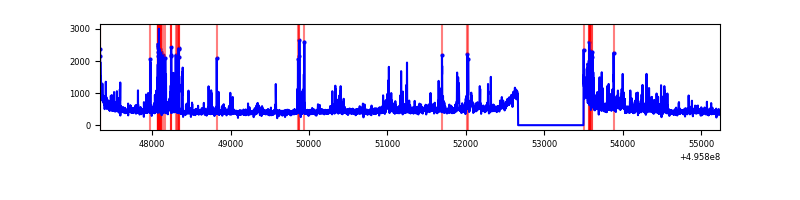 |
| B | 7905 | 7071 | 52 | 52 | 0.66% | 0.74% | 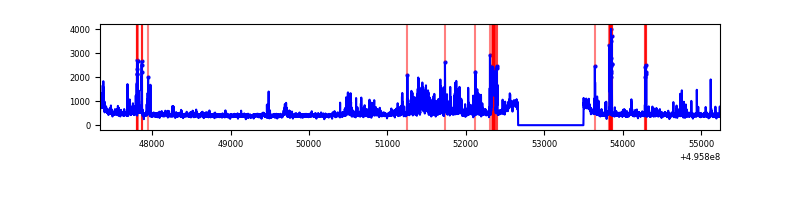 |
| C | 7904 | 7070 | 356 | 356 | 4.50% | 5.04% | 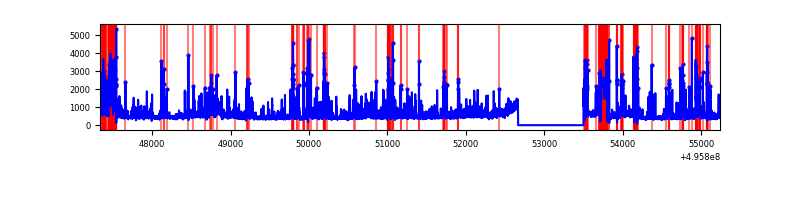 |
| D | 7904 | 7069 | 3296 | 3296 | 41.70% | 46.63% | 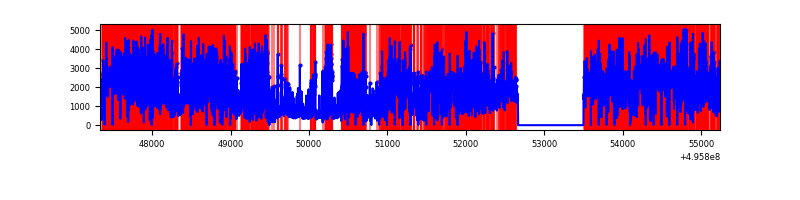 |
Top three noisy pixels from each quadrant. If the there are fewer than three noisy pixels in the level2.evt file, extra rows are filled as -1
| Pixel properties | Quadrant properties | ||||||
|---|---|---|---|---|---|---|---|
| Quadrant | DetID | PixID | Counts | Sigma | Mean | Median | Sigma |
| A | 12 | 115 | 366521 | 1903.52 | 777 | 760 | 192.1 |
| A | 15 | 174 | 143023 | 740.38 | 777 | 760 | 192.1 |
| A | 0 | 8 | 46143 | 236.19 | 777 | 760 | 192.1 |
| B | 0 | 213 | 304389 | 1817.28 | 770 | 743 | 167.1 |
| B | 0 | 155 | 291239 | 1738.57 | 770 | 743 | 167.1 |
| B | 10 | 245 | 93550 | 555.44 | 770 | 743 | 167.1 |
| C | 9 | 38 | 666274 | 3291.5 | 734 | 729 | 202.2 |
| C | 13 | 3 | 612635 | 3026.22 | 734 | 729 | 202.2 |
| C | 1 | 241 | 284904 | 1405.41 | 734 | 729 | 202.2 |
| D | 8 | 176 | 10594653 | 115421.16 | 314 | 300 | 91.8 |
| D | 2 | 172 | 311476 | 3390.14 | 314 | 300 | 91.8 |
| D | 5 | 113 | 305138 | 3321.09 | 314 | 300 | 91.8 |
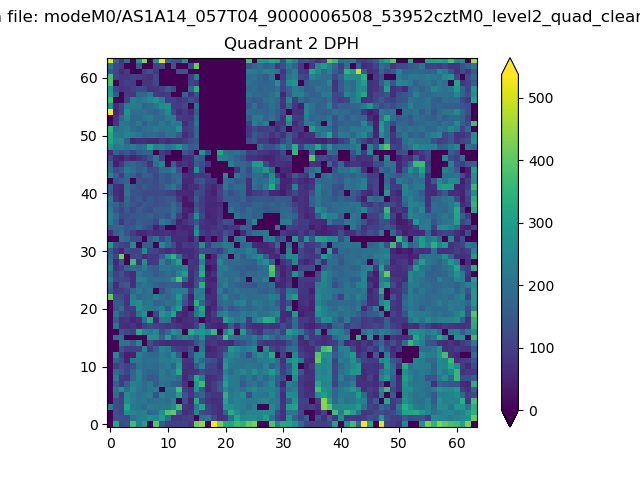
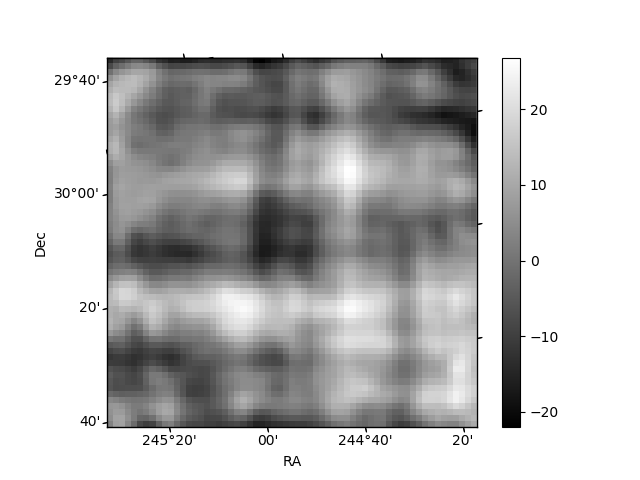
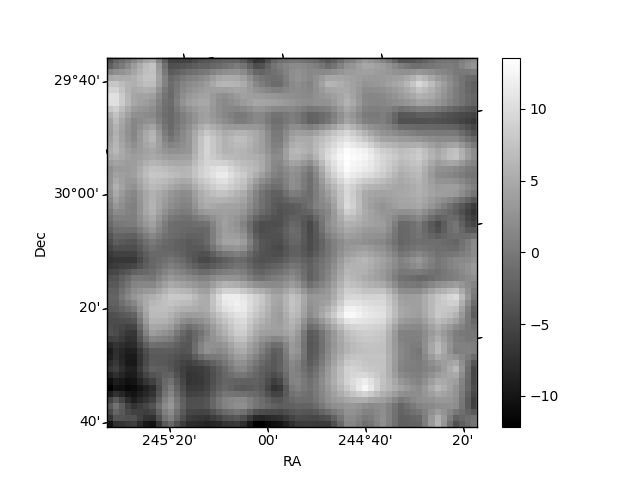
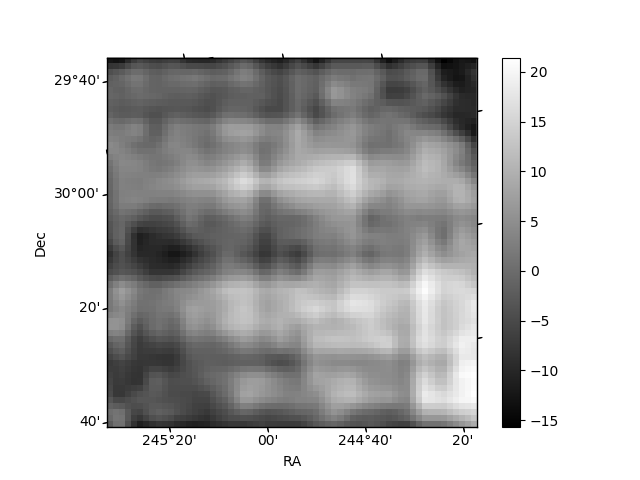
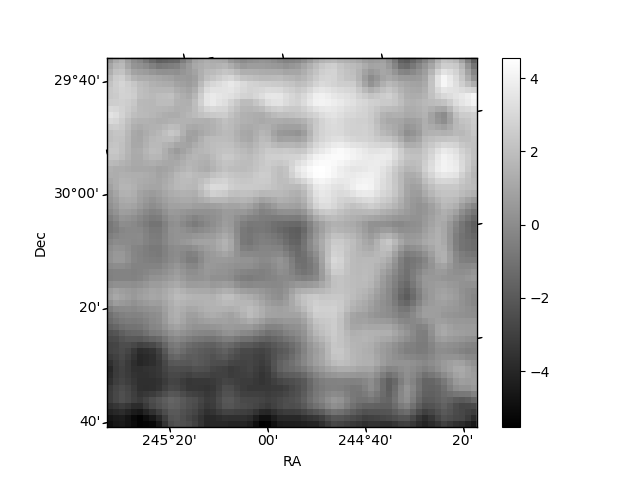
Histogram calculated using DETX and DETY for each event in the final _common_clean file
| Quadrant A | 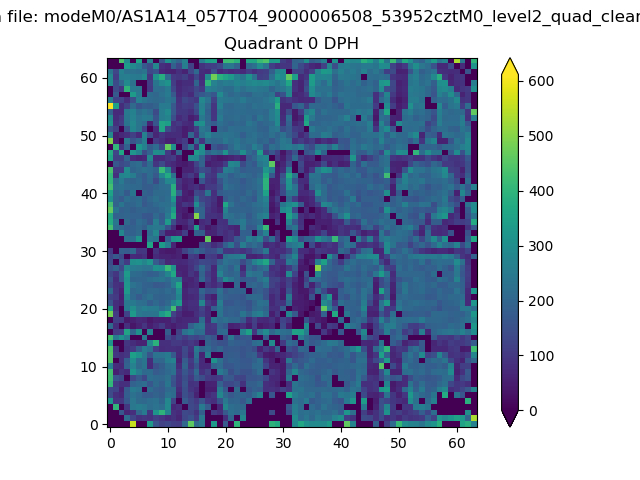 |
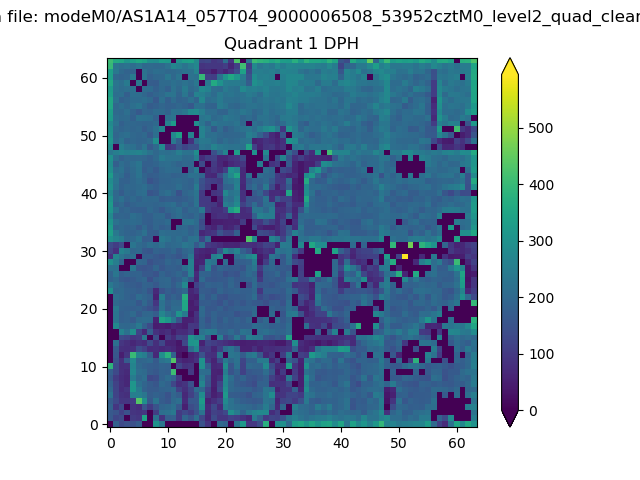 |
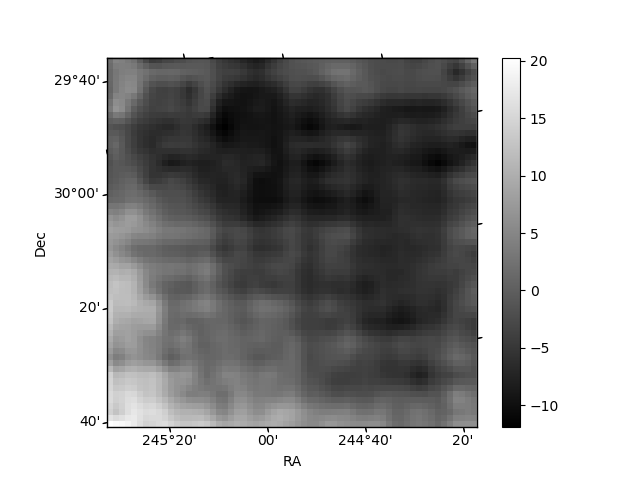
Quadrant B |
|---|---|---|---|
| Quadrant D | 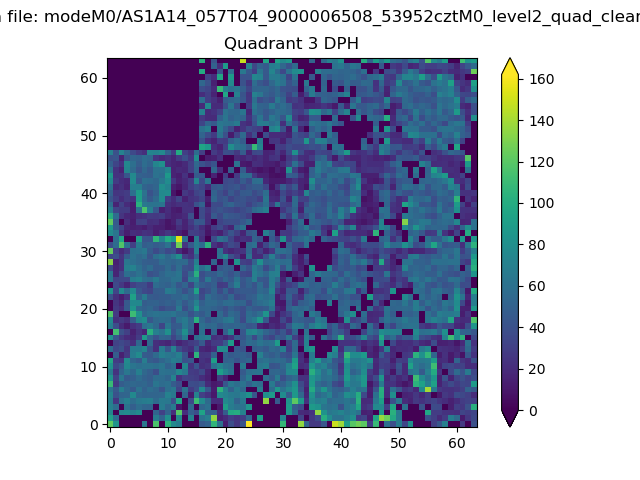 |
 |
Quadrant C |
| Plot type | Count rate plots | Images |
|---|---|---|
| Comparison with Poisson distribution Blue bars denote a histogram of data divided into 1 sec bins. Red curve is a Poisson curve with rate = median count rate of data. |
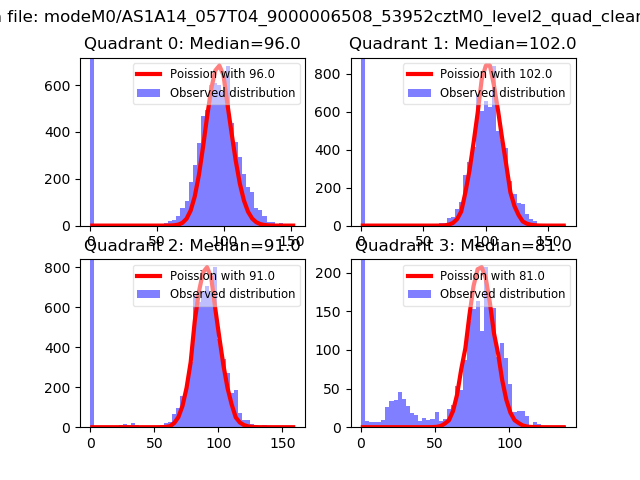 |
 |
| Quadrant-wise count rates Data is divided into 100 sec bins |
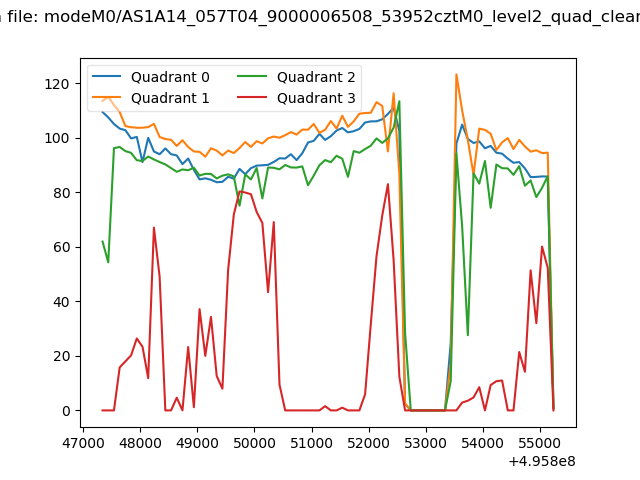 |
|
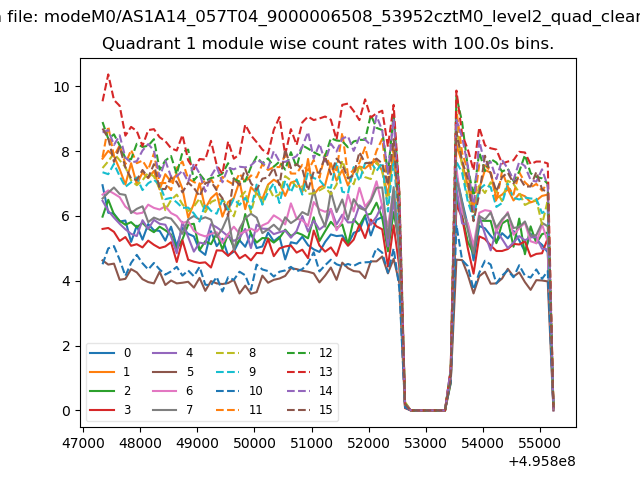
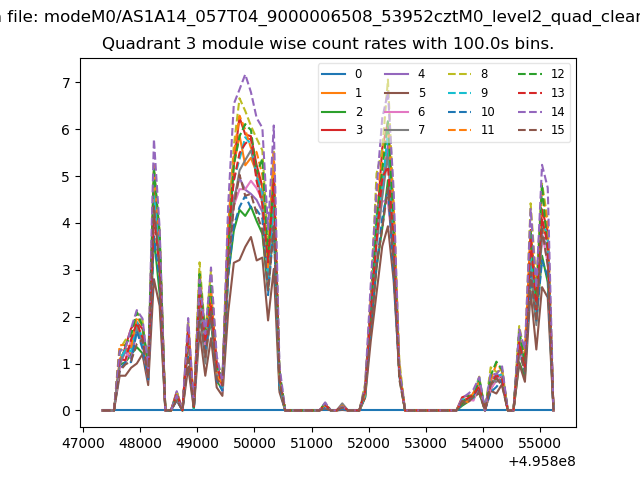
| Module-wise count rates for Quadrant A Data is divided into 100 sec bins |
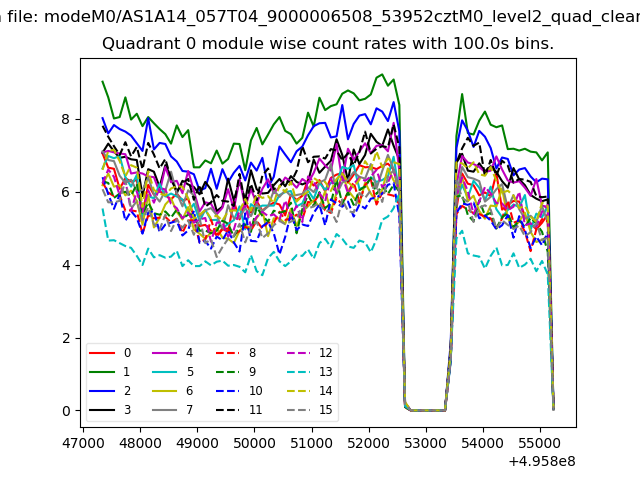 |
 |
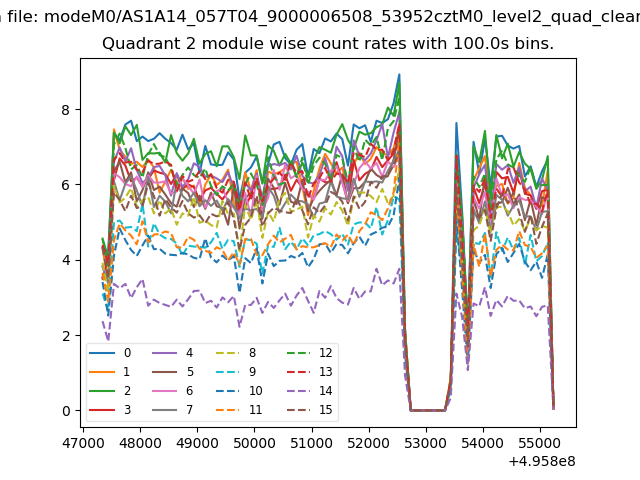
| Module-wise count rates for Quadrant B Data is divided into 100 sec bins |
 |
 |
| Module-wise count rates for Quadrant C Data is divided into 100 sec bins |
 |
 |
| Module-wise count rates for Quadrant D Data is divided into 100 sec bins |
 |
 |
| Parameter | Plot |
|---|---|
| CZT HV Monitor | 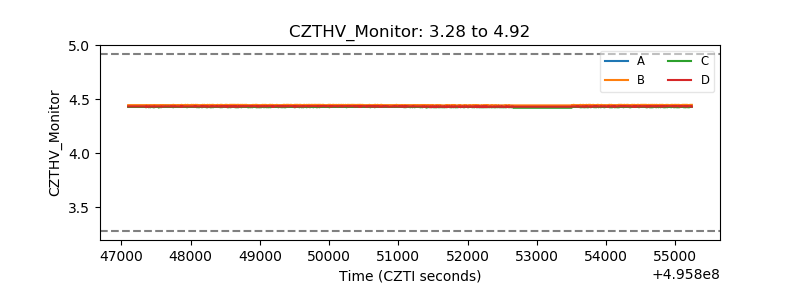 |
| D_VDD | 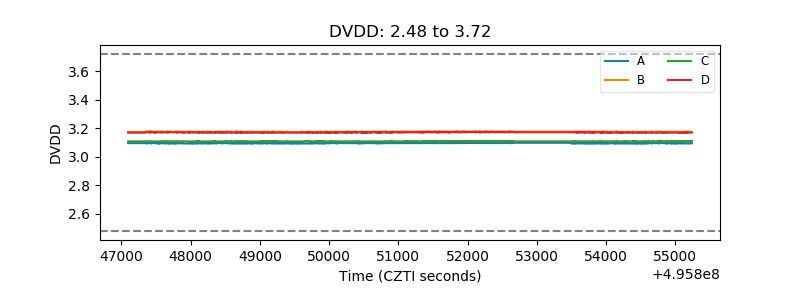 |
| Temperature 1 | 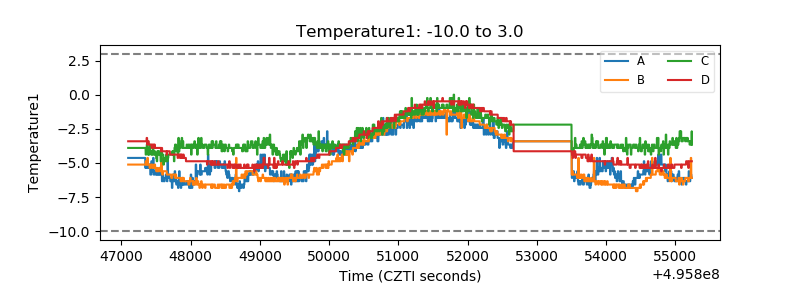 |
| Veto HV Monitor | 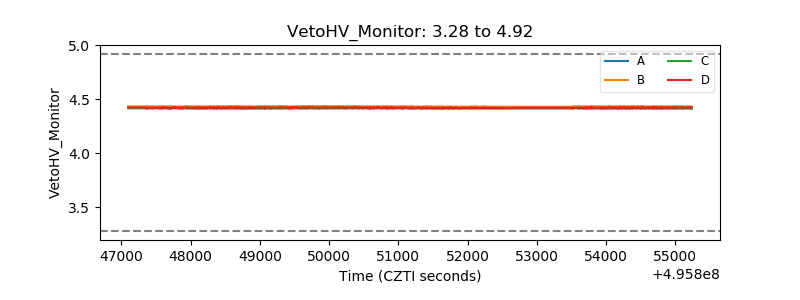 |
| Veto LLD | 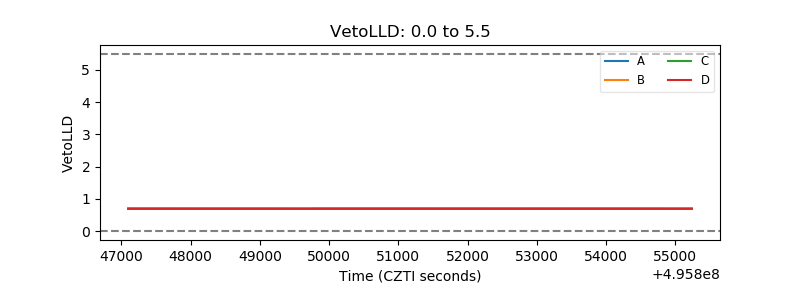 |
| Alpha Counter | 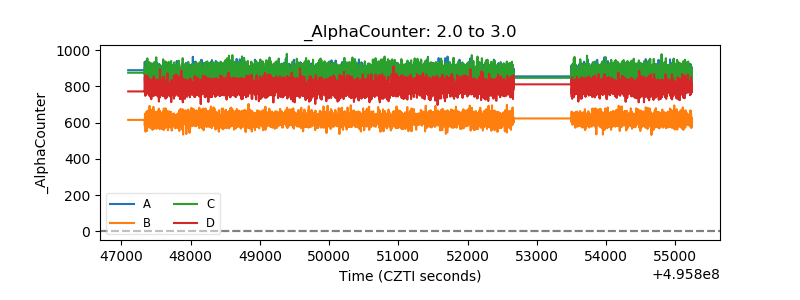 |
| _CPM_Rate | 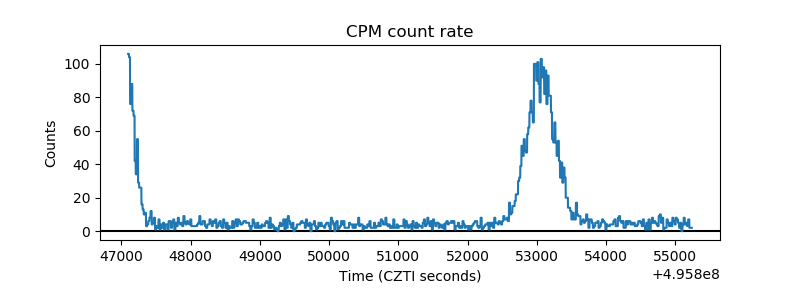 |
| CZT Counter | 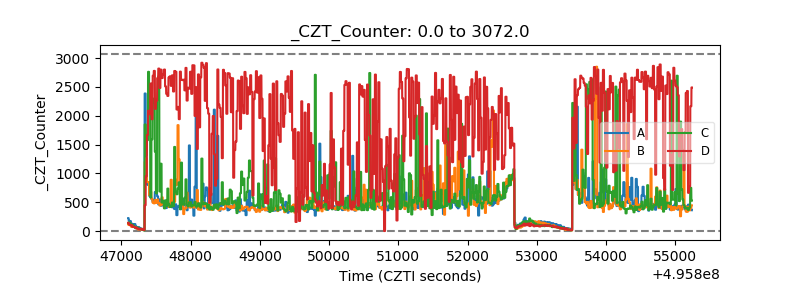 |
| +2.5 Volts monitor | 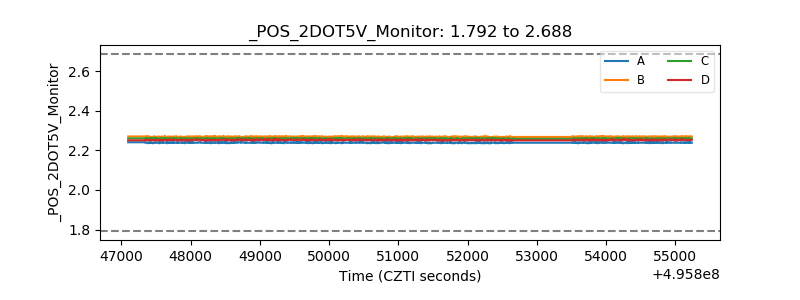 |
| +5 Volts monitor |  |
| _ROLL_ROT | 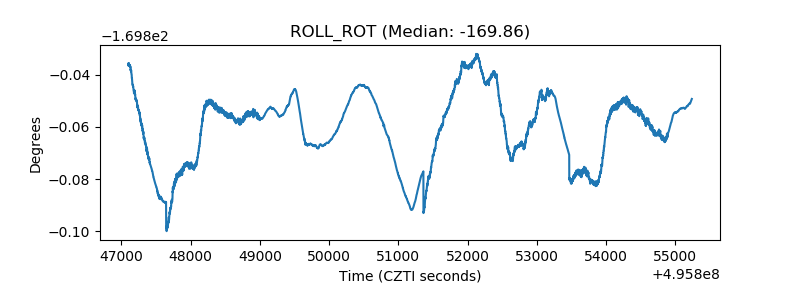 |
| _Roll_DEC | 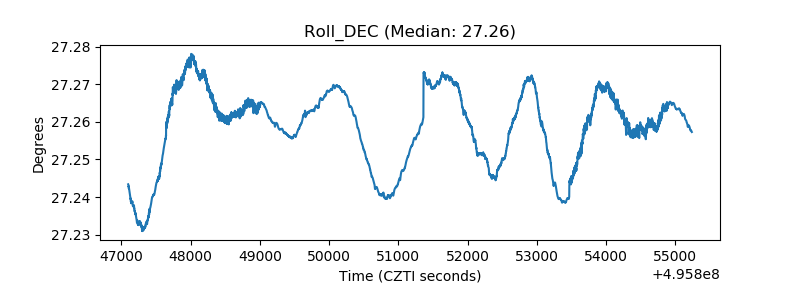 |
| _Roll_RA | 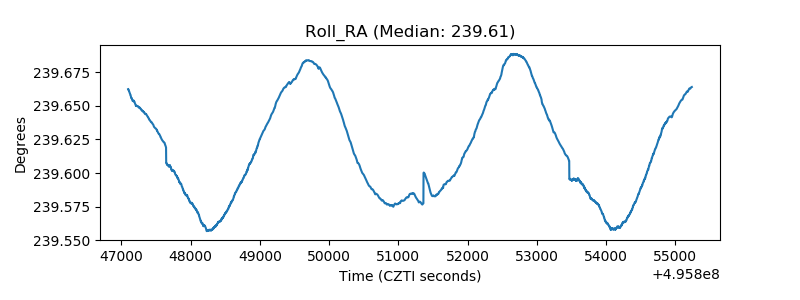 |
| Veto Counter | 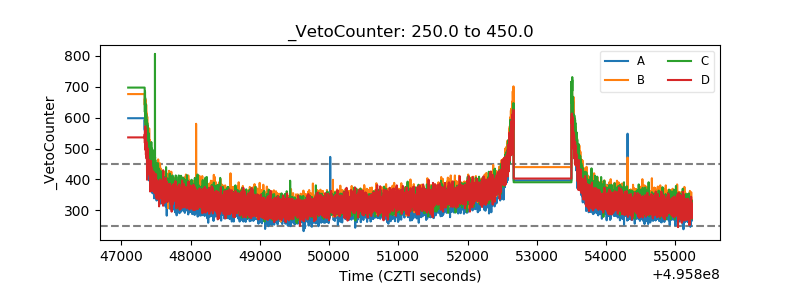 |