| Param | Original file | Final file |
|---|---|---|
| Filename | modeM0/AS1A14_057T04_9000006508_53955cztM0_level2.fits | modeM0/AS1A14_057T04_9000006508_53955cztM0_level2_quad_clean.evt |
| Size (bytes) | 837,403,200 | 102,960,000 |
| Size | 798.6 MB | 98.2 MB |
| Events in quadrant A | 4,873,264 | 749,492 |
| Events in quadrant B | 4,398,360 | 804,941 |
| Events in quadrant C | 5,816,440 | 662,660 |
| Events in quadrant D | 15,282,000 | 337,351 |
| Mode M0 | |||
|---|---|---|---|
| Quadrant | BADHDUFLAG | Total packets | Discarded packets |
| A | 0 | 19995 | 0 |
| B | 0 | 18745 | 0 |
| C | 0 | 23157 | 0 |
| D | 0 | 51004 | 0 |
| Mode SS | |||
|---|---|---|---|
| Quadrant | BADHDUFLAG | Total packets | Discarded packets |
| A | 0 | 162 | 0 |
| B | 0 | 162 | 0 |
| C | 0 | 162 | 0 |
| D | 0 | 162 | 0 |
| Quadrant | Total seconds | Saturated seconds | Saturation percentage |
|---|---|---|---|
| A | 8097 | 202 | 2.494751% |
| B | 8097 | 158 | 1.951340% |
| C | 8097 | 807 | 9.966654% |
| D | 8097 | 4516 | 55.773743% |
Noise dominated data is calculated using 1-second bins in cleaned event files. If a bin has >2000 counts, and if more than 50% of those come from <1% of pixels, then it is considered to be noise-dominated and hence unusable.
| Quadrant | # 1 sec bins | Bins with >0 counts | Bins with >2000 counts | High rate bins dominated by noise | Noise dominated (total time) | Noise dominated (detector-on time) | Marked lightcurve |
|---|---|---|---|---|---|---|---|
| A | 8097 | 8097 | 166 | 166 | 2.05% | 2.05% | 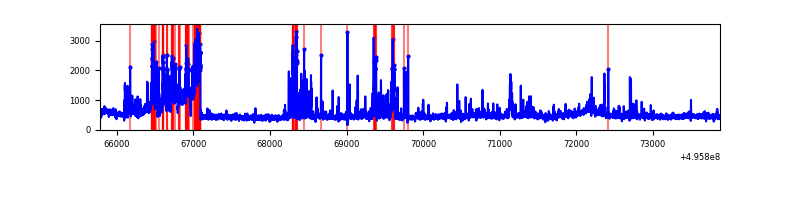 |
| B | 8097 | 8097 | 86 | 86 | 1.06% | 1.06% | 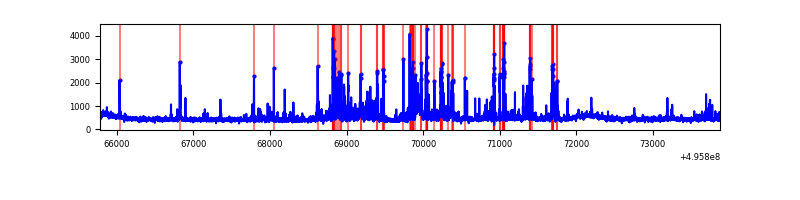 |
| C | 8097 | 8097 | 743 | 743 | 9.18% | 9.18% | 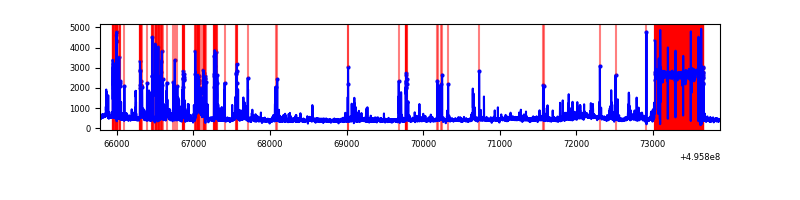 |
| D | 8097 | 8097 | 3869 | 3869 | 47.78% | 47.78% | 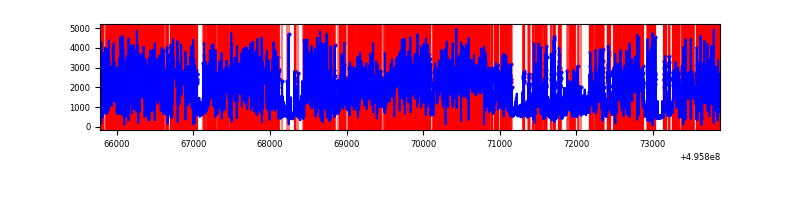 |
Top three noisy pixels from each quadrant. If the there are fewer than three noisy pixels in the level2.evt file, extra rows are filled as -1
| Pixel properties | Quadrant properties | ||||||
|---|---|---|---|---|---|---|---|
| Quadrant | DetID | PixID | Counts | Sigma | Mean | Median | Sigma |
| A | 15 | 174 | 966055 | 4508.21 | 875 | 853 | 214.1 |
| A | 4 | 249 | 107878 | 499.89 | 875 | 853 | 214.1 |
| A | 0 | 8 | 107326 | 497.31 | 875 | 853 | 214.1 |
| B | 0 | 213 | 402669 | 2127.0 | 871 | 841 | 188.9 |
| B | 4 | 171 | 121390 | 638.1 | 871 | 841 | 188.9 |
| B | 4 | 81 | 83251 | 436.22 | 871 | 841 | 188.9 |
| C | 9 | 38 | 1437677 | 6551.78 | 797 | 790 | 219.3 |
| C | 13 | 3 | 456295 | 2076.97 | 797 | 790 | 219.3 |
| C | 12 | 249 | 266476 | 1211.45 | 797 | 790 | 219.3 |
| D | 8 | 176 | 10219265 | 60212.4 | 595 | 569 | 169.7 |
| D | 6 | 239 | 657965 | 3873.62 | 595 | 569 | 169.7 |
| D | 10 | 172 | 584628 | 3441.5 | 595 | 569 | 169.7 |
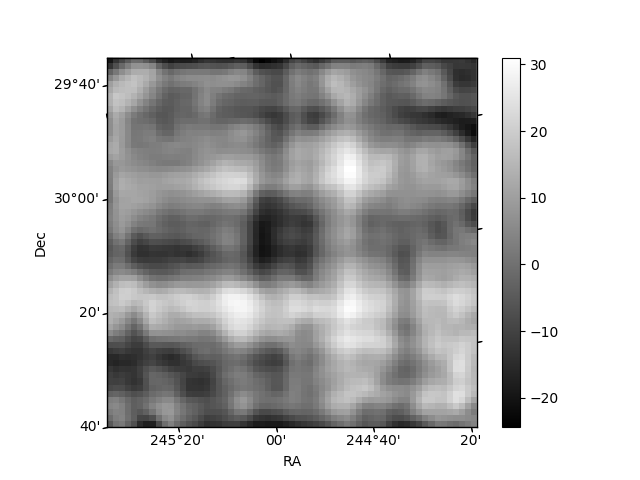
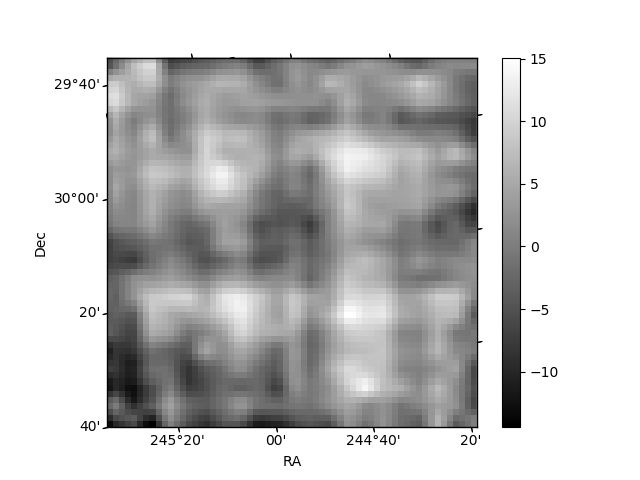
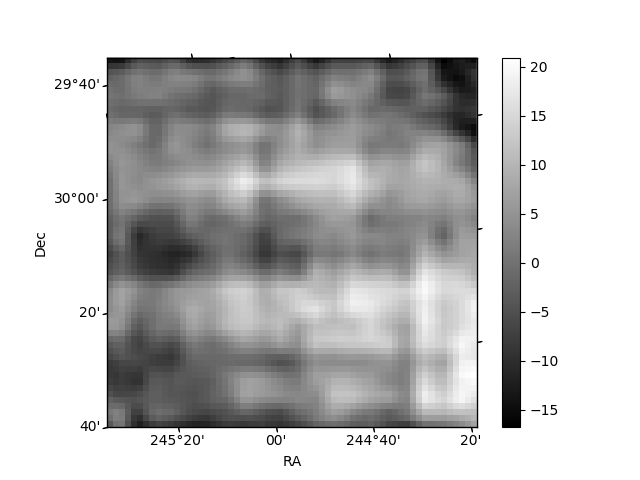
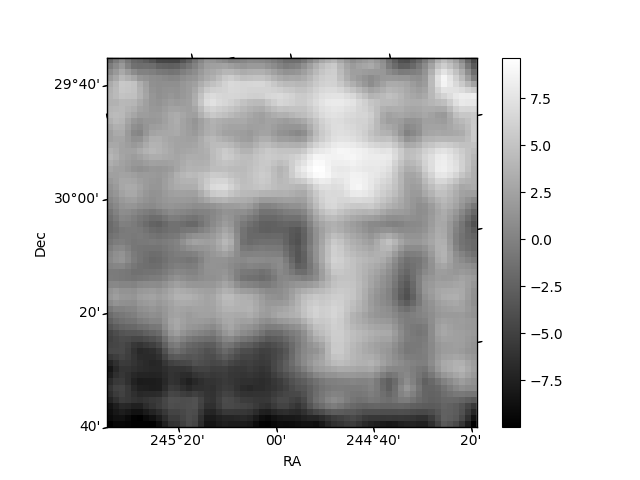
Histogram calculated using DETX and DETY for each event in the final _common_clean file
| Quadrant A | 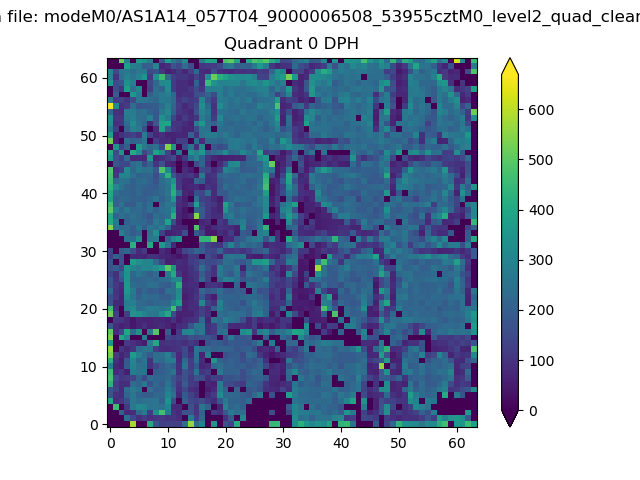 |
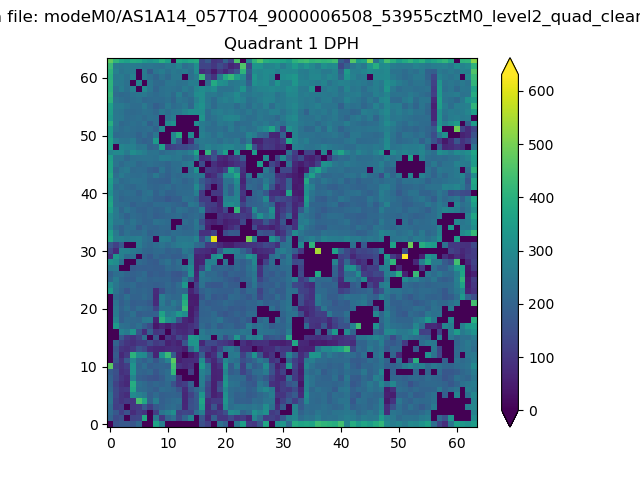 |
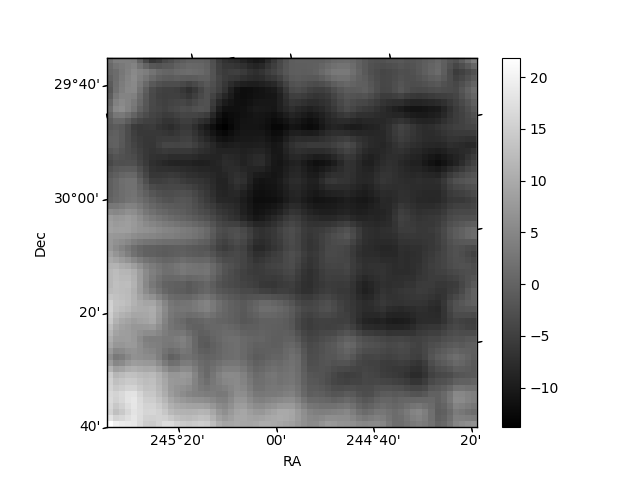
Quadrant B |
|---|---|---|---|
| Quadrant D | 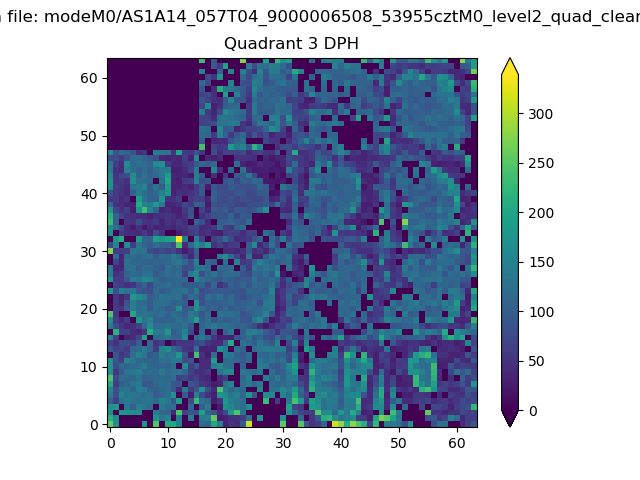 |
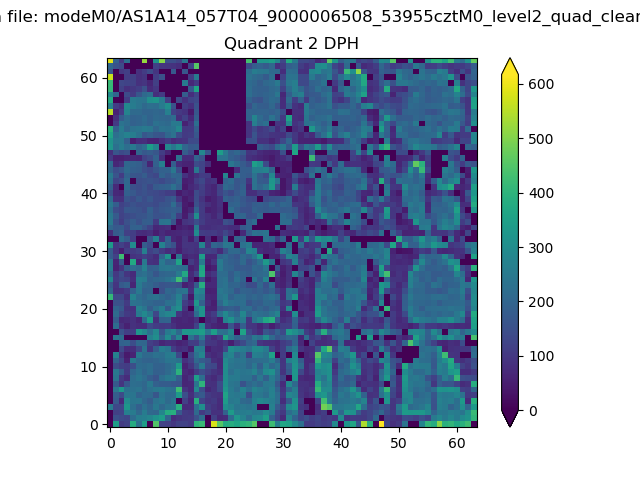 |
Quadrant C |
| Plot type | Count rate plots | Images |
|---|---|---|
| Comparison with Poisson distribution Blue bars denote a histogram of data divided into 1 sec bins. Red curve is a Poisson curve with rate = median count rate of data. |
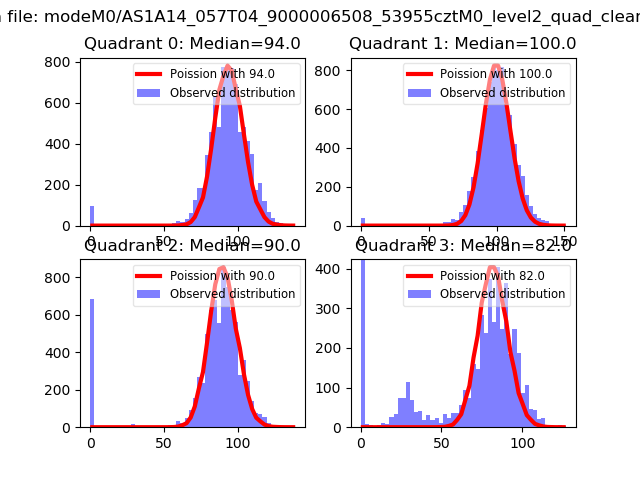 |
 |
| Quadrant-wise count rates Data is divided into 100 sec bins |
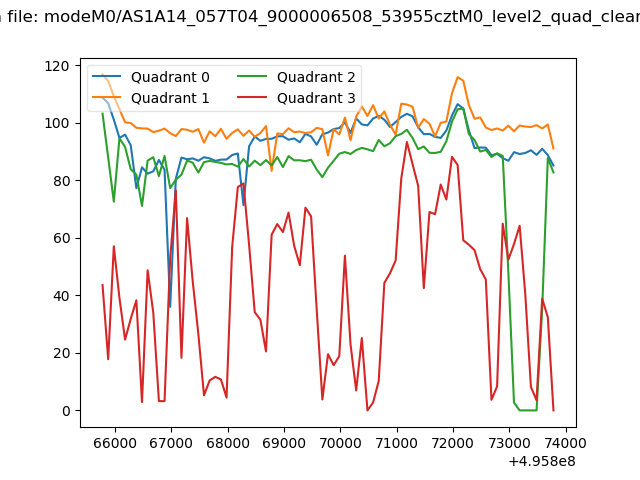 |
|
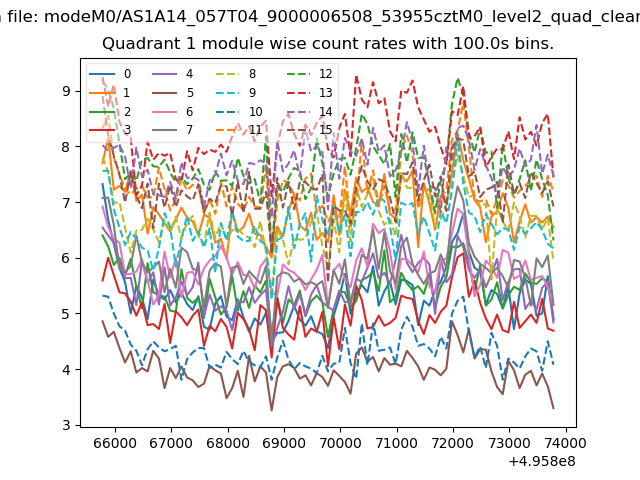
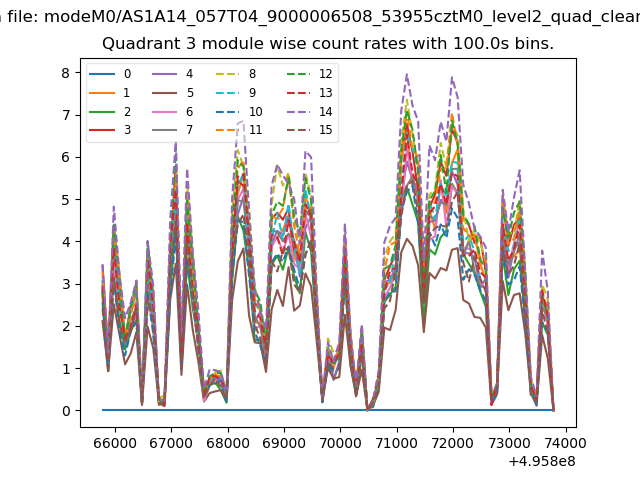
| Module-wise count rates for Quadrant A Data is divided into 100 sec bins |
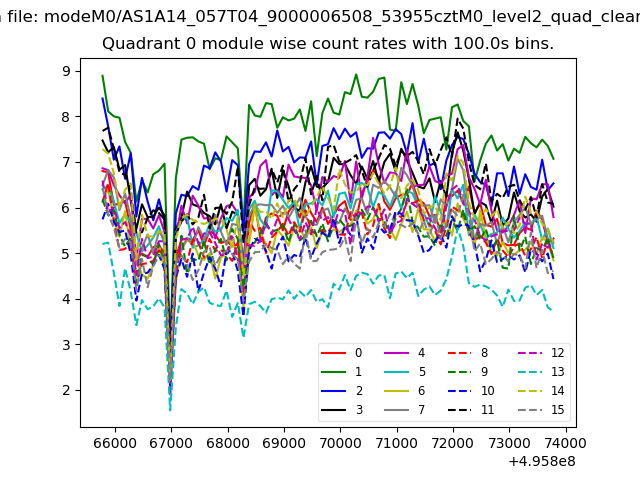 |
 |
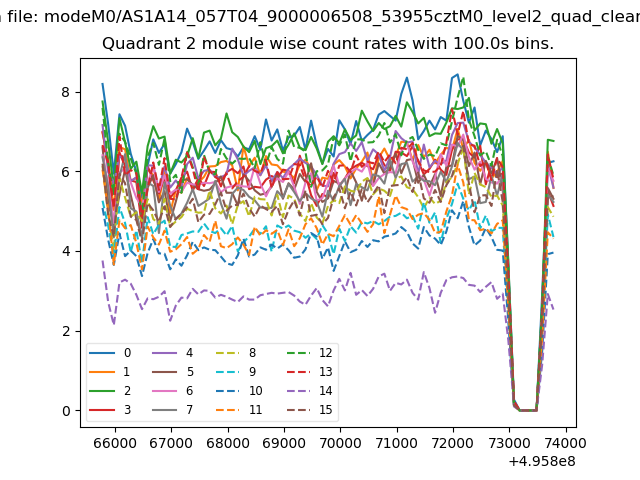
| Module-wise count rates for Quadrant B Data is divided into 100 sec bins |
 |
 |
| Module-wise count rates for Quadrant C Data is divided into 100 sec bins |
 |
 |
| Module-wise count rates for Quadrant D Data is divided into 100 sec bins |
 |
 |
| Parameter | Plot |
|---|---|
| CZT HV Monitor | 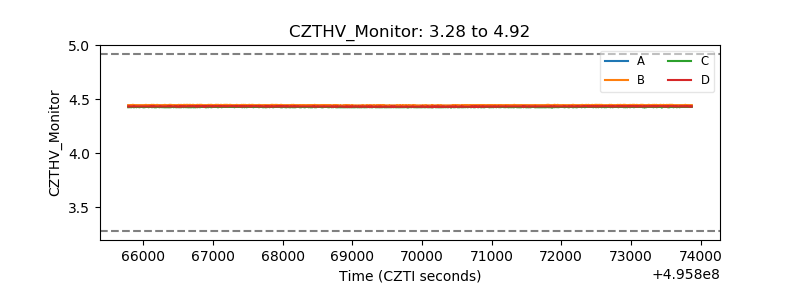 |
| D_VDD | 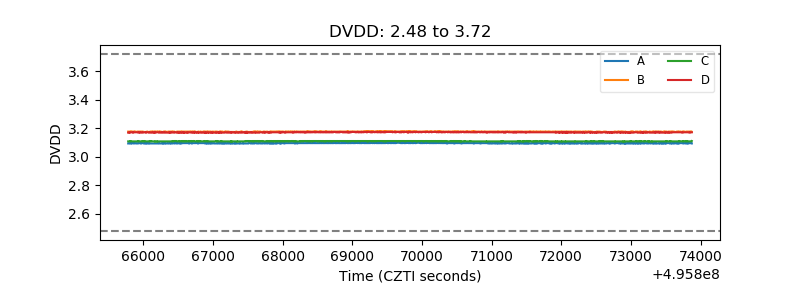 |
| Temperature 1 | 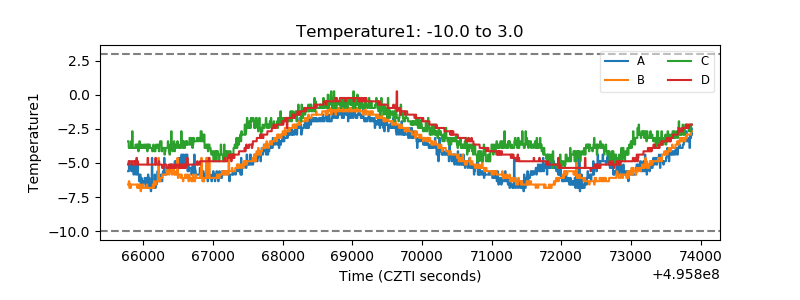 |
| Veto HV Monitor | 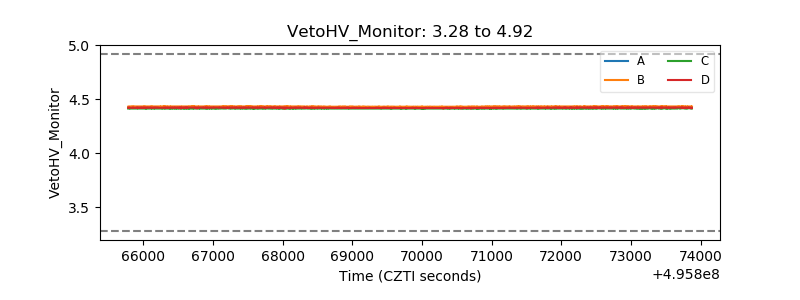 |
| Veto LLD | 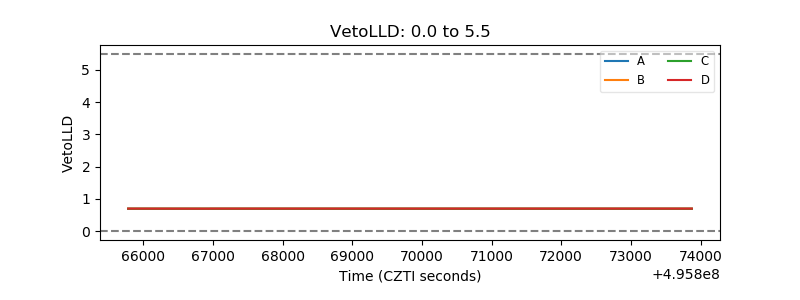 |
| Alpha Counter | 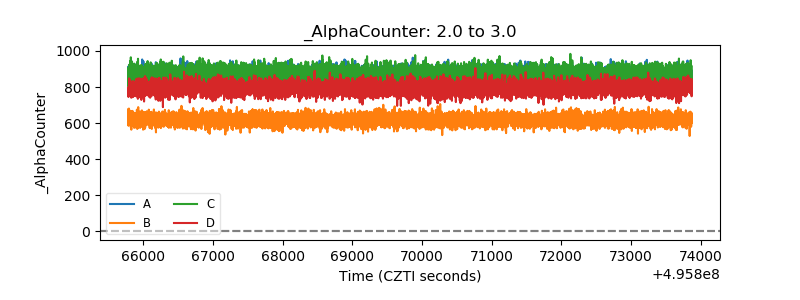 |
| _CPM_Rate | 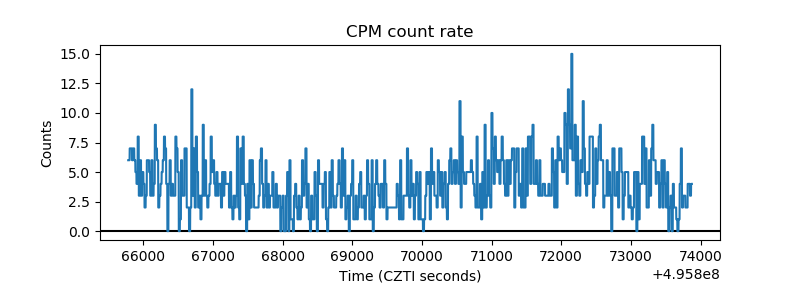 |
| CZT Counter | 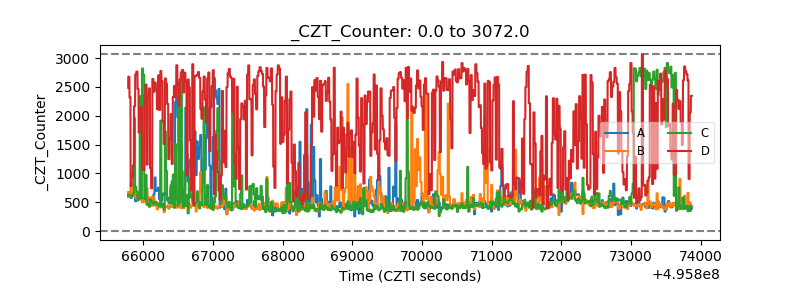 |
| +2.5 Volts monitor | 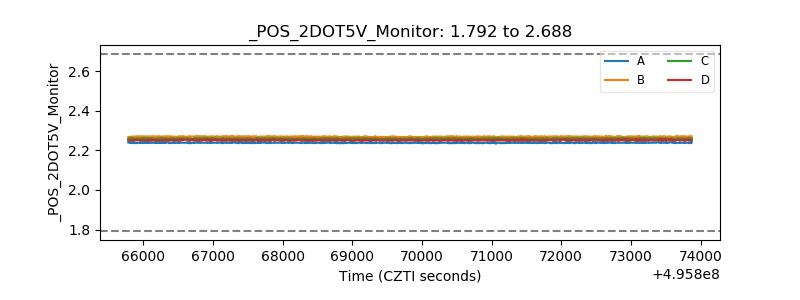 |
| +5 Volts monitor |  |
| _ROLL_ROT | 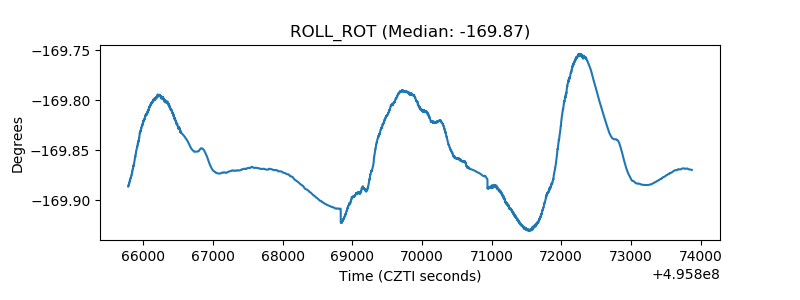 |
| _Roll_DEC | 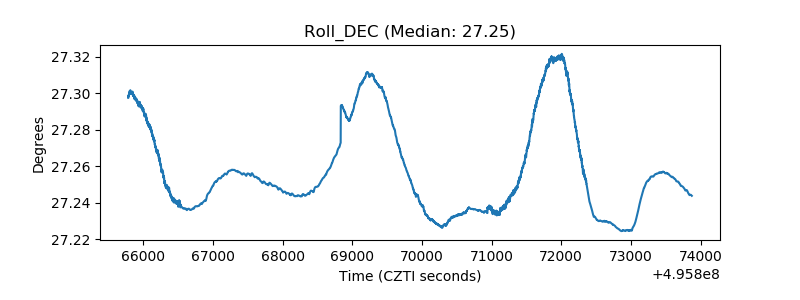 |
| _Roll_RA | 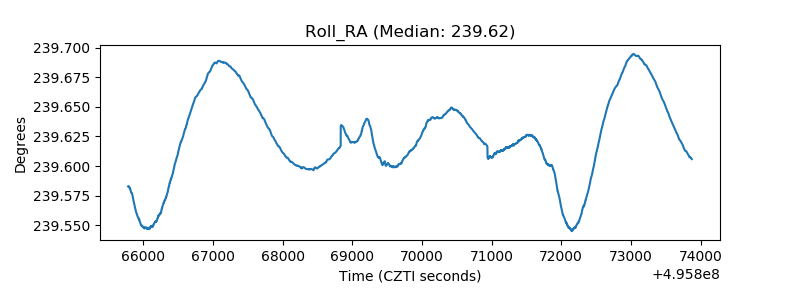 |
| Veto Counter | 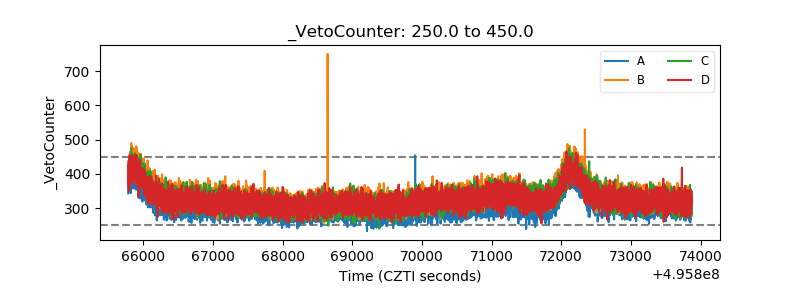 |