| Param | Original file | Final file |
|---|---|---|
| Filename | modeM0/AS1A14_057T04_9000006508_53958cztM0_level2.fits | modeM0/AS1A14_057T04_9000006508_53958cztM0_level2_quad_clean.evt |
| Size (bytes) | 433,575,360 | 55,327,680 |
| Size | 413.5 MB | 52.8 MB |
| Events in quadrant A | 2,977,318 | 388,873 |
| Events in quadrant B | 2,404,132 | 421,718 |
| Events in quadrant C | 2,974,477 | 363,462 |
| Events in quadrant D | 7,359,894 | 199,563 |
| Mode M0 | |||
|---|---|---|---|
| Quadrant | BADHDUFLAG | Total packets | Discarded packets |
| A | 0 | 11843 | 132 |
| B | 0 | 10298 | 122 |
| C | 0 | 12051 | 135 |
| D | 0 | 25375 | 578 |
| Mode SS | |||
|---|---|---|---|
| Quadrant | BADHDUFLAG | Total packets | Discarded packets |
| A | 0 | 87 | 1 |
| B | 0 | 87 | 1 |
| C | 0 | 88 | 2 |
| D | 0 | 87 | 1 |
| Mode M9 | |||
|---|---|---|---|
| Quadrant | BADHDUFLAG | Total packets | Discarded packets |
| A | 1 | 139913130149928 | 139912854634542 |
| B | 1 | -1 | -1 |
| C | 1 | -1 | -1 |
| D | 1 | -1 | -1 |
| Quadrant | Total seconds | Saturated seconds | Saturation percentage |
|---|---|---|---|
| A | 4288 | 291 | 6.786381% |
| B | 4284 | 186 | 4.341737% |
| C | 4288 | 337 | 7.859142% |
| D | 4271 | 2102 | 49.215640% |
Noise dominated data is calculated using 1-second bins in cleaned event files. If a bin has >2000 counts, and if more than 50% of those come from <1% of pixels, then it is considered to be noise-dominated and hence unusable.
| Quadrant | # 1 sec bins | Bins with >0 counts | Bins with >2000 counts | High rate bins dominated by noise | Noise dominated (total time) | Noise dominated (detector-on time) | Marked lightcurve |
|---|---|---|---|---|---|---|---|
| A | 4305 | 4300 | 134 | 134 | 3.11% | 3.12% | 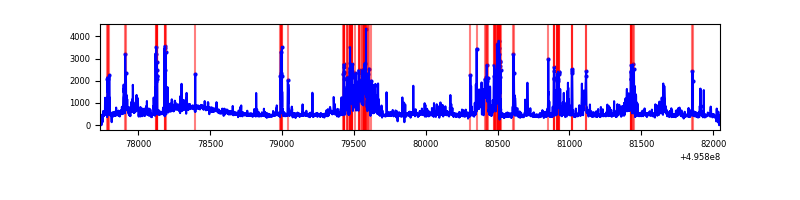 |
| B | 4313 | 4297 | 28 | 28 | 0.65% | 0.65% | 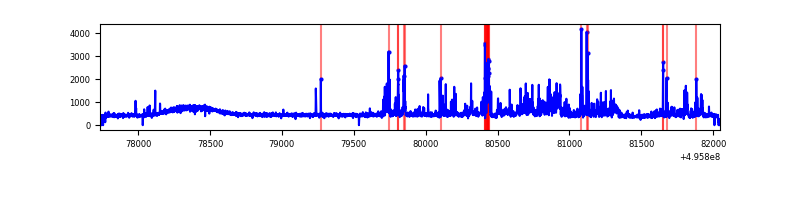 |
| C | 4303 | 4299 | 202 | 202 | 4.69% | 4.70% | 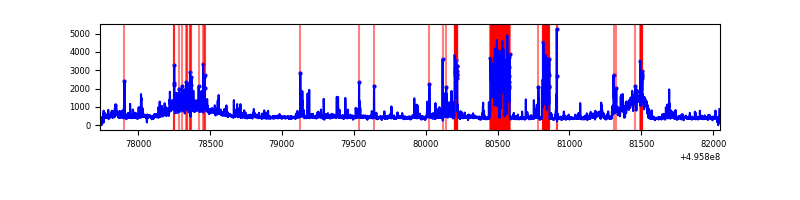 |
| D | 4293 | 4284 | 1663 | 1663 | 38.74% | 38.82% | 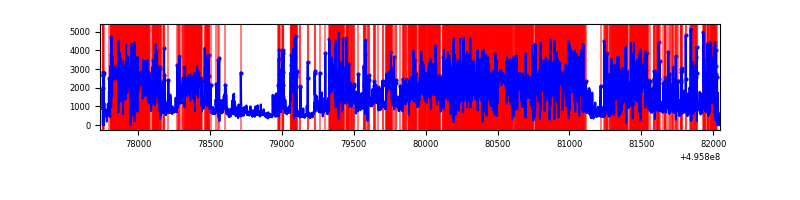 |
Top three noisy pixels from each quadrant. If the there are fewer than three noisy pixels in the level2.evt file, extra rows are filled as -1
| Pixel properties | Quadrant properties | ||||||
|---|---|---|---|---|---|---|---|
| Quadrant | DetID | PixID | Counts | Sigma | Mean | Median | Sigma |
| A | 15 | 174 | 376087 | 3151.82 | 477 | 463 | 119.2 |
| A | 0 | 8 | 326632 | 2736.85 | 477 | 463 | 119.2 |
| A | 8 | 249 | 107918 | 901.64 | 477 | 463 | 119.2 |
| B | 8 | 234 | 118843 | 1158.54 | 471 | 453 | 102.2 |
| B | 0 | 213 | 107921 | 1051.66 | 471 | 453 | 102.2 |
| B | 0 | 155 | 107123 | 1043.85 | 471 | 453 | 102.2 |
| C | 1 | 241 | 555262 | 4486.13 | 448 | 443 | 123.7 |
| C | 13 | 3 | 159497 | 1286.07 | 448 | 443 | 123.7 |
| C | 9 | 38 | 142554 | 1149.08 | 448 | 443 | 123.7 |
| D | 8 | 176 | 4704782 | 49878.81 | 330 | 315 | 94.3 |
| D | 6 | 239 | 706932 | 7491.86 | 330 | 315 | 94.3 |
| D | 3 | 12 | 180670 | 1912.2 | 330 | 315 | 94.3 |
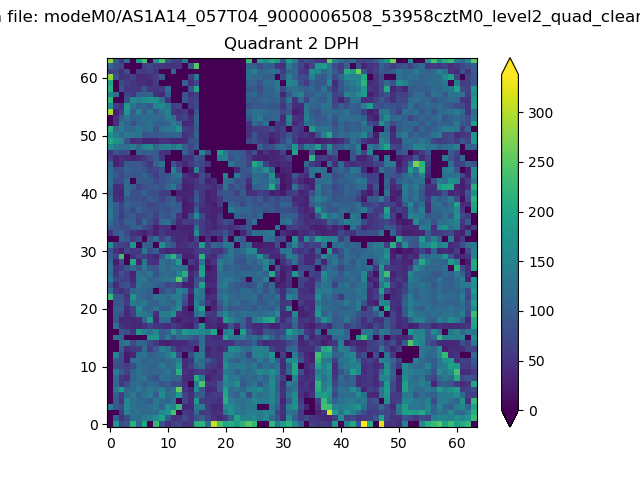
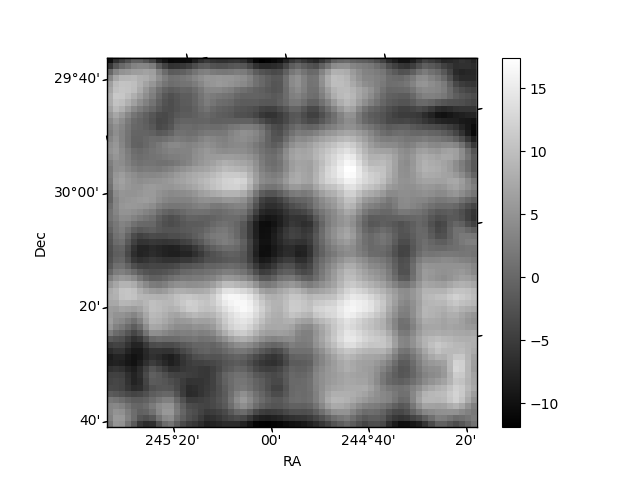
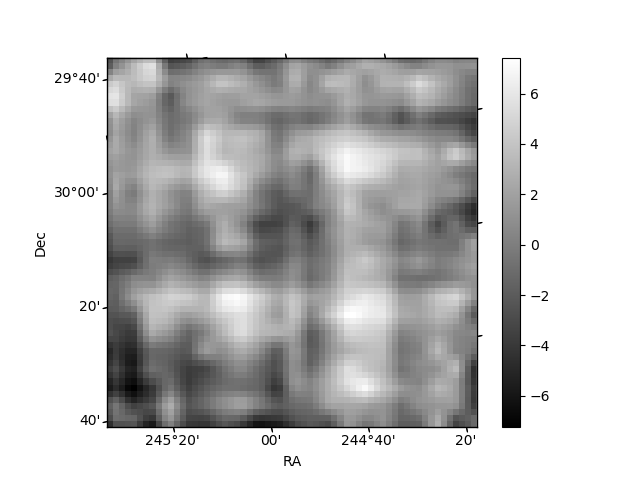
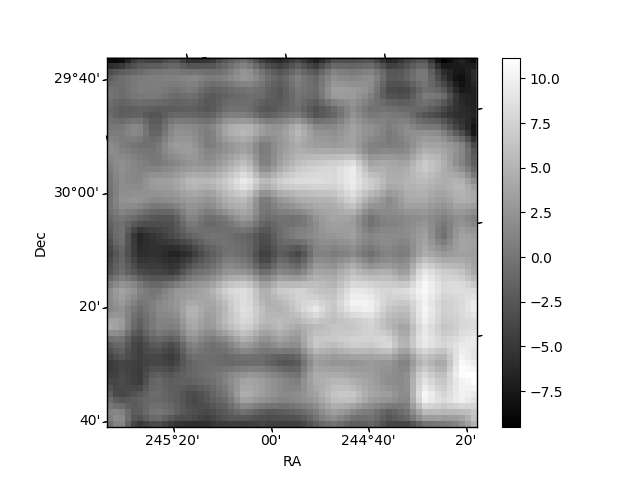
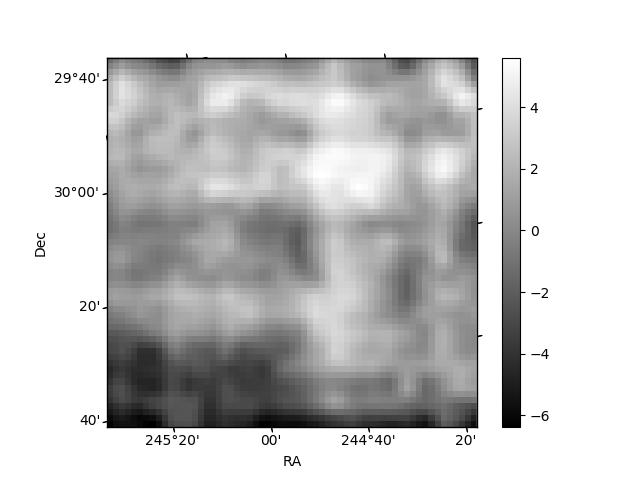
Histogram calculated using DETX and DETY for each event in the final _common_clean file
| Quadrant A | 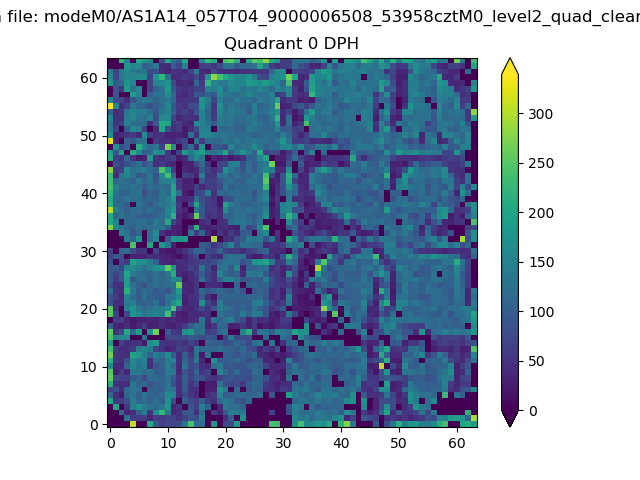 |
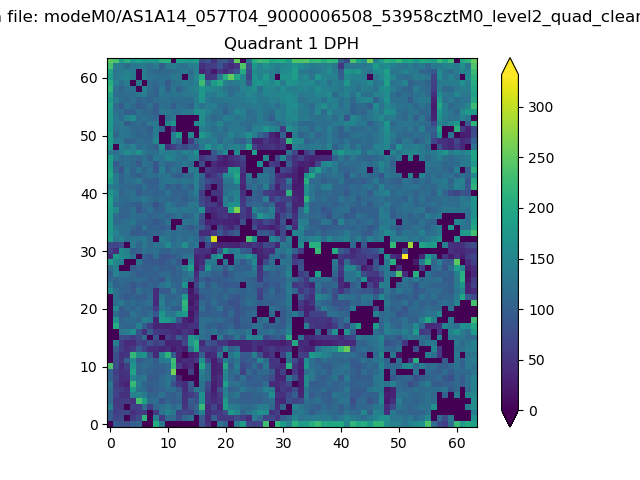 |
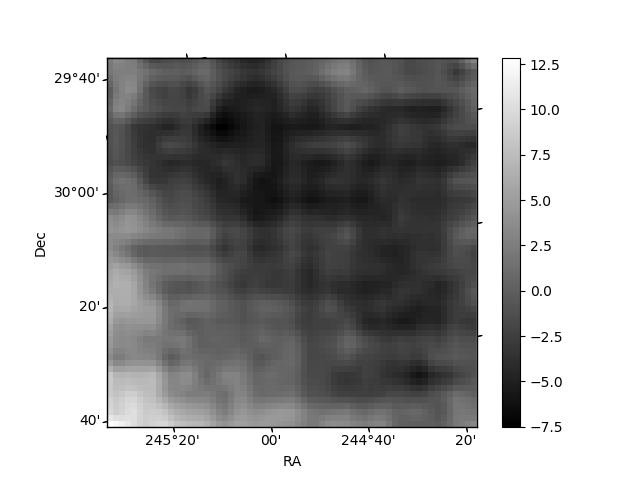
Quadrant B |
|---|---|---|---|
| Quadrant D | 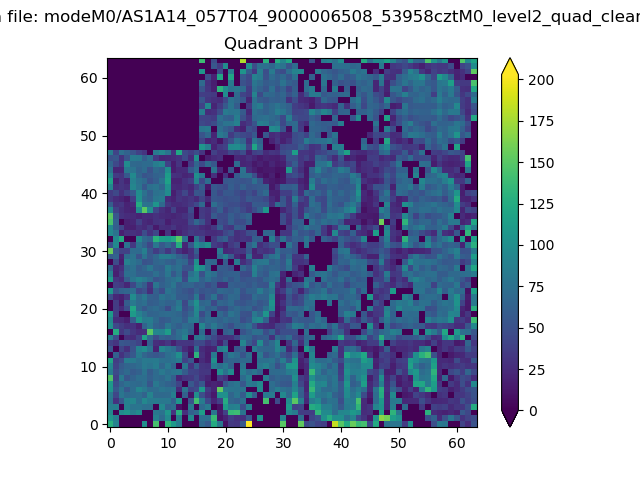 |
 |
Quadrant C |
| Plot type | Count rate plots | Images |
|---|---|---|
| Comparison with Poisson distribution Blue bars denote a histogram of data divided into 1 sec bins. Red curve is a Poisson curve with rate = median count rate of data. |
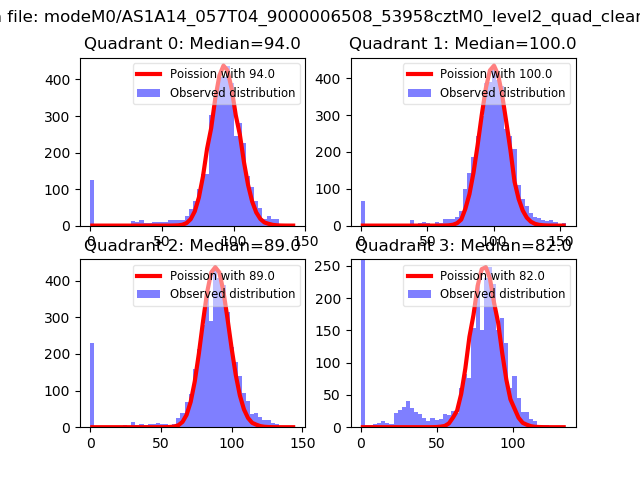 |
 |
| Quadrant-wise count rates Data is divided into 100 sec bins |
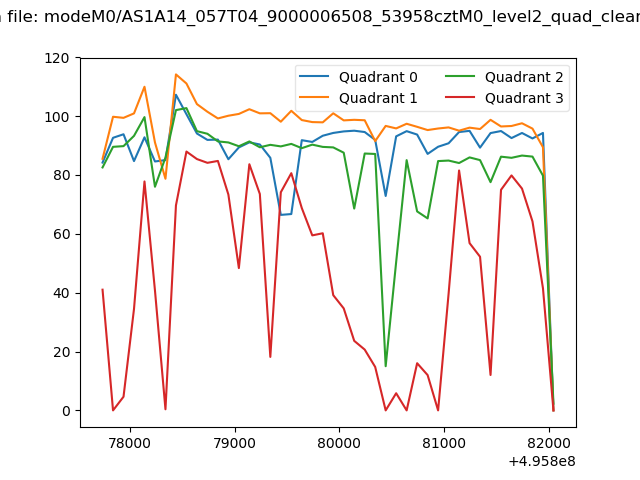 |
|
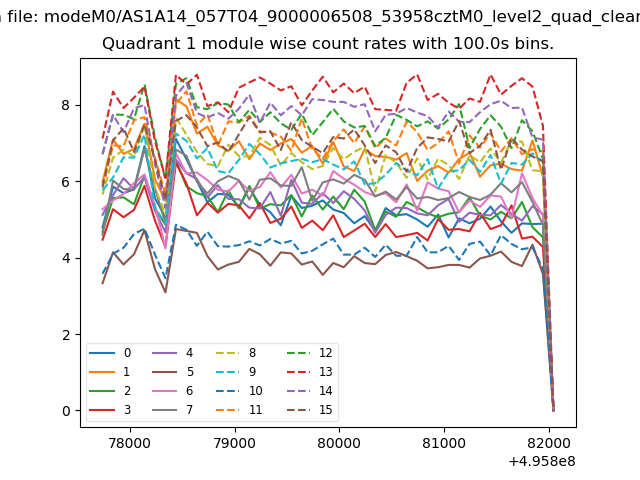
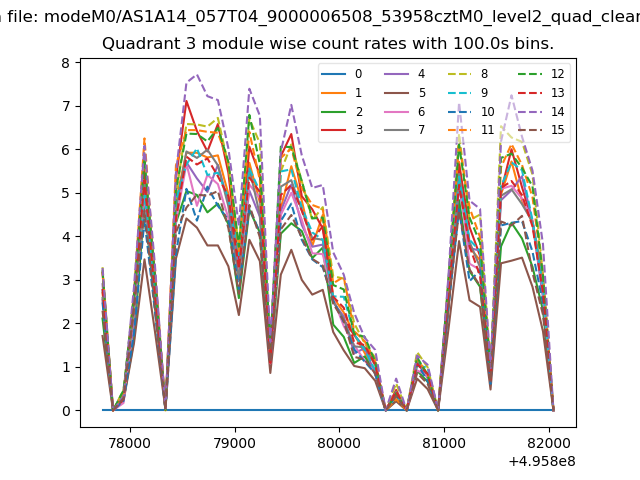
| Module-wise count rates for Quadrant A Data is divided into 100 sec bins |
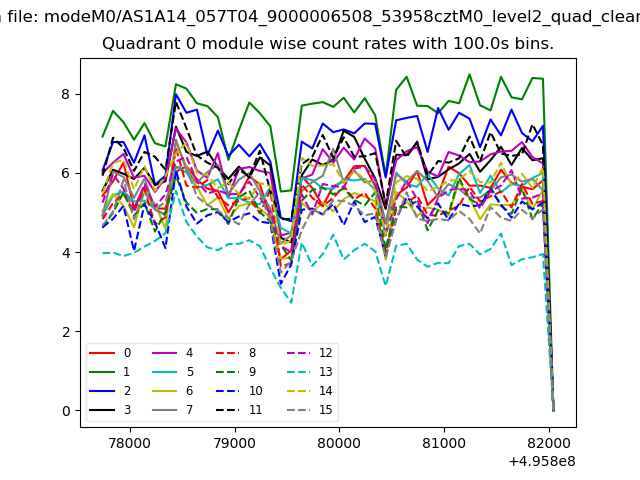 |
 |
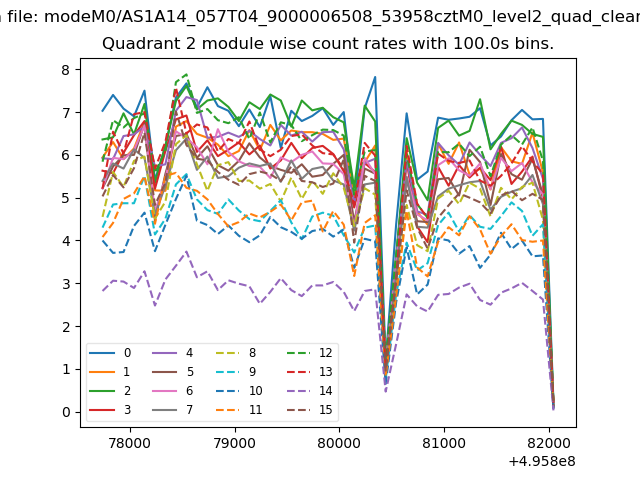
| Module-wise count rates for Quadrant B Data is divided into 100 sec bins |
 |
 |
| Module-wise count rates for Quadrant C Data is divided into 100 sec bins |
 |
 |
| Module-wise count rates for Quadrant D Data is divided into 100 sec bins |
 |
 |
| Parameter | Plot |
|---|---|
| CZT HV Monitor | 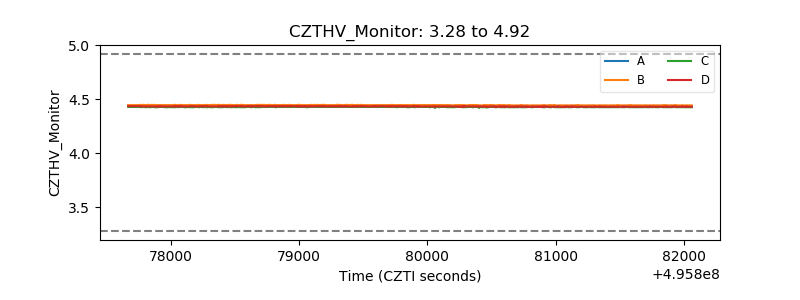 |
| D_VDD | 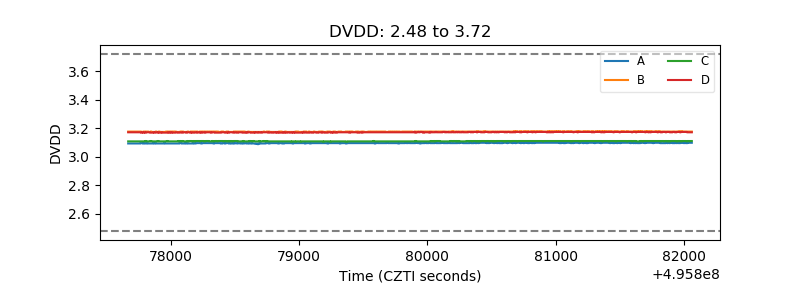 |
| Temperature 1 | 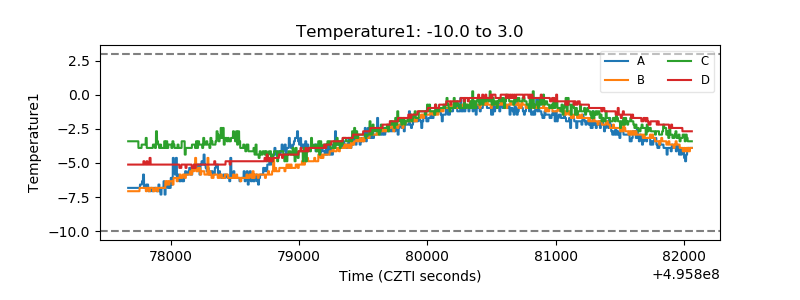 |
| Veto HV Monitor | 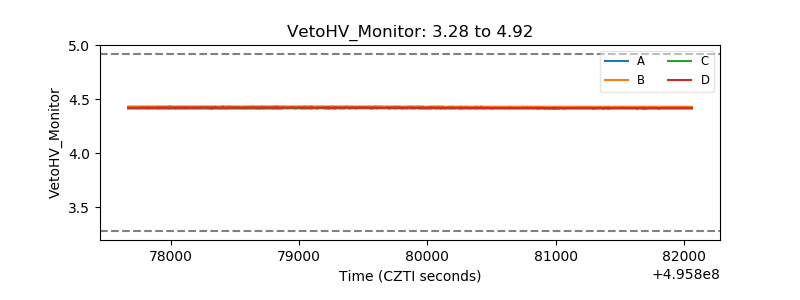 |
| Veto LLD | 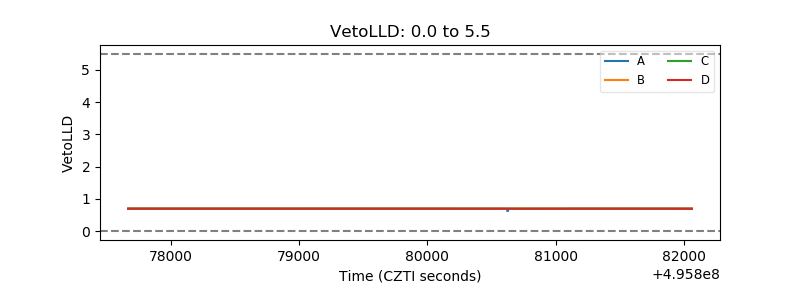 |
| Alpha Counter | 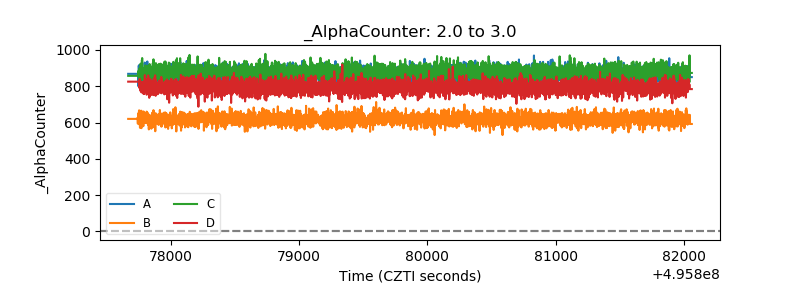 |
| _CPM_Rate | 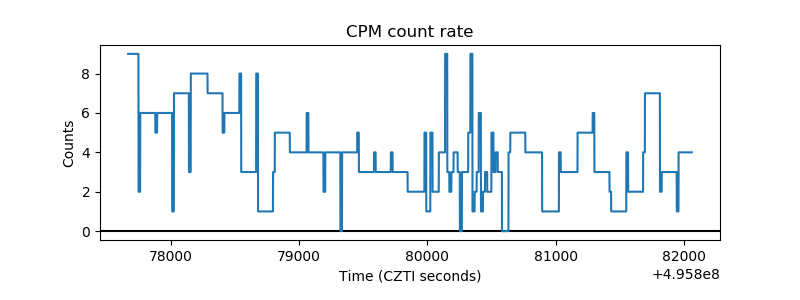 |
| CZT Counter |  |
| +2.5 Volts monitor |  |
| +5 Volts monitor |  |
| _ROLL_ROT | 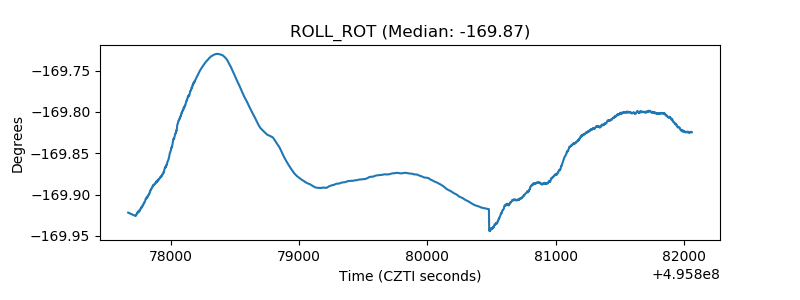 |
| _Roll_DEC | 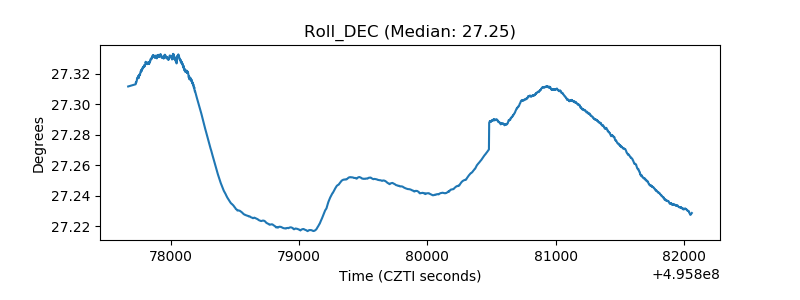 |
| _Roll_RA | 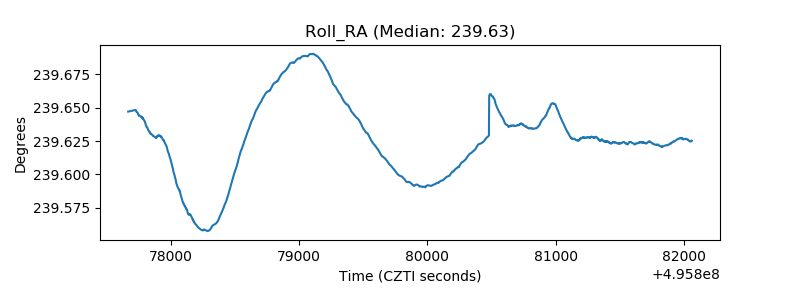 |
| Veto Counter | 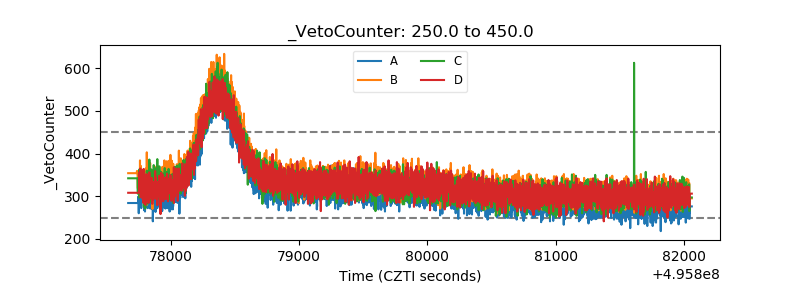 |