| Param | Original file | Final file |
|---|---|---|
| Filename | modeM0/AS1A14_057T04_9000006508_53959cztM0_level2.fits | modeM0/AS1A14_057T04_9000006508_53959cztM0_level2_quad_clean.evt |
| Size (bytes) | 1,779,943,680 | 195,739,200 |
| Size | 1.7 GB | 186.7 MB |
| Events in quadrant A | 9,405,733 | 1,467,730 |
| Events in quadrant B | 9,742,397 | 1,556,414 |
| Events in quadrant C | 16,988,620 | 1,124,256 |
| Events in quadrant D | 28,521,994 | 678,920 |
| Mode M0 | |||
|---|---|---|---|
| Quadrant | BADHDUFLAG | Total packets | Discarded packets |
| A | 0 | 38700 | 3 |
| B | 0 | 39875 | 4 |
| C | 0 | 61469 | 53 |
| D | 0 | 95737 | 36 |
| Mode SS | |||
|---|---|---|---|
| Quadrant | BADHDUFLAG | Total packets | Discarded packets |
| A | 0 | 324 | 0 |
| B | 0 | 324 | 0 |
| C | 0 | 324 | 0 |
| D | 0 | 324 | 0 |
| Mode M9 | |||
|---|---|---|---|
| Quadrant | BADHDUFLAG | Total packets | Discarded packets |
| A | 0 | 17 | 0 |
| B | 0 | 17 | 0 |
| C | 0 | 17 | 0 |
| D | 0 | 17 | 0 |
| Quadrant | Total seconds | Saturated seconds | Saturation percentage |
|---|---|---|---|
| A | 15922 | 630 | 3.956789% |
| B | 15922 | 631 | 3.963070% |
| C | 15913 | 3173 | 19.939672% |
| D | 15916 | 8505 | 53.436793% |
Noise dominated data is calculated using 1-second bins in cleaned event files. If a bin has >2000 counts, and if more than 50% of those come from <1% of pixels, then it is considered to be noise-dominated and hence unusable.
| Quadrant | # 1 sec bins | Bins with >0 counts | Bins with >2000 counts | High rate bins dominated by noise | Noise dominated (total time) | Noise dominated (detector-on time) | Marked lightcurve |
|---|---|---|---|---|---|---|---|
| A | 17577 | 15926 | 324 | 324 | 1.84% | 2.03% | 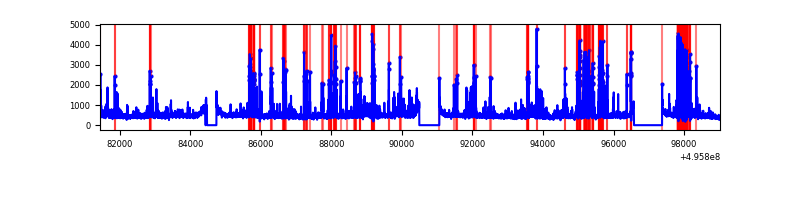 |
| B | 17578 | 15927 | 223 | 223 | 1.27% | 1.40% | 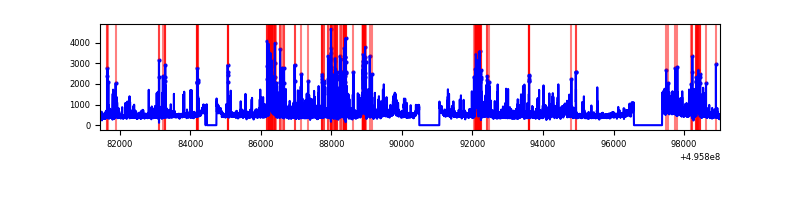 |
| C | 17578 | 15924 | 2768 | 2768 | 15.75% | 17.38% | 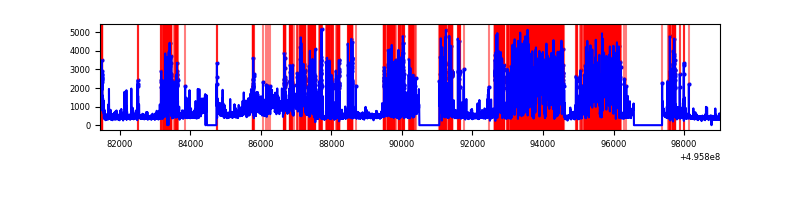 |
| D | 17577 | 15925 | 6681 | 6681 | 38.01% | 41.95% | 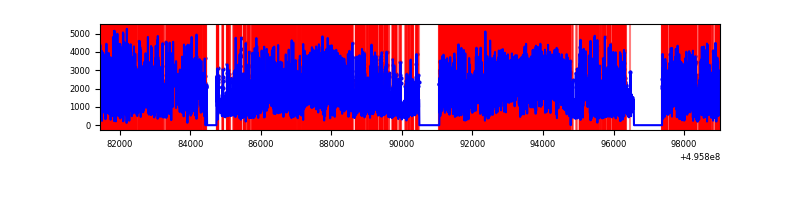 |
Top three noisy pixels from each quadrant. If the there are fewer than three noisy pixels in the level2.evt file, extra rows are filled as -1
| Pixel properties | Quadrant properties | ||||||
|---|---|---|---|---|---|---|---|
| Quadrant | DetID | PixID | Counts | Sigma | Mean | Median | Sigma |
| A | 0 | 8 | 891711 | 2107.91 | 1728 | 1687 | 422.2 |
| A | 15 | 174 | 680462 | 1607.59 | 1728 | 1687 | 422.2 |
| A | 13 | 248 | 400183 | 943.79 | 1728 | 1687 | 422.2 |
| B | 0 | 213 | 873866 | 2401.69 | 1705 | 1646 | 363.2 |
| B | 5 | 250 | 495805 | 1360.68 | 1705 | 1646 | 363.2 |
| B | 0 | 155 | 448338 | 1229.98 | 1705 | 1646 | 363.2 |
| C | 1 | 241 | 6959553 | 16381.95 | 1529 | 1509 | 424.7 |
| C | 9 | 38 | 1795512 | 4223.78 | 1529 | 1509 | 424.7 |
| C | 13 | 3 | 680133 | 1597.75 | 1529 | 1509 | 424.7 |
| D | 8 | 176 | 14120040 | 40813.38 | 1193 | 1137 | 345.9 |
| D | 2 | 165 | 2557815 | 7390.56 | 1193 | 1137 | 345.9 |
| D | 3 | 12 | 2412740 | 6971.2 | 1193 | 1137 | 345.9 |
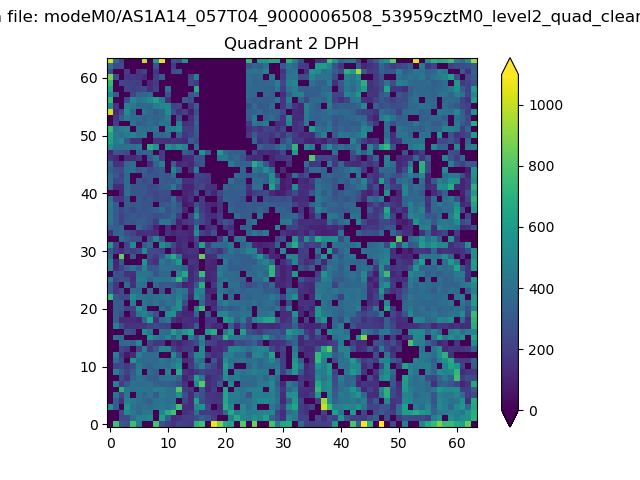
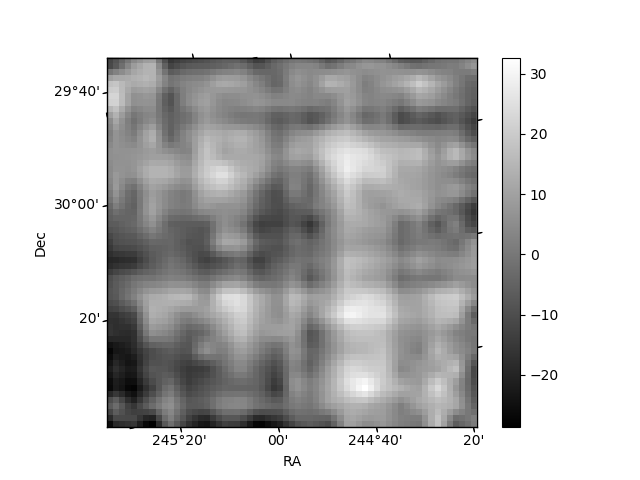
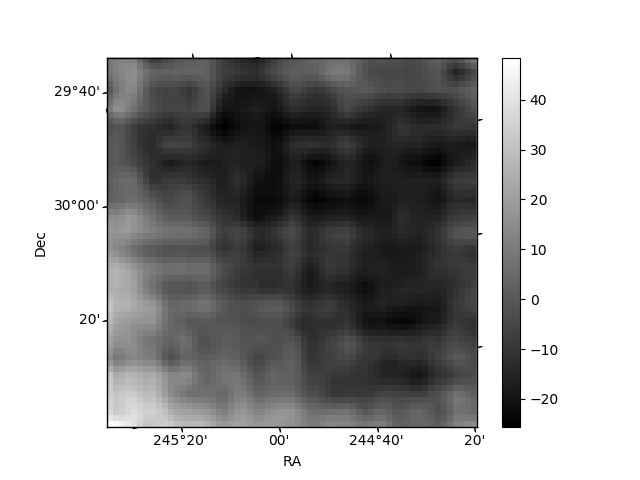
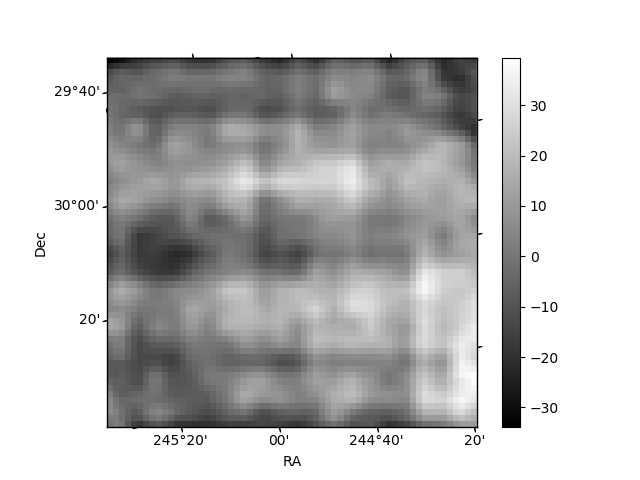
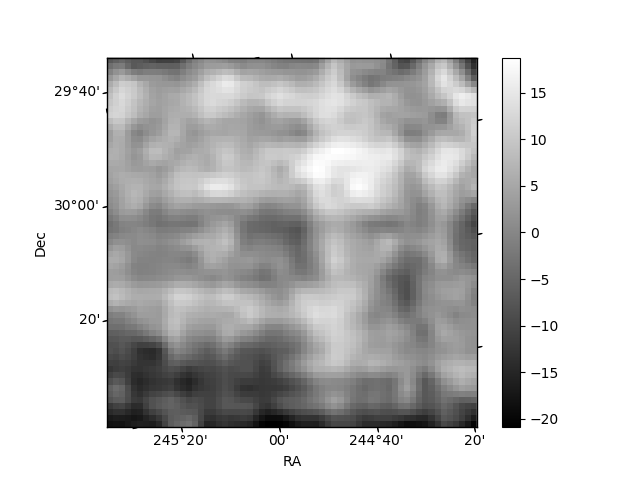
Histogram calculated using DETX and DETY for each event in the final _common_clean file
| Quadrant A | 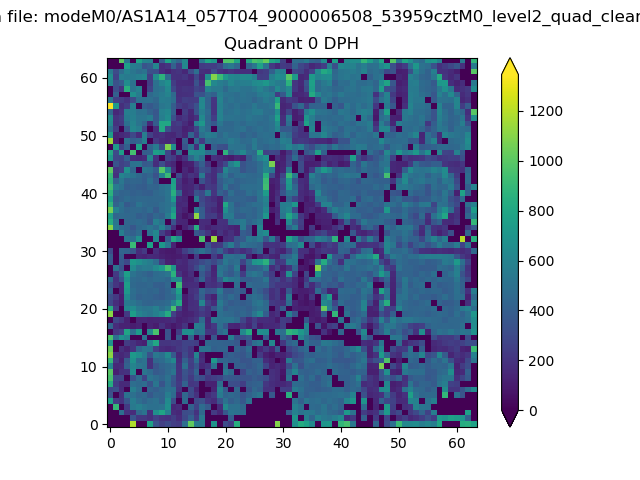 |
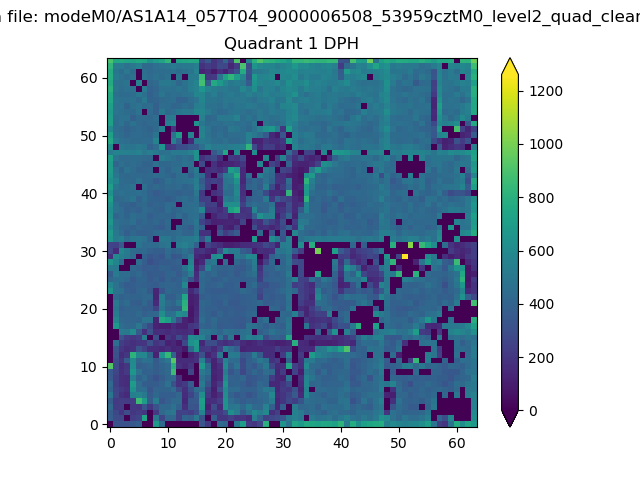 |
Quadrant B |
|---|---|---|---|
| Quadrant D | 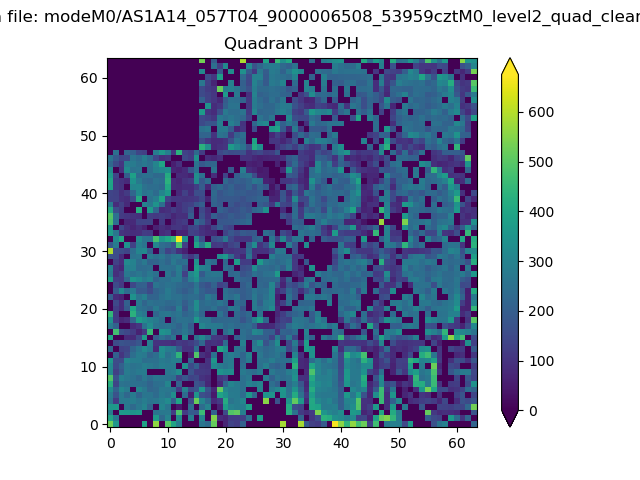 |
 |
Quadrant C |
| Plot type | Count rate plots | Images |
|---|---|---|
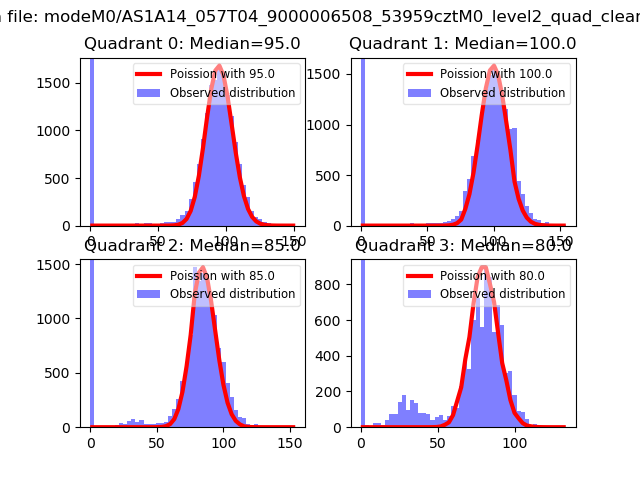
| Comparison with Poisson distribution Blue bars denote a histogram of data divided into 1 sec bins. Red curve is a Poisson curve with rate = median count rate of data. |
 |
 |
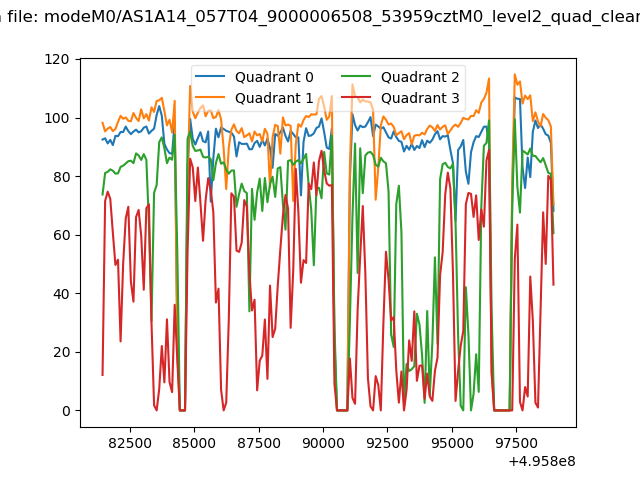
| Quadrant-wise count rates Data is divided into 100 sec bins |
 |
|
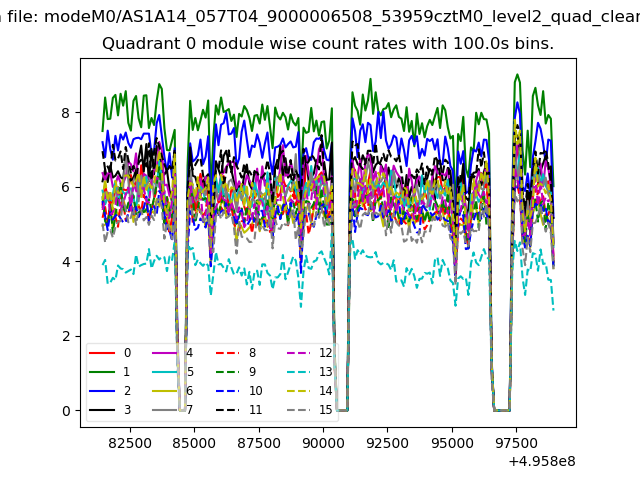
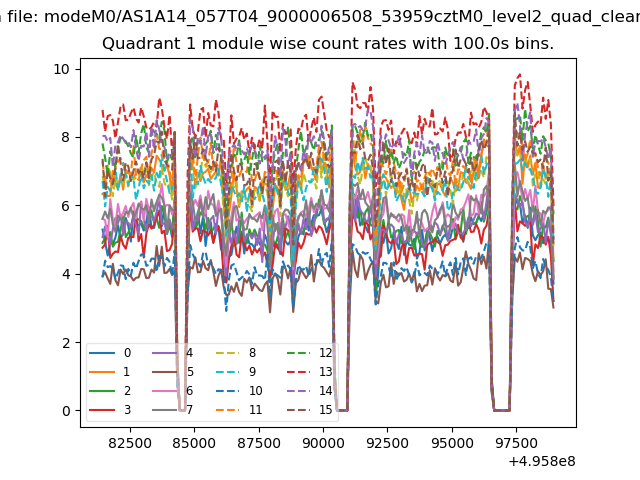
| Module-wise count rates for Quadrant A Data is divided into 100 sec bins |
 |
 |
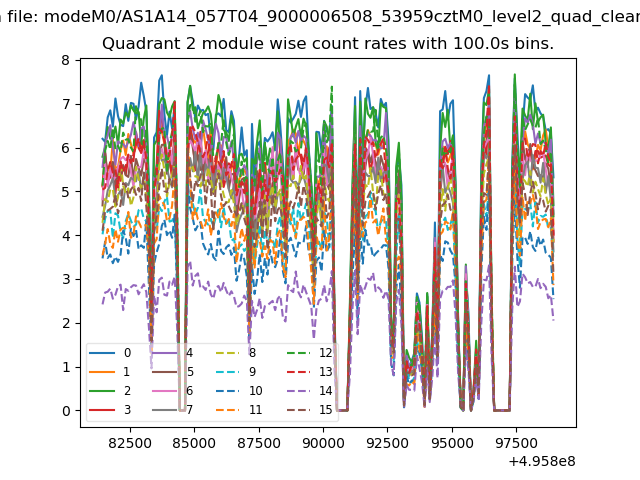
| Module-wise count rates for Quadrant B Data is divided into 100 sec bins |
 |
 |
| Module-wise count rates for Quadrant C Data is divided into 100 sec bins |
 |
 |
| Module-wise count rates for Quadrant D Data is divided into 100 sec bins |
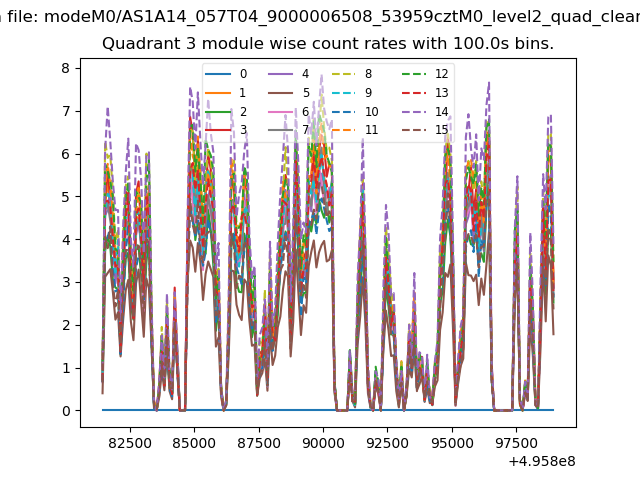 |
 |
| Parameter | Plot |
|---|---|
| CZT HV Monitor | 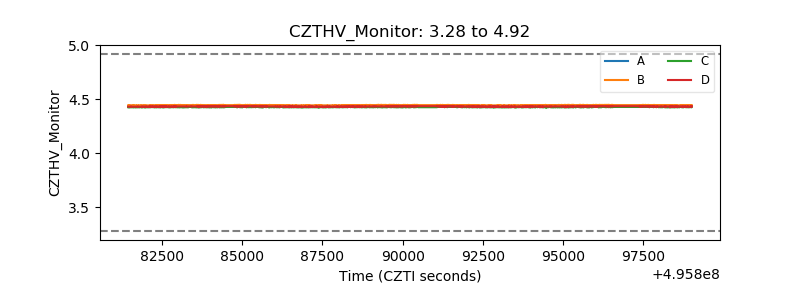 |
| D_VDD | 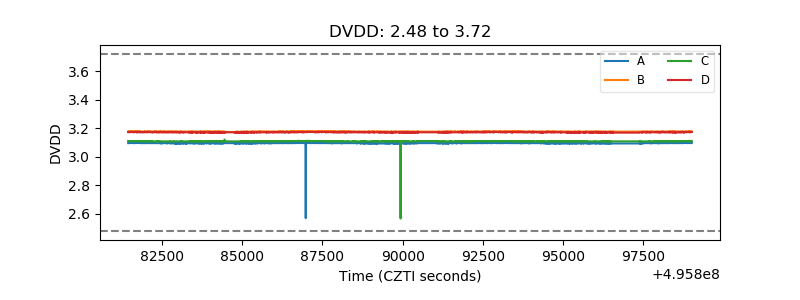 |
| Temperature 1 | 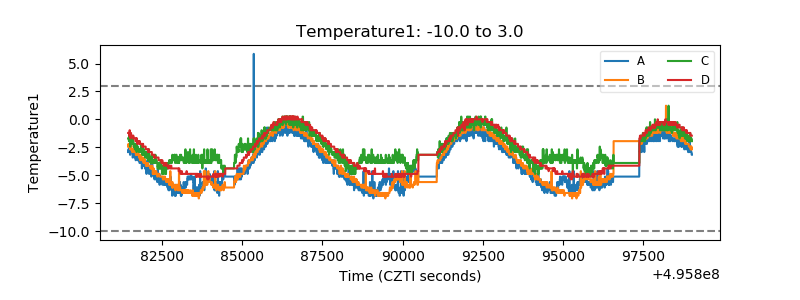 |
| Veto HV Monitor | 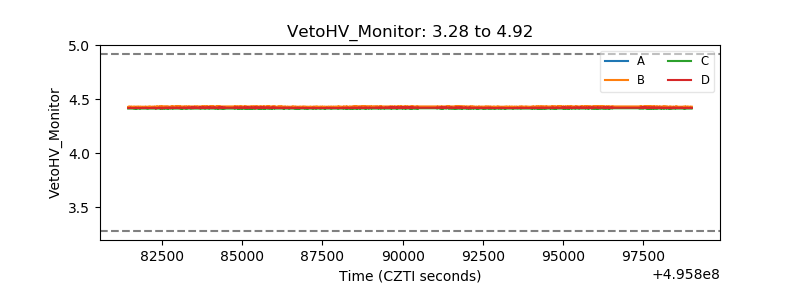 |
| Veto LLD | 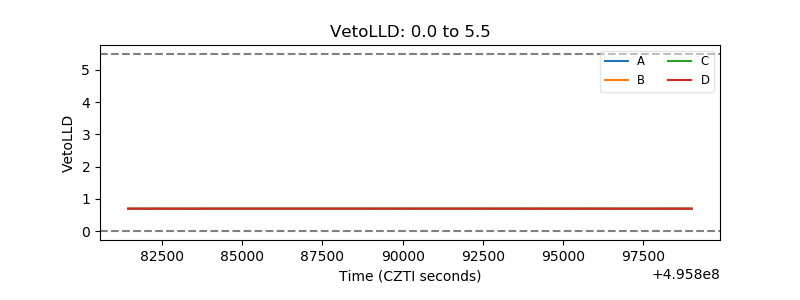 |
| Alpha Counter | 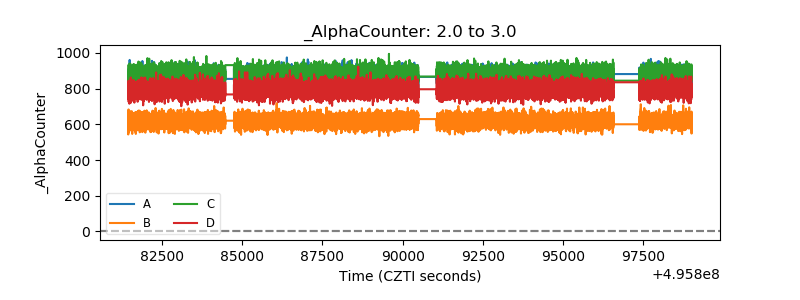 |
| _CPM_Rate | 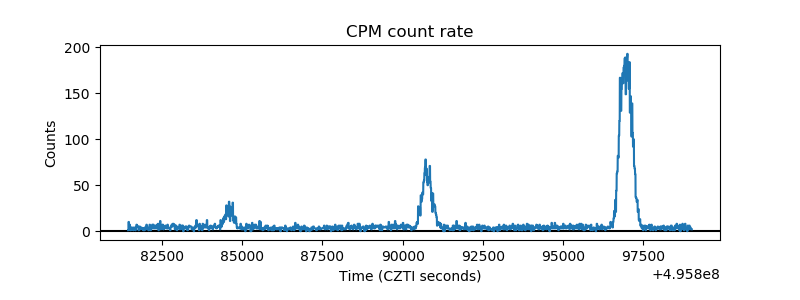 |
| CZT Counter | 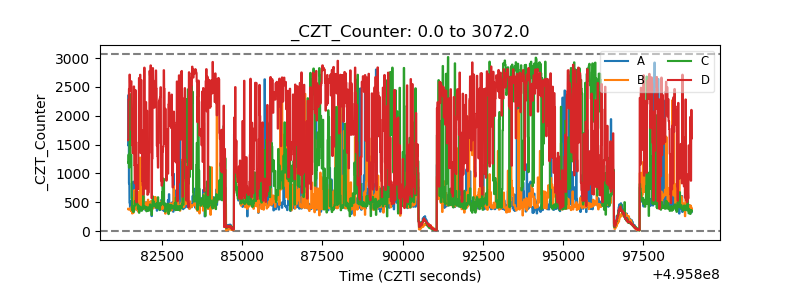 |
| +2.5 Volts monitor |  |
| +5 Volts monitor |  |
| _ROLL_ROT | 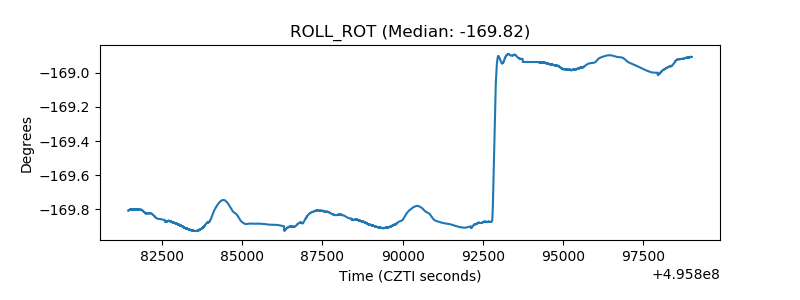 |
| _Roll_DEC | 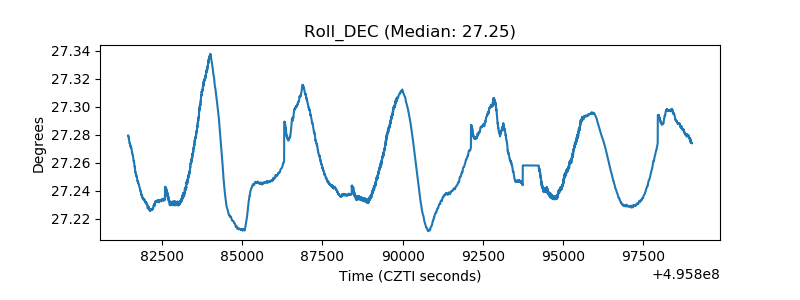 |
| _Roll_RA | 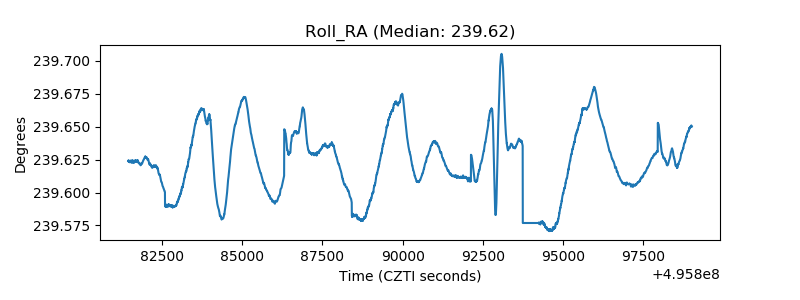 |
| Veto Counter | 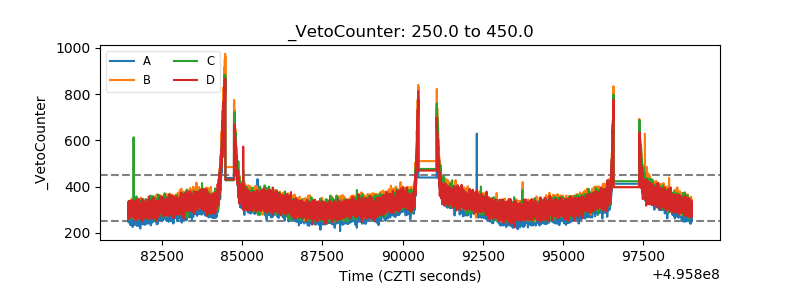 |