| Param | Original file | Final file |
|---|---|---|
| Filename | modeM0/AS1A14_057T04_9000006508_53961cztM0_level2.fits | modeM0/AS1A14_057T04_9000006508_53961cztM0_level2_quad_clean.evt |
| Size (bytes) | 524,972,160 | 83,070,720 |
| Size | 500.7 MB | 79.2 MB |
| Events in quadrant A | 3,477,325 | 582,350 |
| Events in quadrant B | 3,782,866 | 601,885 |
| Events in quadrant C | 3,165,088 | 545,169 |
| Events in quadrant D | 8,530,184 | 356,956 |
| Mode M0 | |||
|---|---|---|---|
| Quadrant | BADHDUFLAG | Total packets | Discarded packets |
| A | 0 | 14710 | 1 |
| B | 0 | 15632 | 1 |
| C | 0 | 14147 | 2 |
| D | 0 | 29619 | 1 |
| Mode SS | |||
|---|---|---|---|
| Quadrant | BADHDUFLAG | Total packets | Discarded packets |
| A | 0 | 126 | 0 |
| B | 0 | 126 | 0 |
| C | 0 | 126 | 0 |
| D | 0 | 126 | 0 |
| Mode M9 | |||
|---|---|---|---|
| Quadrant | BADHDUFLAG | Total packets | Discarded packets |
| A | 0 | 10 | 0 |
| B | 0 | 10 | 0 |
| C | 0 | 10 | 0 |
| D | 0 | 10 | 0 |
| Quadrant | Total seconds | Saturated seconds | Saturation percentage |
|---|---|---|---|
| A | 6137 | 191 | 3.112270% |
| B | 6137 | 284 | 4.627668% |
| C | 6136 | 181 | 2.949804% |
| D | 6136 | 2207 | 35.968057% |
Noise dominated data is calculated using 1-second bins in cleaned event files. If a bin has >2000 counts, and if more than 50% of those come from <1% of pixels, then it is considered to be noise-dominated and hence unusable.
| Quadrant | # 1 sec bins | Bins with >0 counts | Bins with >2000 counts | High rate bins dominated by noise | Noise dominated (total time) | Noise dominated (detector-on time) | Marked lightcurve |
|---|---|---|---|---|---|---|---|
| A | 7117 | 6138 | 134 | 134 | 1.88% | 2.18% | 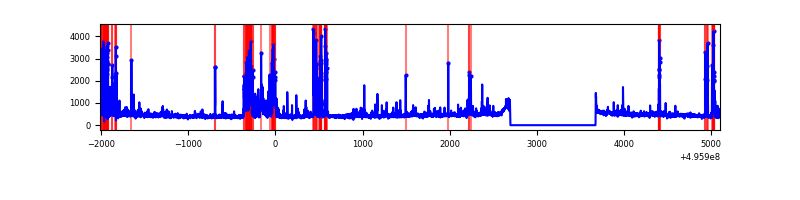 |
| B | 7117 | 6138 | 140 | 140 | 1.97% | 2.28% | 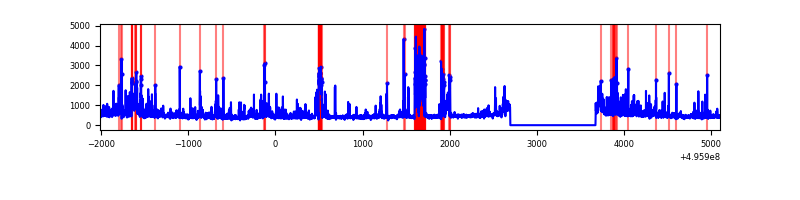 |
| C | 7116 | 6137 | 137 | 137 | 1.93% | 2.23% | 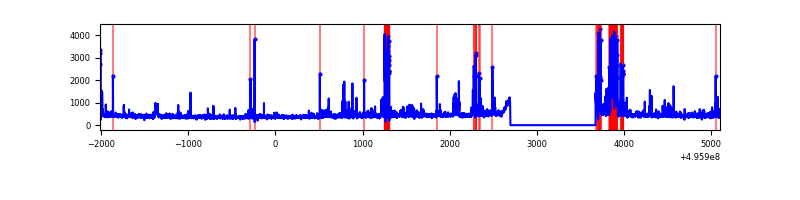 |
| D | 7116 | 6136 | 1502 | 1502 | 21.11% | 24.48% | 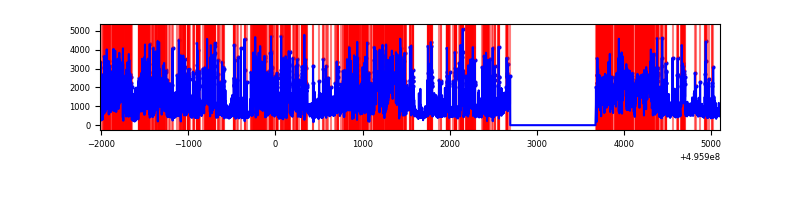 |
Top three noisy pixels from each quadrant. If the there are fewer than three noisy pixels in the level2.evt file, extra rows are filled as -1
| Pixel properties | Quadrant properties | ||||||
|---|---|---|---|---|---|---|---|
| Quadrant | DetID | PixID | Counts | Sigma | Mean | Median | Sigma |
| A | 0 | 8 | 377225 | 2326.69 | 650 | 633 | 161.9 |
| A | 13 | 248 | 161270 | 992.46 | 650 | 633 | 161.9 |
| A | 7 | 14 | 150436 | 925.52 | 650 | 633 | 161.9 |
| B | 0 | 213 | 410739 | 2996.71 | 639 | 617 | 136.9 |
| B | 2 | 249 | 329606 | 2403.88 | 639 | 617 | 136.9 |
| B | 5 | 250 | 152273 | 1108.13 | 639 | 617 | 136.9 |
| C | 1 | 241 | 334661 | 1924.59 | 628 | 621 | 173.6 |
| C | 12 | 2 | 207405 | 1191.39 | 628 | 621 | 173.6 |
| C | 13 | 3 | 45386 | 257.91 | 628 | 621 | 173.6 |
| D | 8 | 176 | 4242934 | 30614.79 | 482 | 460 | 138.6 |
| D | 6 | 239 | 631292 | 4552.25 | 482 | 460 | 138.6 |
| D | 3 | 12 | 504128 | 3634.6 | 482 | 460 | 138.6 |
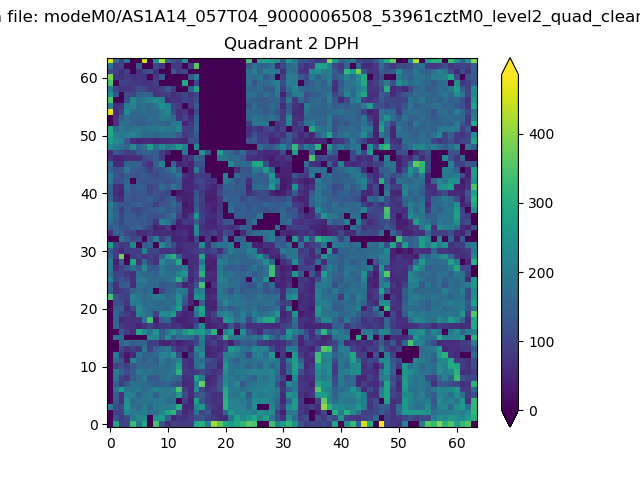
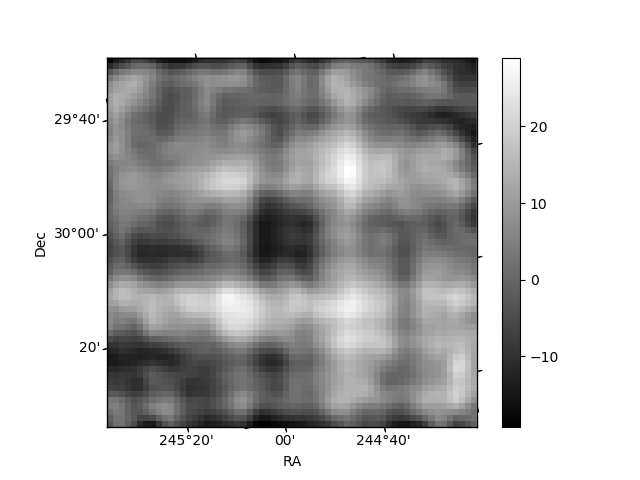
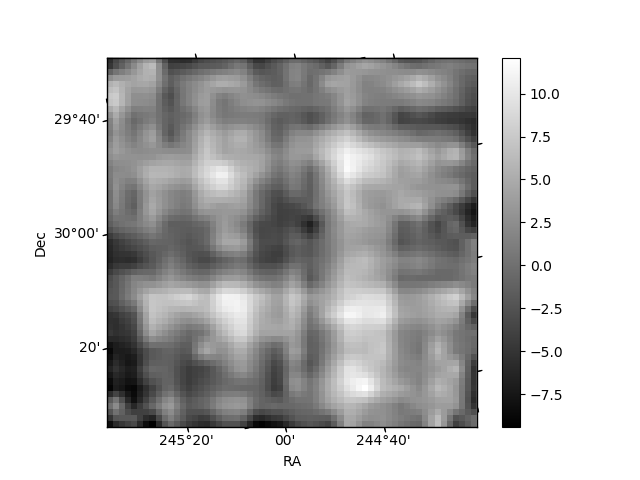
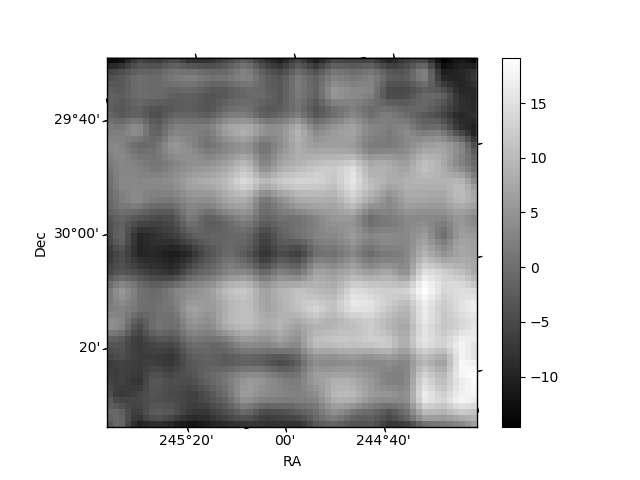
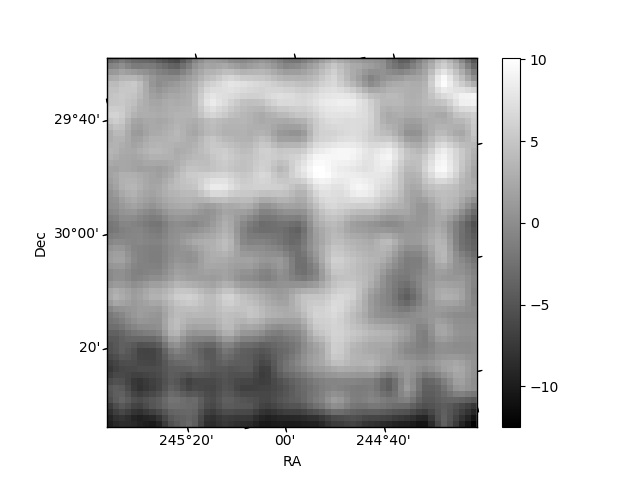
Histogram calculated using DETX and DETY for each event in the final _common_clean file
| Quadrant A | 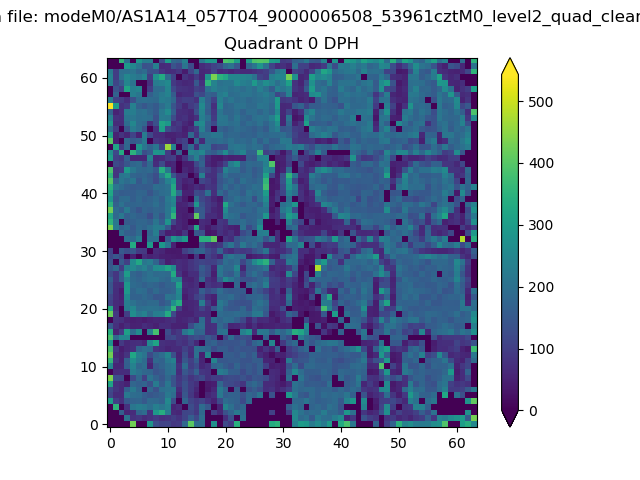 |
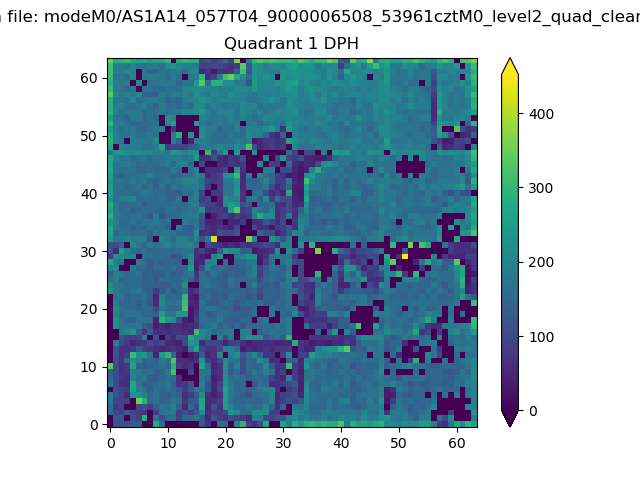 |
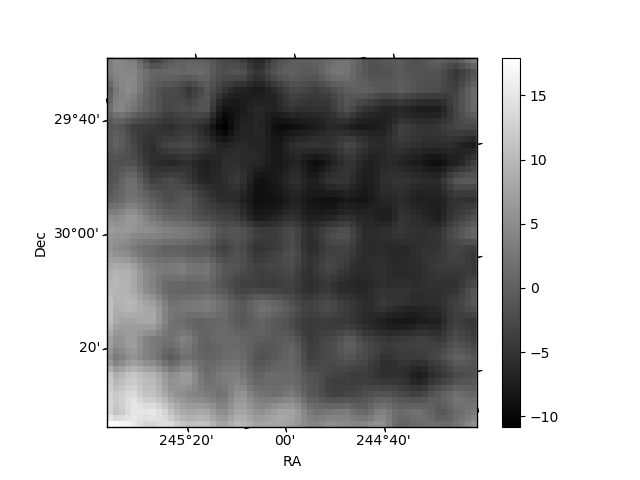
Quadrant B |
|---|---|---|---|
| Quadrant D | 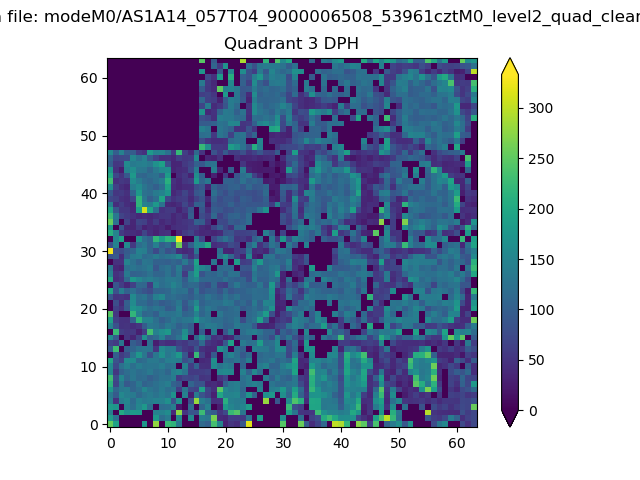 |
 |
Quadrant C |
| Plot type | Count rate plots | Images |
|---|---|---|
| Comparison with Poisson distribution Blue bars denote a histogram of data divided into 1 sec bins. Red curve is a Poisson curve with rate = median count rate of data. |
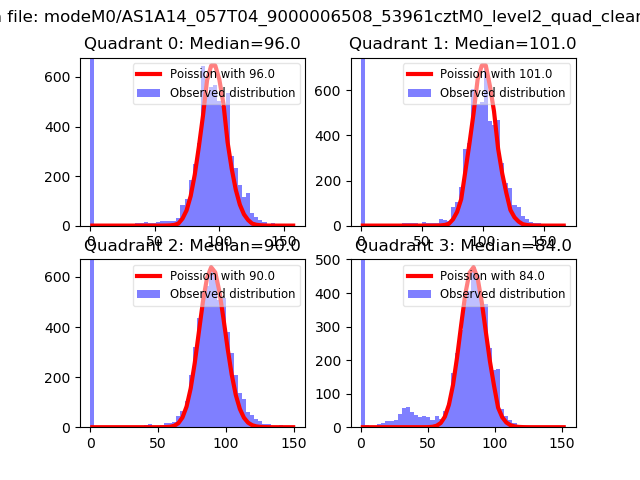 |
 |
| Quadrant-wise count rates Data is divided into 100 sec bins |
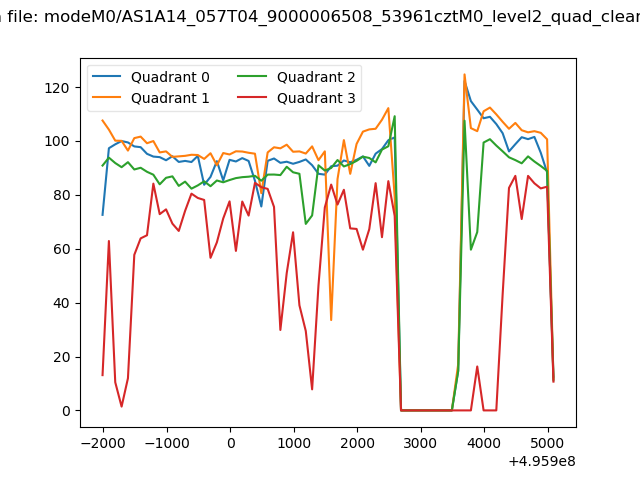 |
|
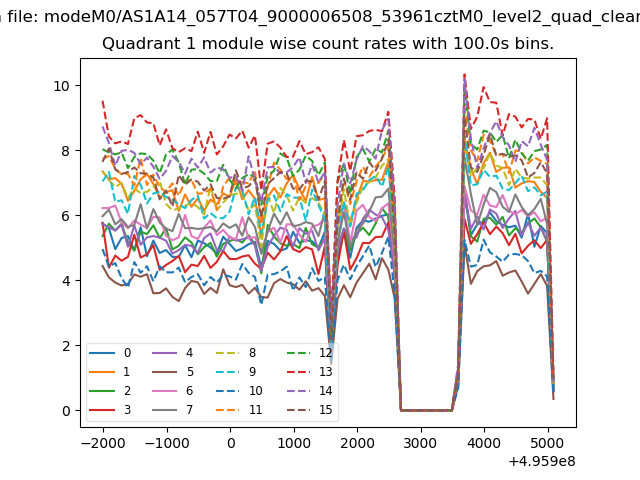
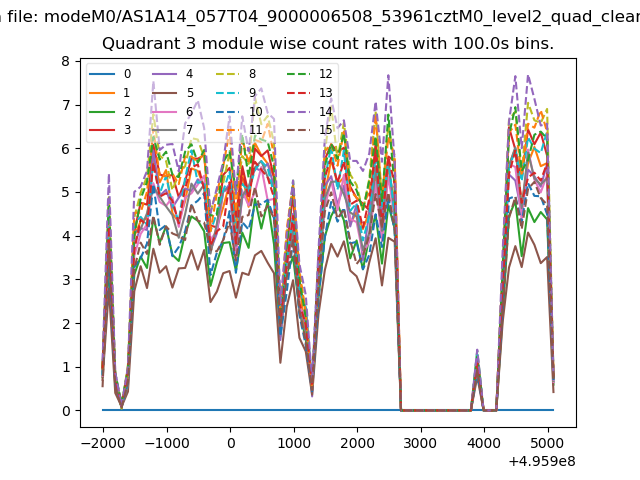
| Module-wise count rates for Quadrant A Data is divided into 100 sec bins |
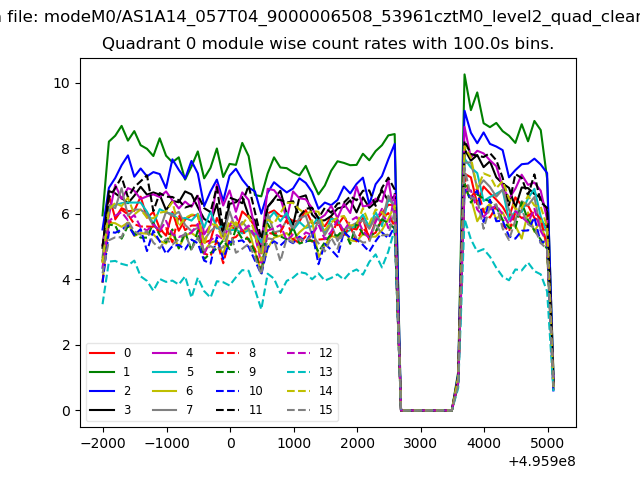 |
 |
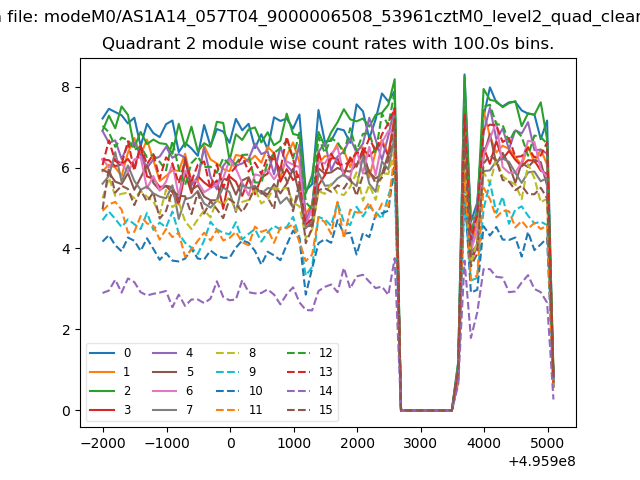
| Module-wise count rates for Quadrant B Data is divided into 100 sec bins |
 |
 |
| Module-wise count rates for Quadrant C Data is divided into 100 sec bins |
 |
 |
| Module-wise count rates for Quadrant D Data is divided into 100 sec bins |
 |
 |
| Parameter | Plot |
|---|---|
| CZT HV Monitor | 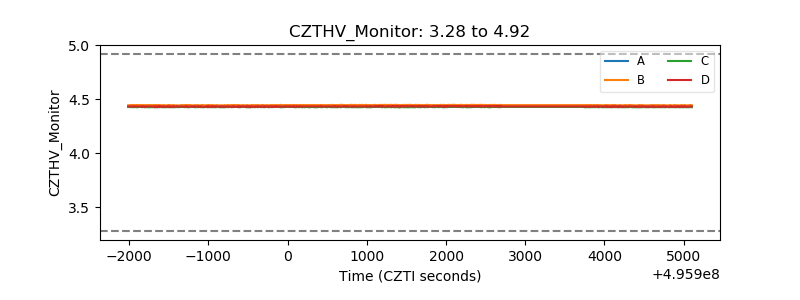 |
| D_VDD | 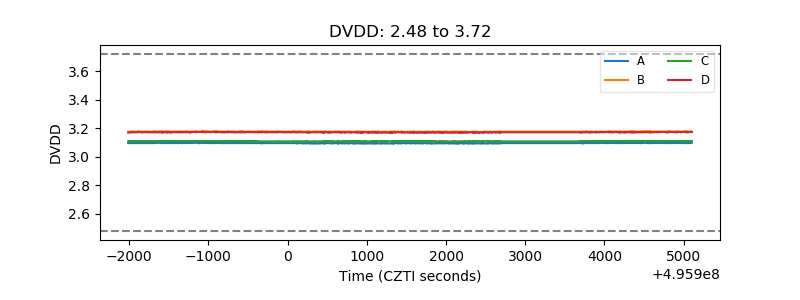 |
| Temperature 1 | 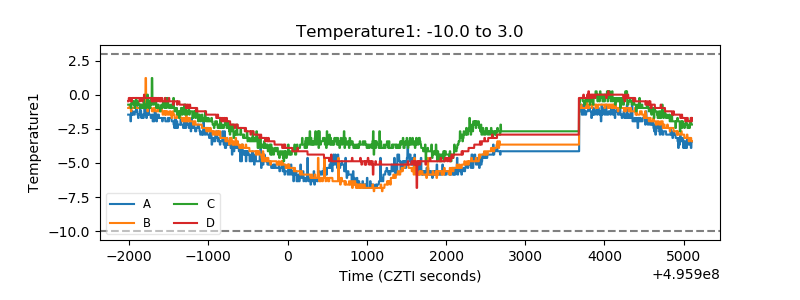 |
| Veto HV Monitor | 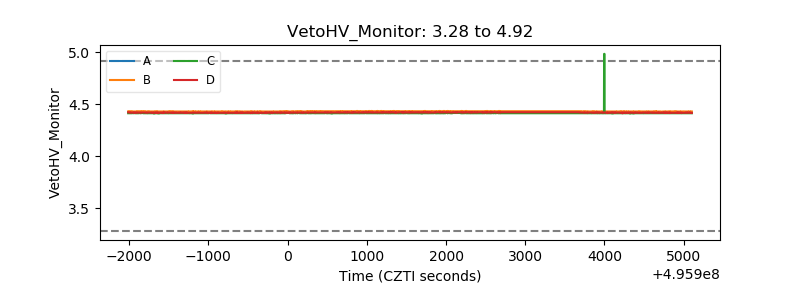 |
| Veto LLD | 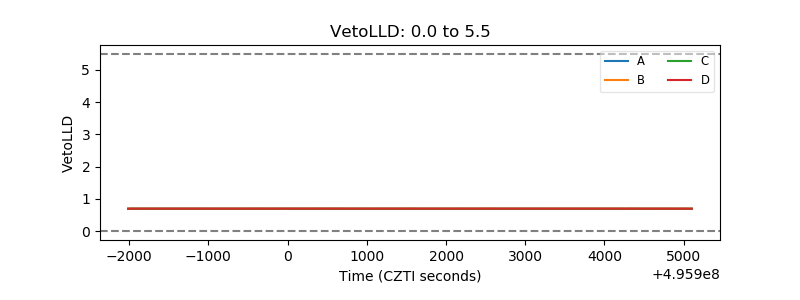 |
| Alpha Counter | 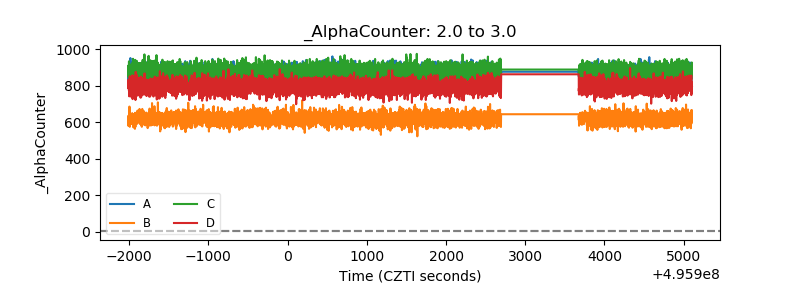 |
| _CPM_Rate | 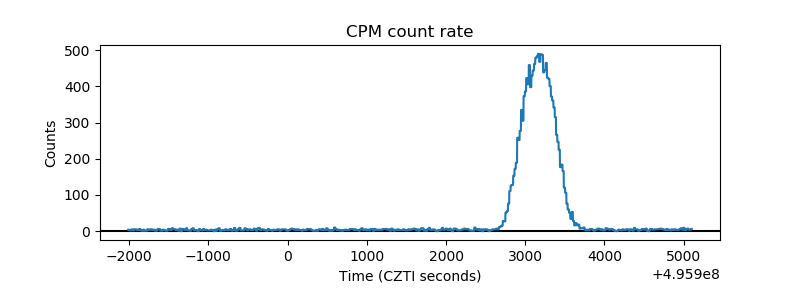 |
| CZT Counter | 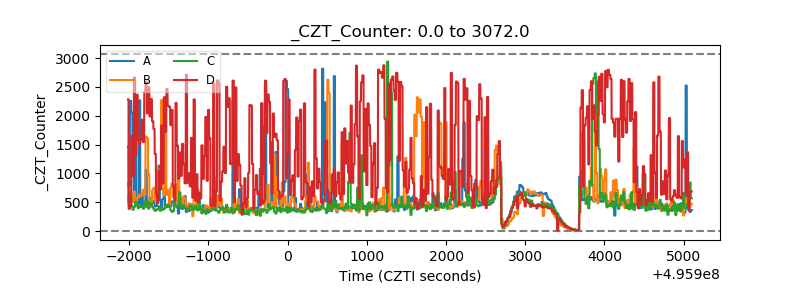 |
| +2.5 Volts monitor | 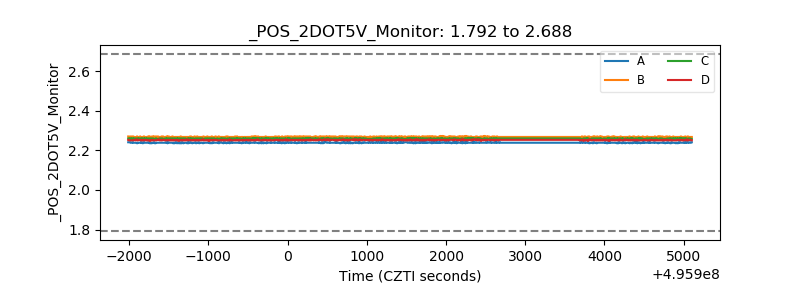 |
| +5 Volts monitor | 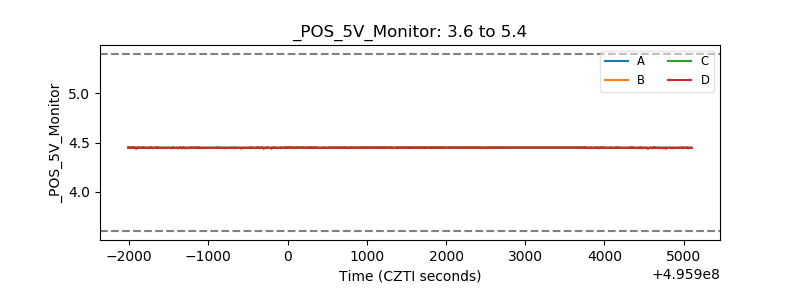 |
| _ROLL_ROT | 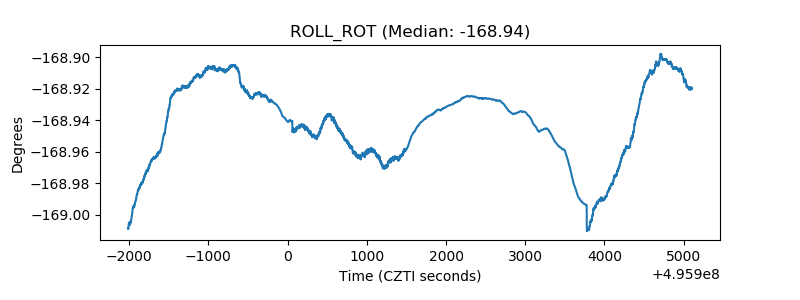 |
| _Roll_DEC | 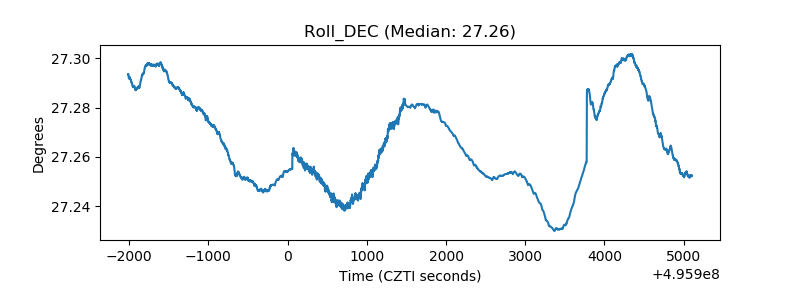 |
| _Roll_RA | 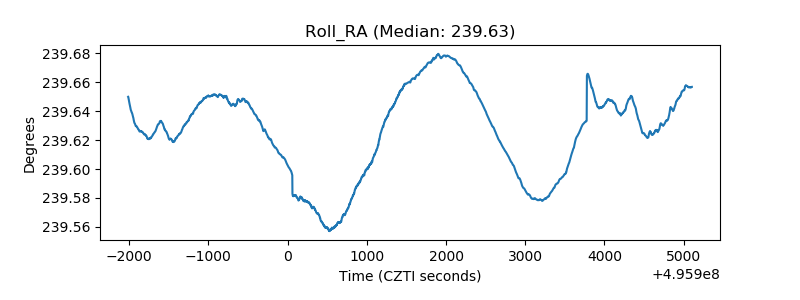 |
| Veto Counter | 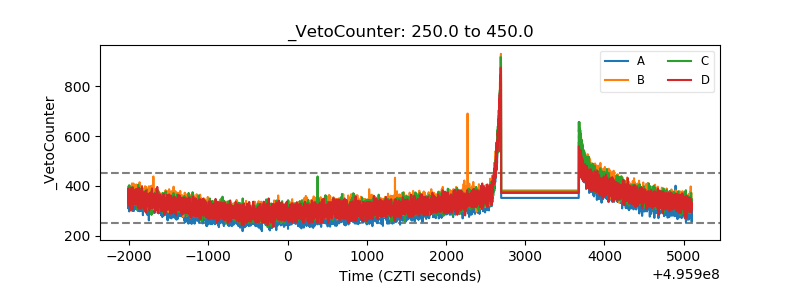 |