| Param | Original file | Final file |
|---|---|---|
| Filename | modeM0/AS1A14_057T04_9000006508_53962cztM0_level2.fits | modeM0/AS1A14_057T04_9000006508_53962cztM0_level2_quad_clean.evt |
| Size (bytes) | 3,073,348,800 | 383,256,000 |
| Size | 2.9 GB | 365.5 MB |
| Events in quadrant A | 18,083,817 | 2,810,704 |
| Events in quadrant B | 17,552,969 | 2,973,337 |
| Events in quadrant C | 25,282,472 | 2,417,842 |
| Events in quadrant D | 50,534,129 | 1,341,182 |
| Mode M0 | |||
|---|---|---|---|
| Quadrant | BADHDUFLAG | Total packets | Discarded packets |
| A | 0 | 74110 | 33 |
| B | 0 | 73024 | 31 |
| C | 0 | 96419 | 25 |
| D | 0 | 170949 | 153 |
| Mode SS | |||
|---|---|---|---|
| Quadrant | BADHDUFLAG | Total packets | Discarded packets |
| A | 0 | 606 | 0 |
| B | 0 | 606 | 0 |
| C | 0 | 606 | 0 |
| D | 0 | 606 | 0 |
| Mode M9 | |||
|---|---|---|---|
| Quadrant | BADHDUFLAG | Total packets | Discarded packets |
| A | 0 | 28 | 0 |
| B | 0 | 28 | 0 |
| C | 0 | 28 | 0 |
| D | 0 | 28 | 0 |
| Quadrant | Total seconds | Saturated seconds | Saturation percentage |
|---|---|---|---|
| A | 29962 | 1192 | 3.978373% |
| B | 29961 | 1009 | 3.367711% |
| C | 29967 | 3814 | 12.727333% |
| D | 29950 | 14476 | 48.333890% |
Noise dominated data is calculated using 1-second bins in cleaned event files. If a bin has >2000 counts, and if more than 50% of those come from <1% of pixels, then it is considered to be noise-dominated and hence unusable.
| Quadrant | # 1 sec bins | Bins with >0 counts | Bins with >2000 counts | High rate bins dominated by noise | Noise dominated (total time) | Noise dominated (detector-on time) | Marked lightcurve |
|---|---|---|---|---|---|---|---|
| A | 37661 | 29978 | 705 | 705 | 1.87% | 2.35% | 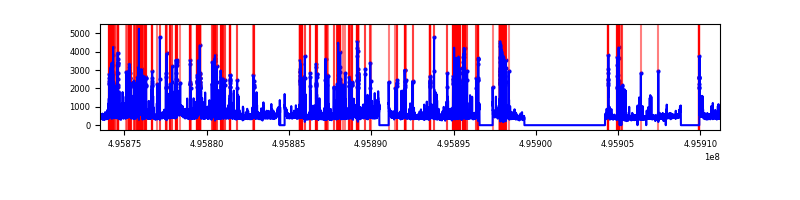 |
| B | 37662 | 29980 | 360 | 360 | 0.96% | 1.20% | 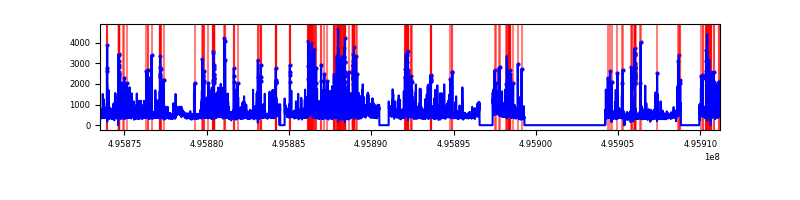 |
| C | 37662 | 29980 | 3250 | 3250 | 8.63% | 10.84% | 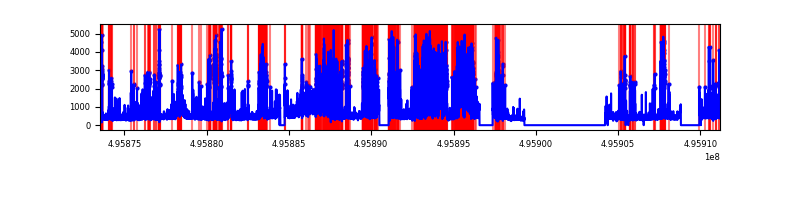 |
| D | 37662 | 29972 | 11338 | 11338 | 30.10% | 37.83% | 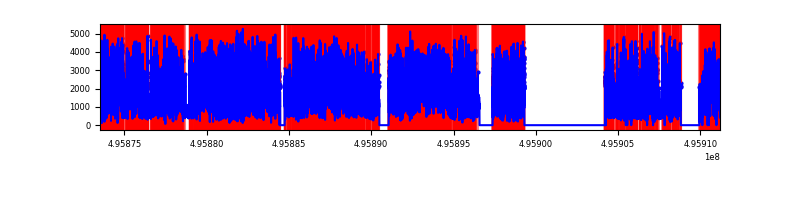 |
Top three noisy pixels from each quadrant. If the there are fewer than three noisy pixels in the level2.evt file, extra rows are filled as -1
| Pixel properties | Quadrant properties | ||||||
|---|---|---|---|---|---|---|---|
| Quadrant | DetID | PixID | Counts | Sigma | Mean | Median | Sigma |
| A | 0 | 8 | 1515927 | 1899.72 | 3233 | 3153 | 796.3 |
| A | 15 | 174 | 1399441 | 1753.44 | 3233 | 3153 | 796.3 |
| A | 4 | 249 | 539660 | 673.74 | 3233 | 3153 | 796.3 |
| B | 0 | 213 | 1363752 | 2017.76 | 3193 | 3081 | 674.3 |
| B | 0 | 155 | 678857 | 1002.12 | 3193 | 3081 | 674.3 |
| B | 5 | 250 | 571385 | 842.75 | 3193 | 3081 | 674.3 |
| C | 1 | 241 | 7870328 | 9662.45 | 2965 | 2941 | 814.2 |
| C | 9 | 38 | 2214629 | 2716.32 | 2965 | 2941 | 814.2 |
| C | 13 | 3 | 1036923 | 1269.9 | 2965 | 2941 | 814.2 |
| D | 8 | 176 | 27209279 | 41572.21 | 2275 | 2174 | 654.5 |
| D | 6 | 239 | 3448291 | 5265.64 | 2275 | 2174 | 654.5 |
| D | 3 | 12 | 3082368 | 4706.51 | 2275 | 2174 | 654.5 |
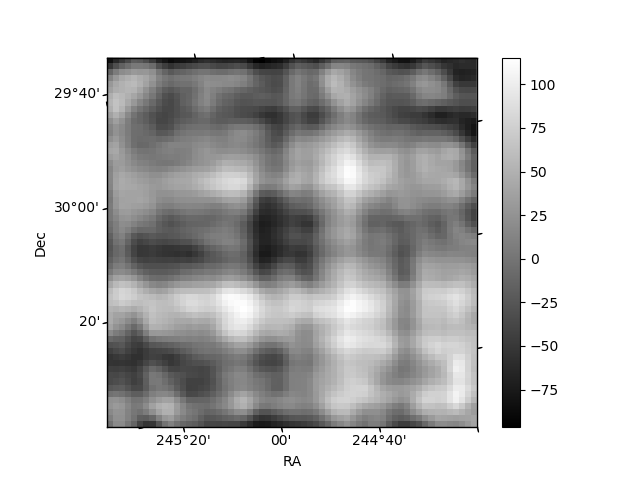
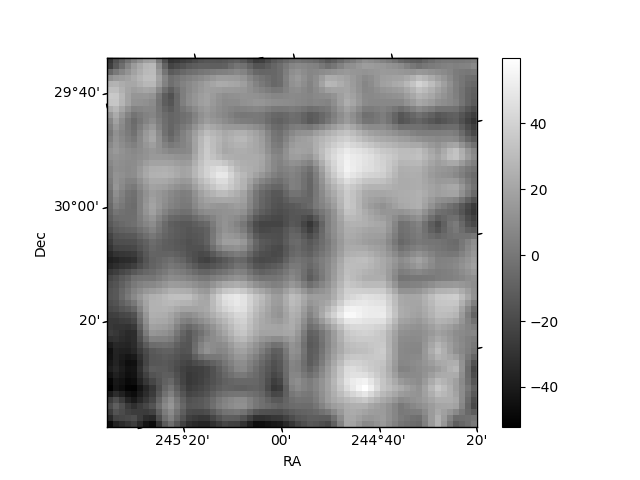
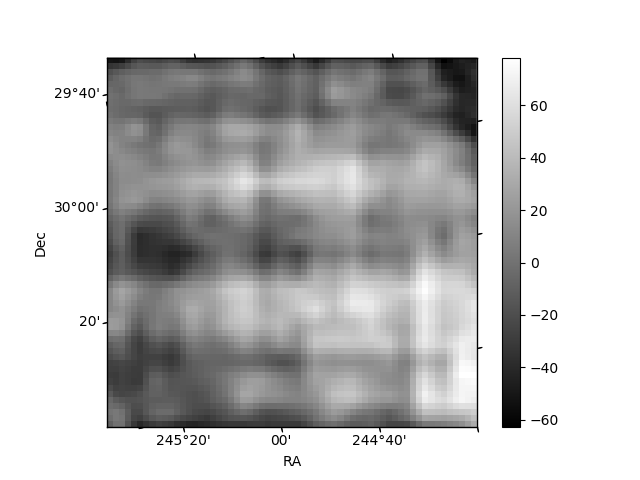
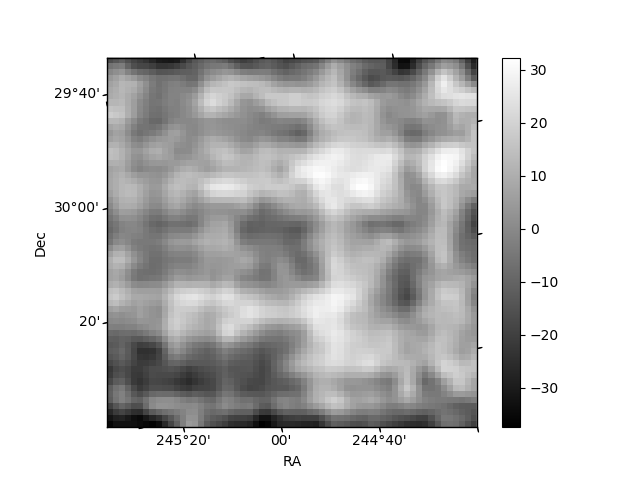
Histogram calculated using DETX and DETY for each event in the final _common_clean file
| Quadrant A | 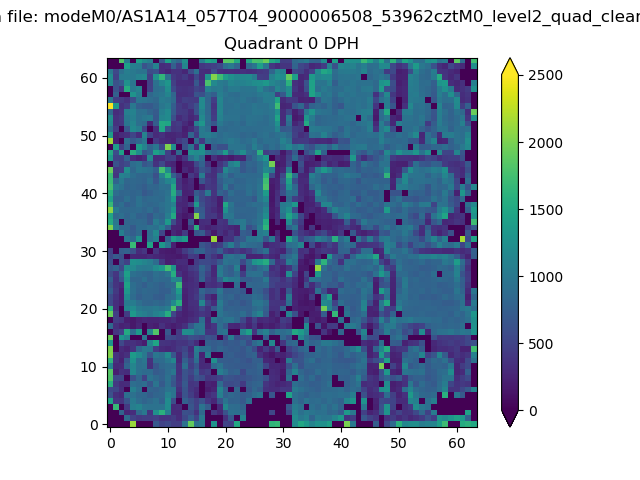 |
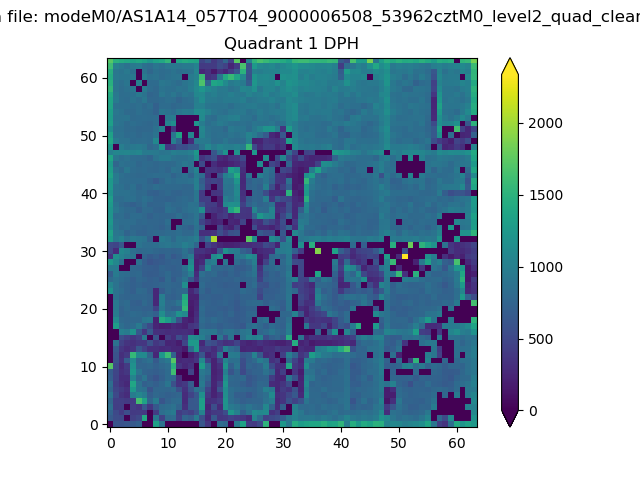 |
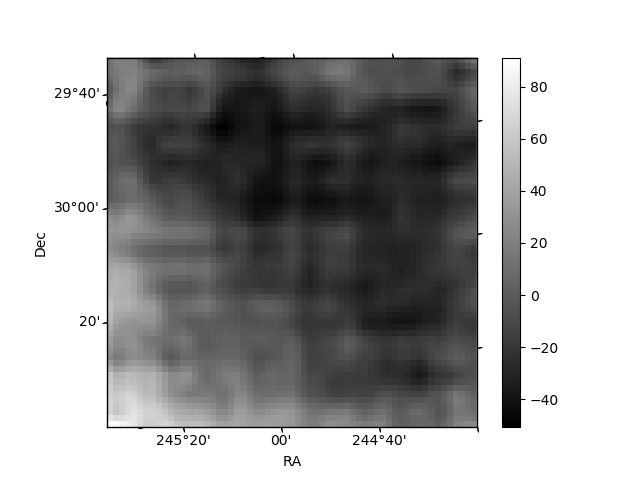
Quadrant B |
|---|---|---|---|
| Quadrant D | 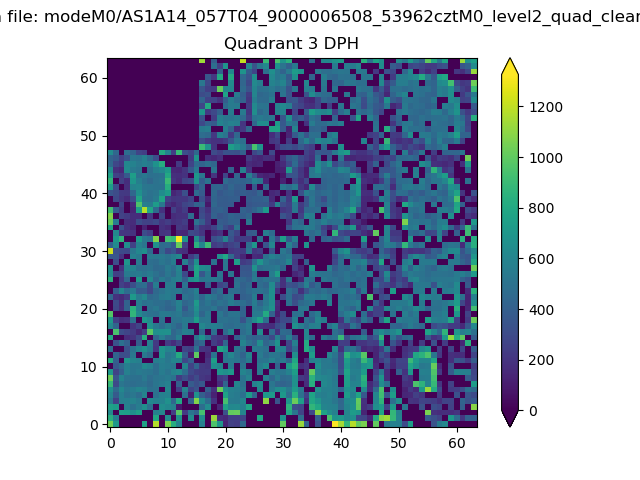 |
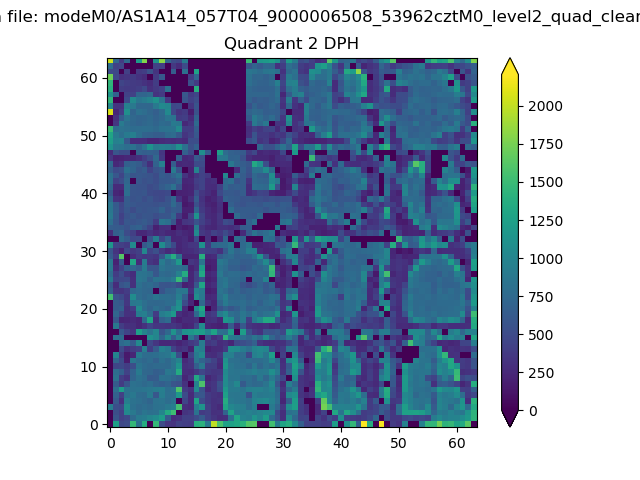 |
Quadrant C |
| Plot type | Count rate plots | Images |
|---|---|---|
| Comparison with Poisson distribution Blue bars denote a histogram of data divided into 1 sec bins. Red curve is a Poisson curve with rate = median count rate of data. |
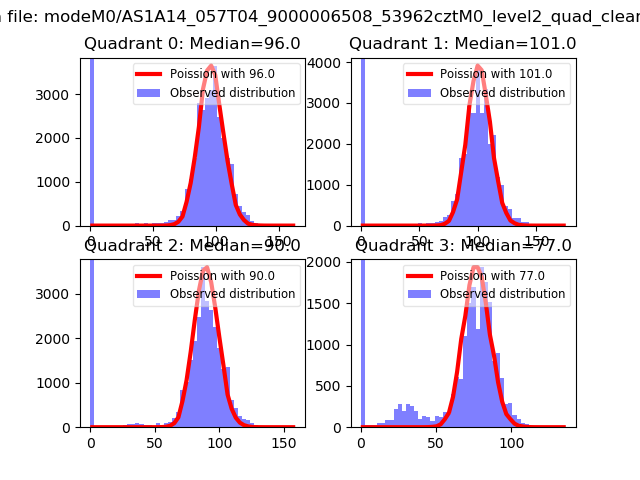 |
 |
| Quadrant-wise count rates Data is divided into 100 sec bins |
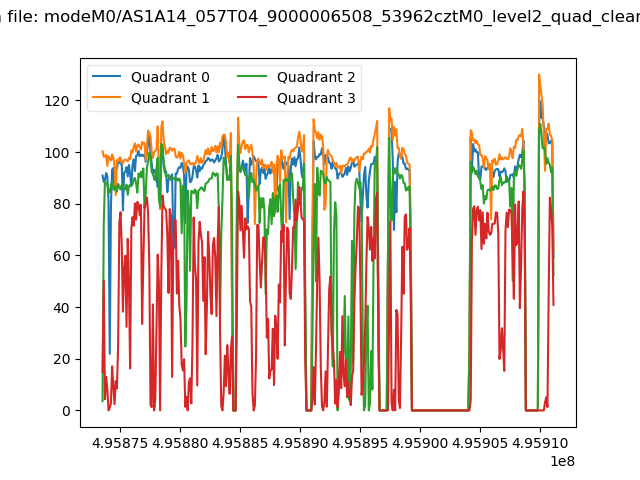 |
|
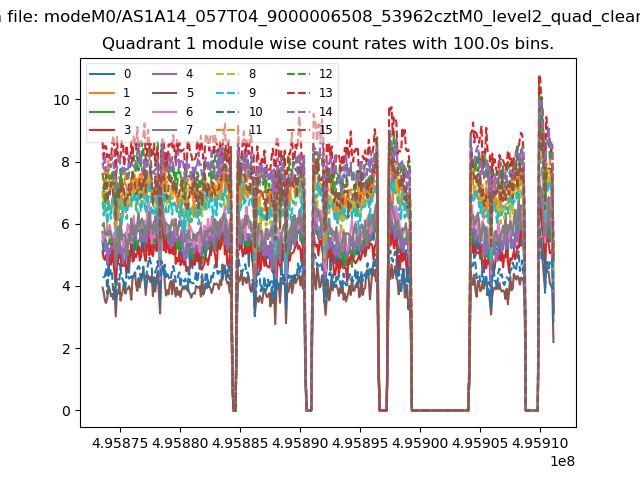
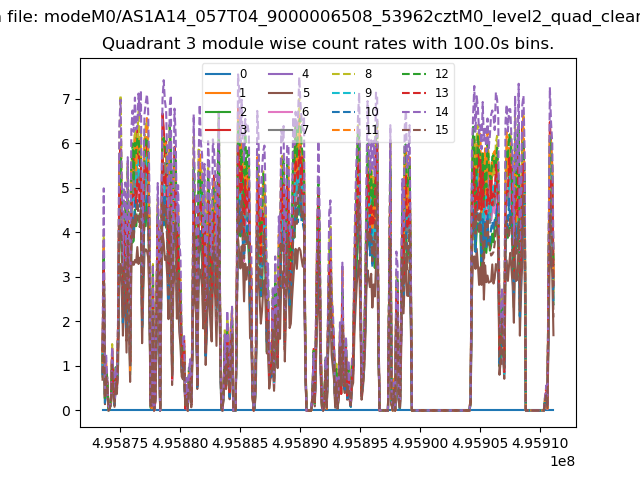
| Module-wise count rates for Quadrant A Data is divided into 100 sec bins |
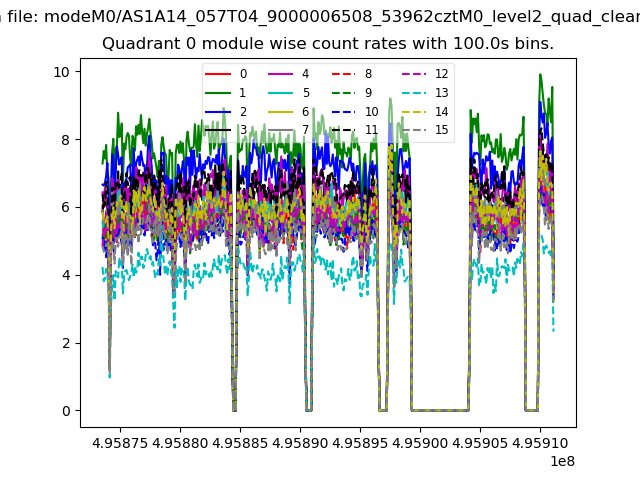 |
 |
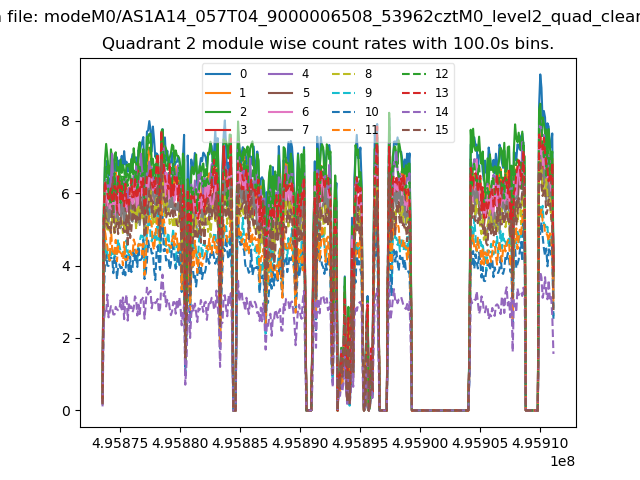
| Module-wise count rates for Quadrant B Data is divided into 100 sec bins |
 |
 |
| Module-wise count rates for Quadrant C Data is divided into 100 sec bins |
 |
 |
| Module-wise count rates for Quadrant D Data is divided into 100 sec bins |
 |
 |
| Parameter | Plot |
|---|---|
| CZT HV Monitor | 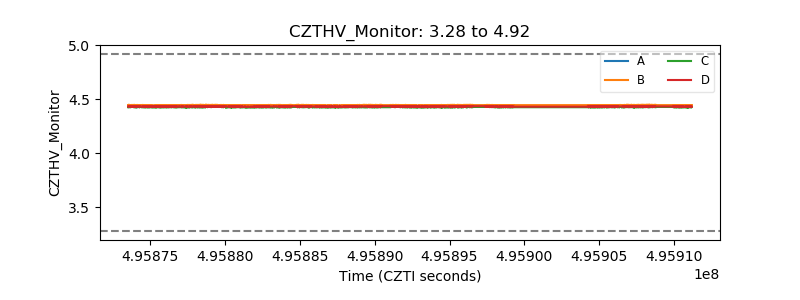 |
| D_VDD | 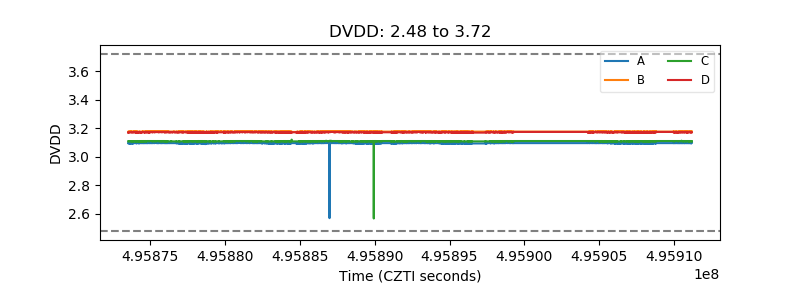 |
| Temperature 1 | 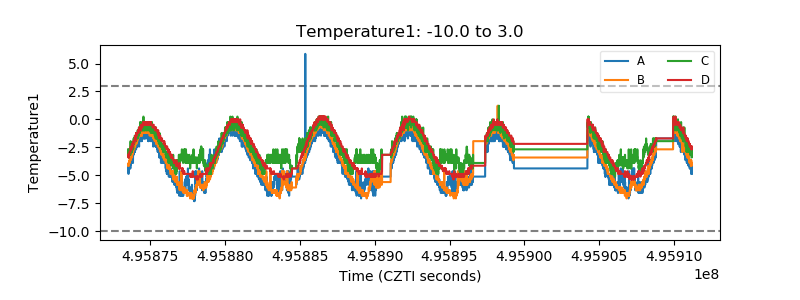 |
| Veto HV Monitor | 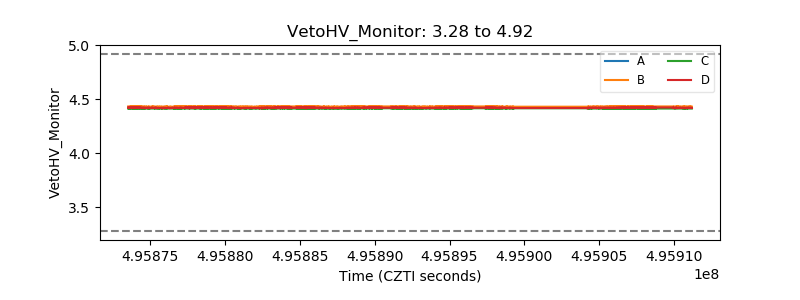 |
| Veto LLD | 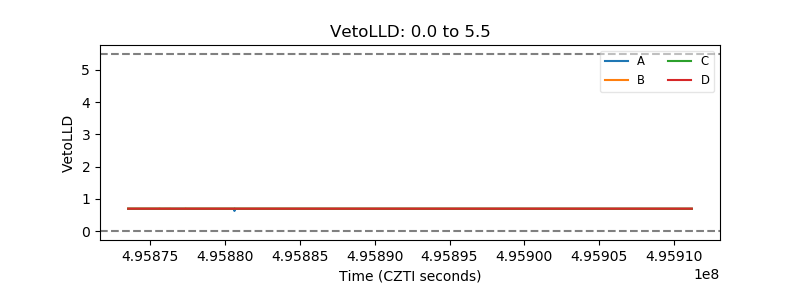 |
| Alpha Counter | 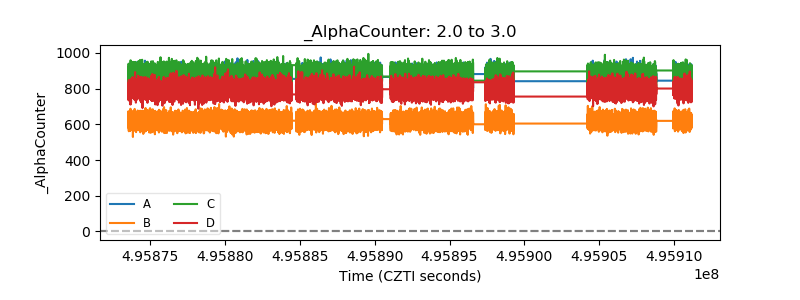 |
| _CPM_Rate | 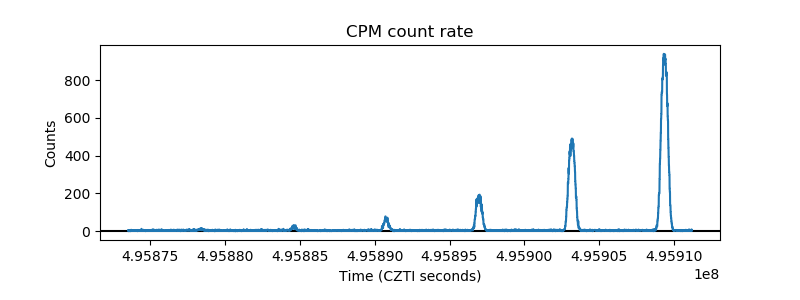 |
| CZT Counter | 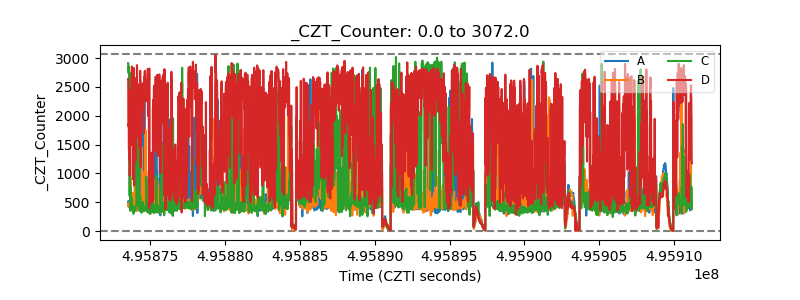 |
| +2.5 Volts monitor | 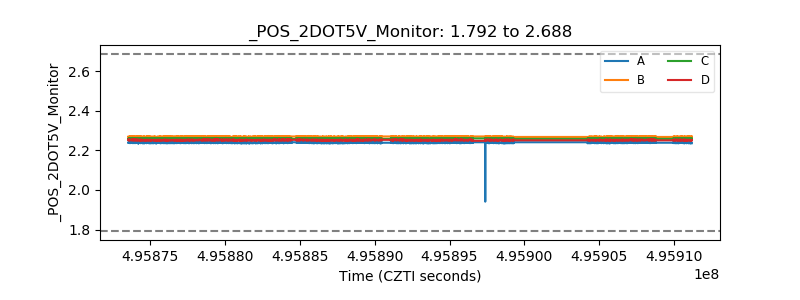 |
| +5 Volts monitor | 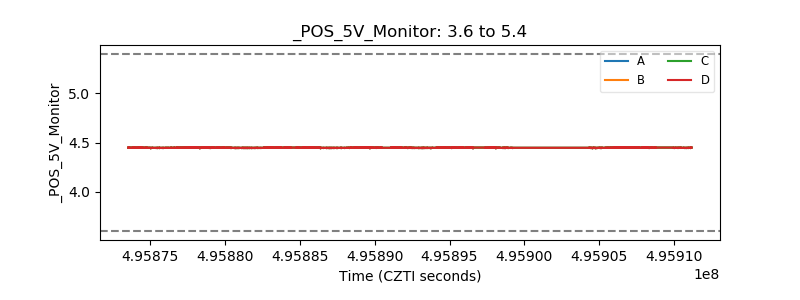 |
| _ROLL_ROT | 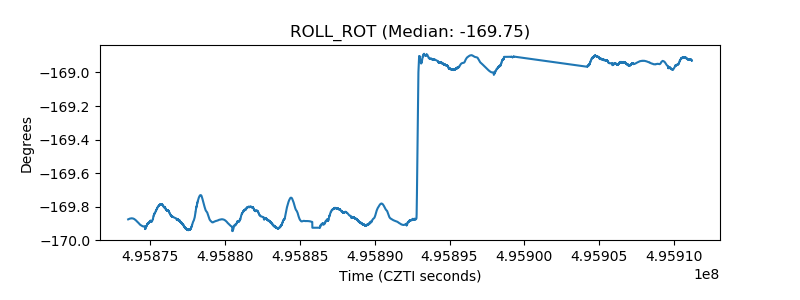 |
| _Roll_DEC | 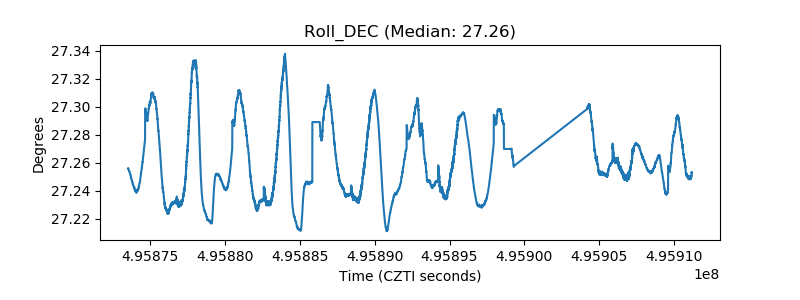 |
| _Roll_RA | 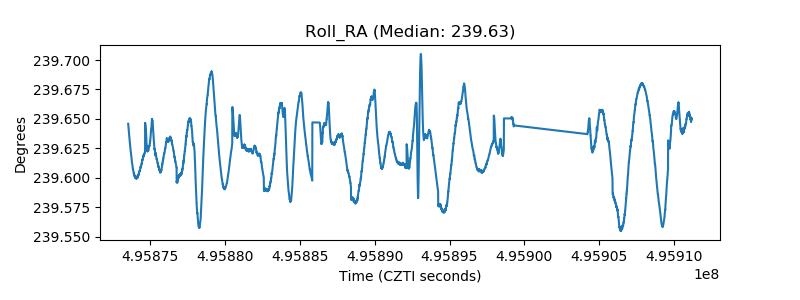 |
| Veto Counter | 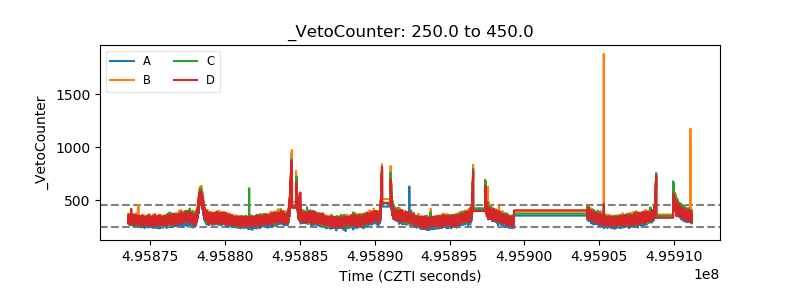 |