| Param | Original file | Final file |
|---|---|---|
| Filename | modeM0/AS1A14_057T04_9000006508_53964cztM0_level2.fits | modeM0/AS1A14_057T04_9000006508_53964cztM0_level2_quad_clean.evt |
| Size (bytes) | 602,202,240 | 87,874,560 |
| Size | 574.3 MB | 83.8 MB |
| Events in quadrant A | 3,267,242 | 642,899 |
| Events in quadrant B | 5,158,956 | 612,757 |
| Events in quadrant C | 3,155,433 | 611,673 |
| Events in quadrant D | 10,220,600 | 353,672 |
| Mode M0 | |||
|---|---|---|---|
| Quadrant | BADHDUFLAG | Total packets | Discarded packets |
| A | 0 | 14070 | 5 |
| B | 0 | 19565 | 9 |
| C | 0 | 13730 | 2 |
| D | 0 | 34733 | 2 |
| Mode SS | |||
|---|---|---|---|
| Quadrant | BADHDUFLAG | Total packets | Discarded packets |
| A | 0 | 128 | 0 |
| B | 0 | 128 | 0 |
| C | 0 | 128 | 0 |
| D | 0 | 128 | 0 |
| Mode M9 | |||
|---|---|---|---|
| Quadrant | BADHDUFLAG | Total packets | Discarded packets |
| A | 0 | 12 | 0 |
| B | 0 | 13 | 0 |
| C | 0 | 13 | 0 |
| D | 0 | 13 | 0 |
| Quadrant | Total seconds | Saturated seconds | Saturation percentage |
|---|---|---|---|
| A | 6297 | 48 | 0.762268% |
| B | 6298 | 733 | 11.638615% |
| C | 6298 | 26 | 0.412829% |
| D | 6298 | 2706 | 42.966021% |
Noise dominated data is calculated using 1-second bins in cleaned event files. If a bin has >2000 counts, and if more than 50% of those come from <1% of pixels, then it is considered to be noise-dominated and hence unusable.
| Quadrant | # 1 sec bins | Bins with >0 counts | Bins with >2000 counts | High rate bins dominated by noise | Noise dominated (total time) | Noise dominated (detector-on time) | Marked lightcurve |
|---|---|---|---|---|---|---|---|
| A | 7544 | 6299 | 20 | 20 | 0.27% | 0.32% | 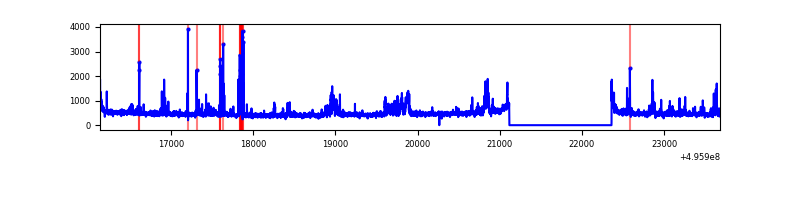 |
| B | 7543 | 6299 | 573 | 573 | 7.60% | 9.10% | 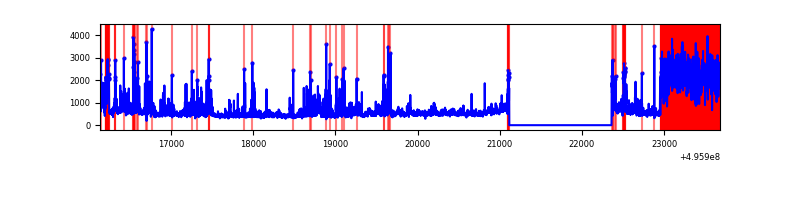 |
| C | 7543 | 6299 | 22 | 22 | 0.29% | 0.35% | 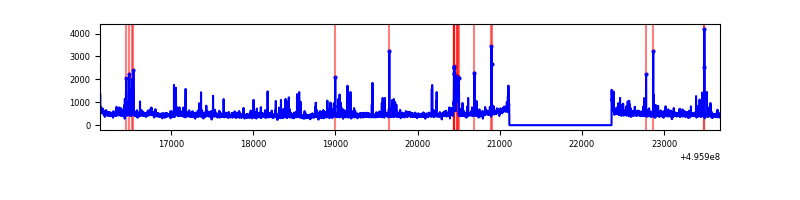 |
| D | 7543 | 6299 | 2262 | 2262 | 29.99% | 35.91% | 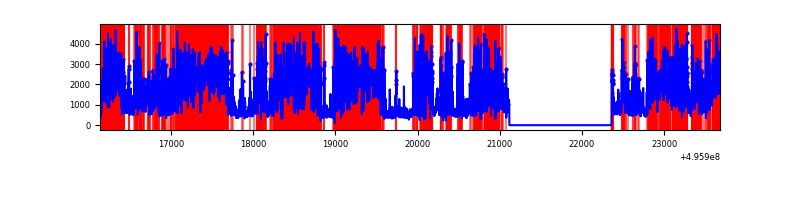 |
Top three noisy pixels from each quadrant. If the there are fewer than three noisy pixels in the level2.evt file, extra rows are filled as -1
| Pixel properties | Quadrant properties | ||||||
|---|---|---|---|---|---|---|---|
| Quadrant | DetID | PixID | Counts | Sigma | Mean | Median | Sigma |
| A | 15 | 174 | 122877 | 705.09 | 694 | 677 | 173.3 |
| A | 7 | 14 | 118840 | 681.8 | 694 | 677 | 173.3 |
| A | 12 | 17 | 59138 | 337.32 | 694 | 677 | 173.3 |
| B | 5 | 250 | 1703504 | 11958.62 | 671 | 648 | 142.4 |
| B | 0 | 213 | 484078 | 3394.98 | 671 | 648 | 142.4 |
| B | 6 | 255 | 83319 | 580.57 | 671 | 648 | 142.4 |
| C | 1 | 241 | 102882 | 535.58 | 683 | 677 | 190.8 |
| C | 12 | 2 | 66666 | 345.8 | 683 | 677 | 190.8 |
| C | 12 | 252 | 62070 | 321.71 | 683 | 677 | 190.8 |
| D | 8 | 176 | 6456683 | 43219.17 | 514 | 490 | 149.4 |
| D | 6 | 239 | 741171 | 4958.28 | 514 | 490 | 149.4 |
| D | 3 | 12 | 216084 | 1443.23 | 514 | 490 | 149.4 |
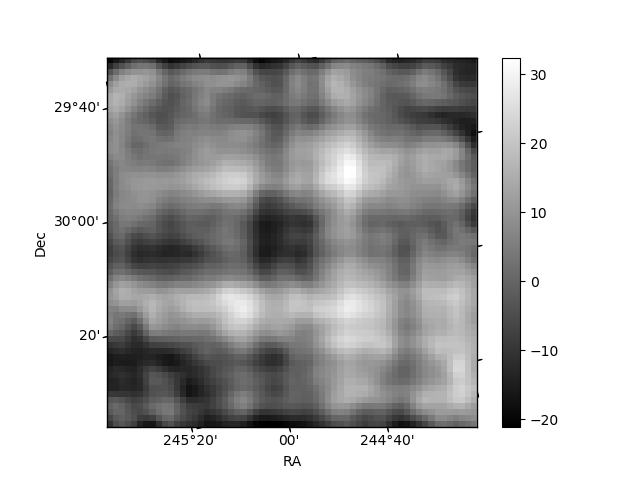
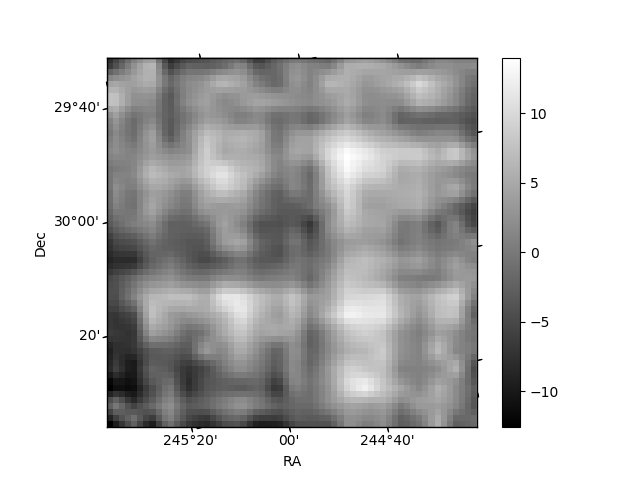
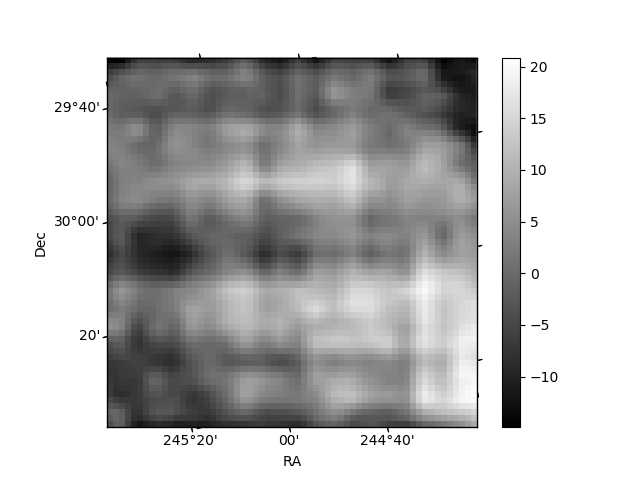
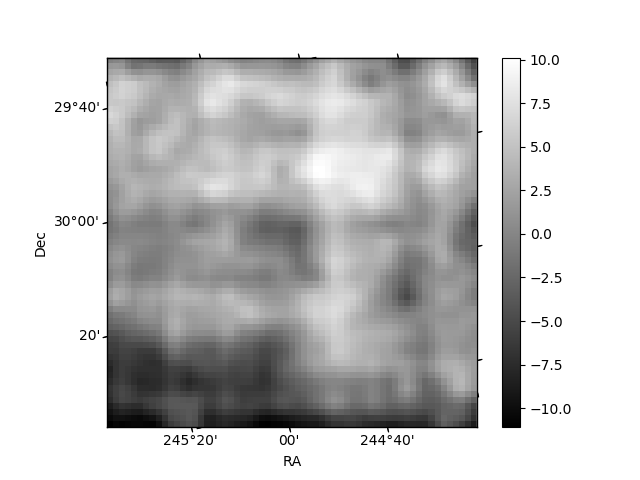
Histogram calculated using DETX and DETY for each event in the final _common_clean file
| Quadrant A | 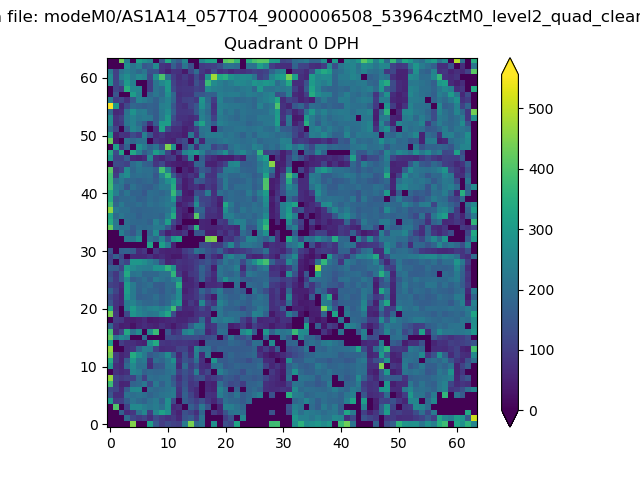 |
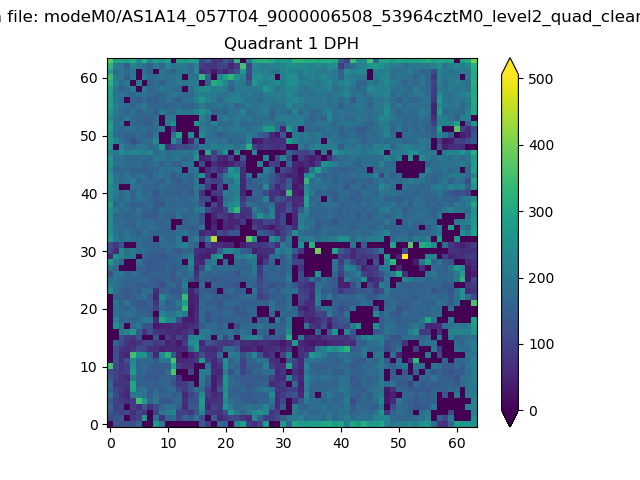 |
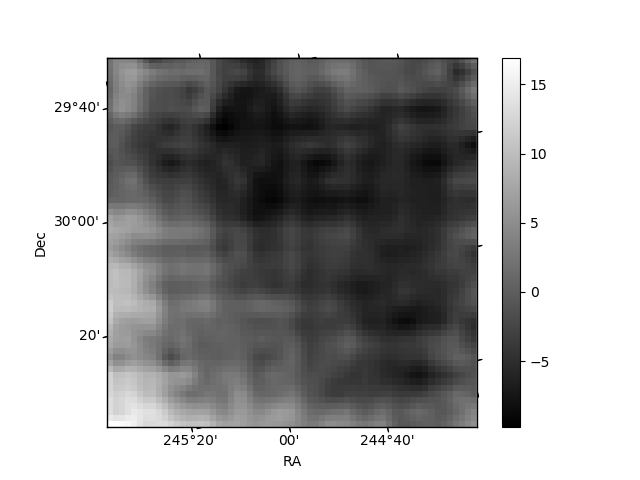
Quadrant B |
|---|---|---|---|
| Quadrant D | 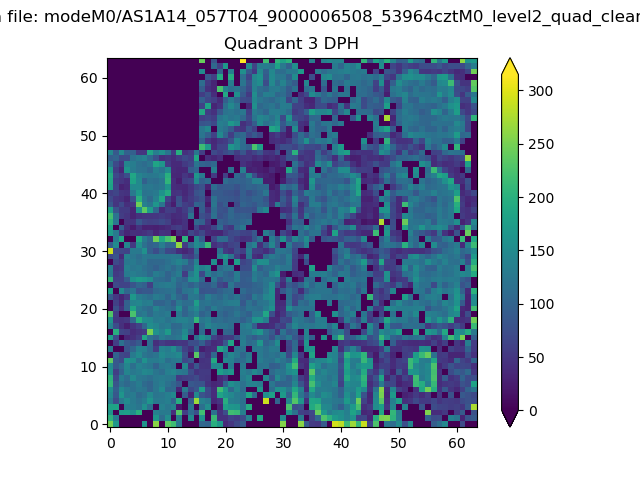 |
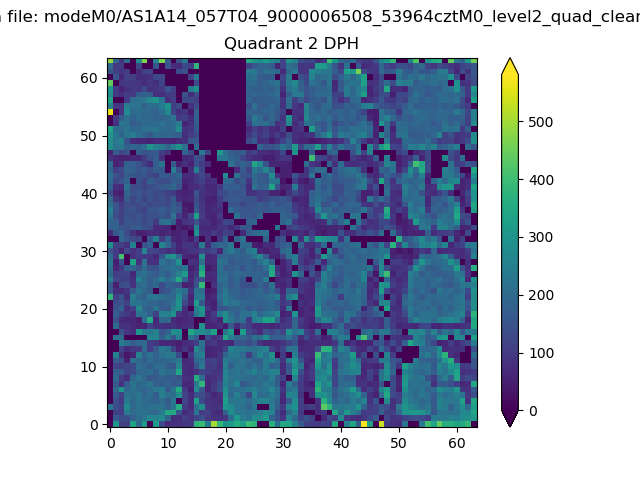 |
Quadrant C |
| Plot type | Count rate plots | Images |
|---|---|---|
| Comparison with Poisson distribution Blue bars denote a histogram of data divided into 1 sec bins. Red curve is a Poisson curve with rate = median count rate of data. |
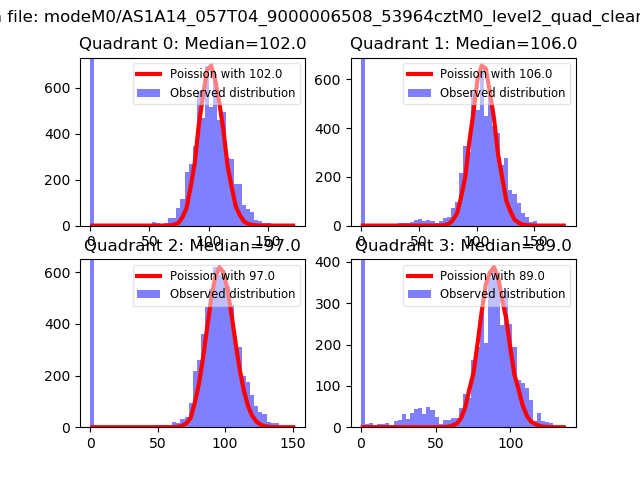 |
 |
| Quadrant-wise count rates Data is divided into 100 sec bins |
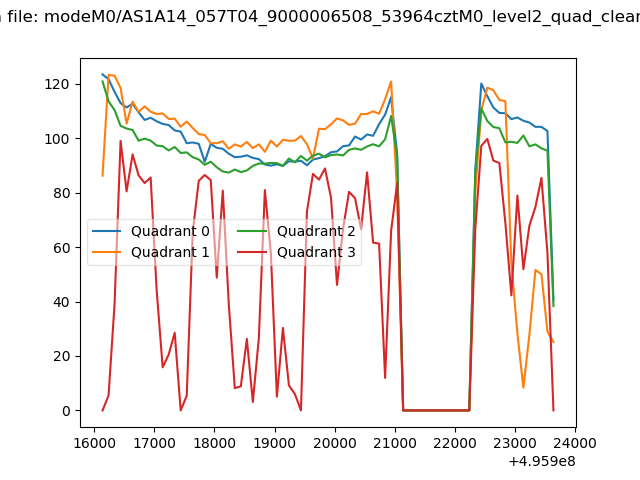 |
|
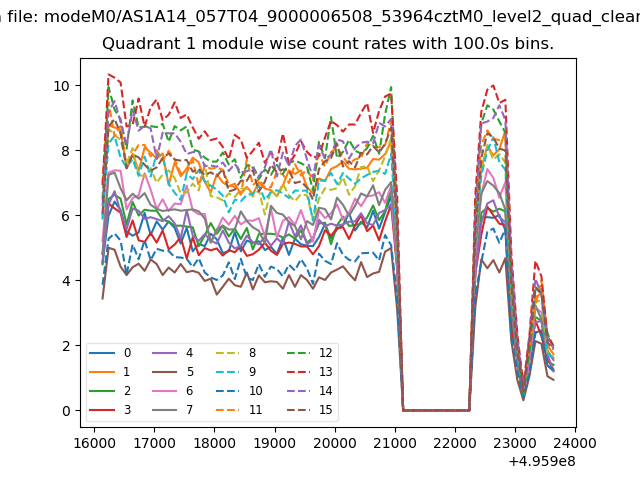
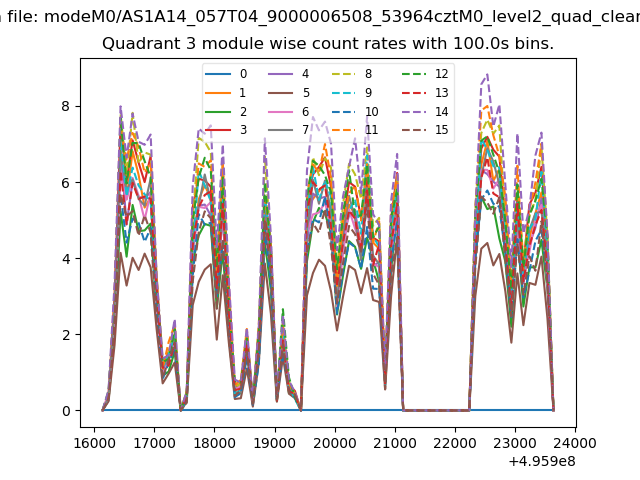
| Module-wise count rates for Quadrant A Data is divided into 100 sec bins |
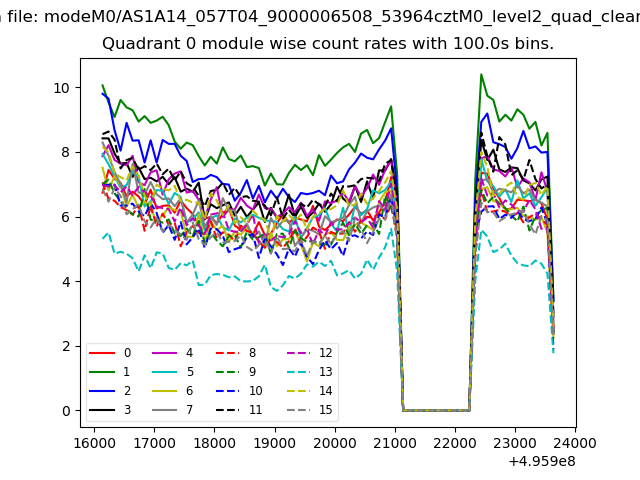 |
 |
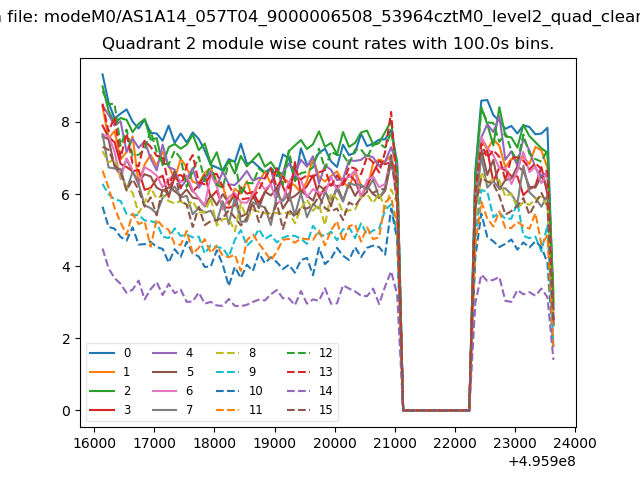
| Module-wise count rates for Quadrant B Data is divided into 100 sec bins |
 |
 |
| Module-wise count rates for Quadrant C Data is divided into 100 sec bins |
 |
 |
| Module-wise count rates for Quadrant D Data is divided into 100 sec bins |
 |
 |
| Parameter | Plot |
|---|---|
| CZT HV Monitor | 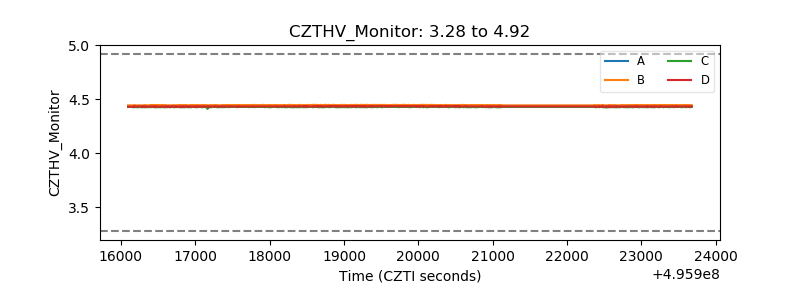 |
| D_VDD | 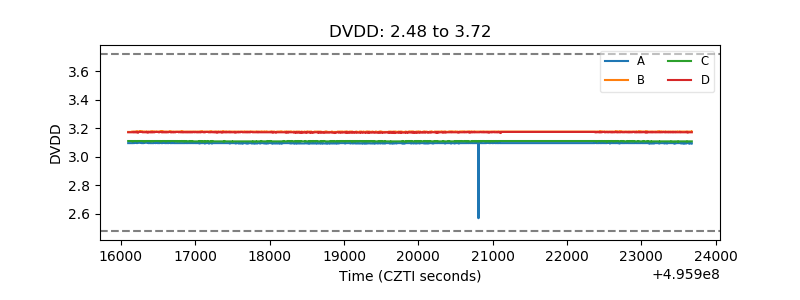 |
| Temperature 1 | 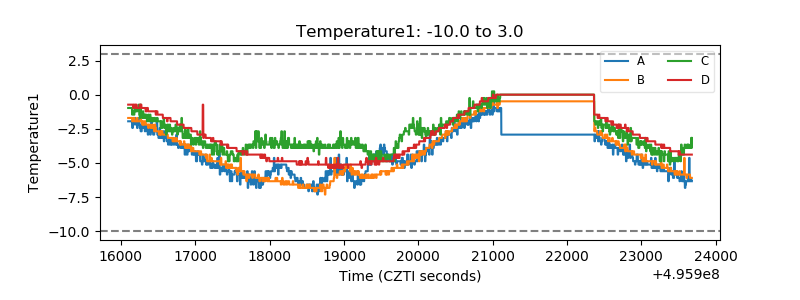 |
| Veto HV Monitor | 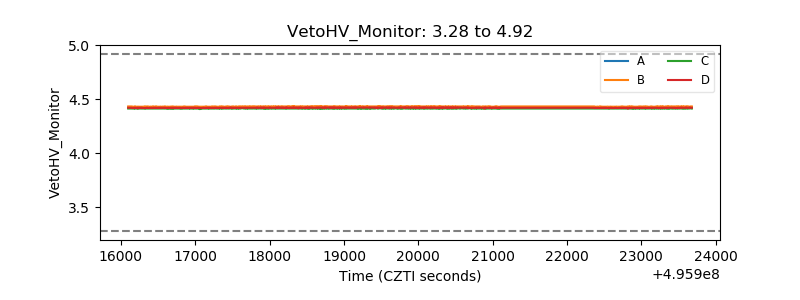 |
| Veto LLD | 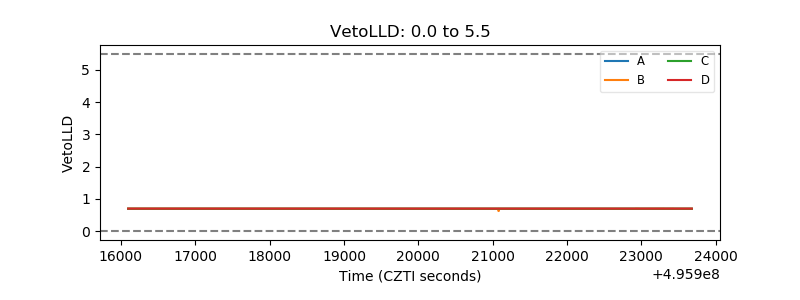 |
| Alpha Counter | 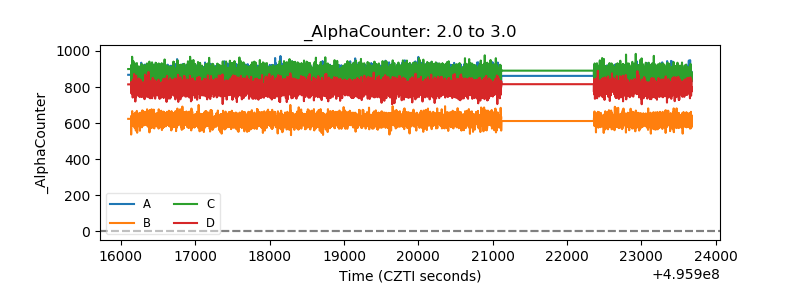 |
| _CPM_Rate | 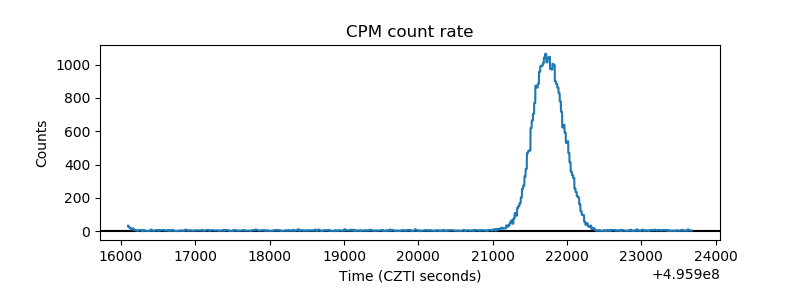 |
| CZT Counter | 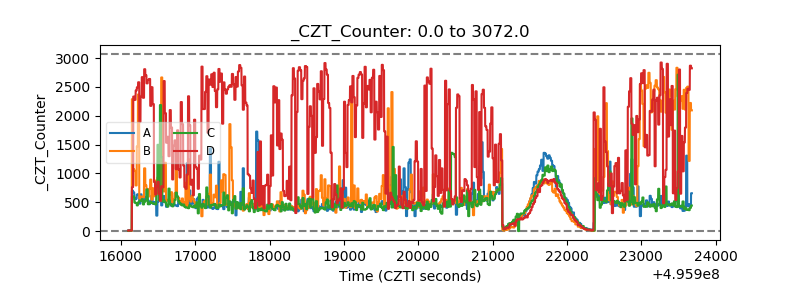 |
| +2.5 Volts monitor | 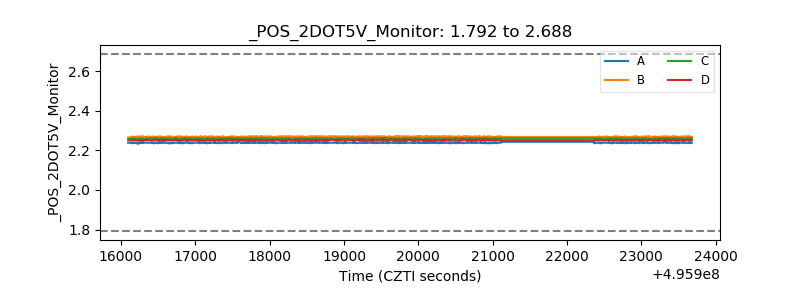 |
| +5 Volts monitor |  |
| _ROLL_ROT | 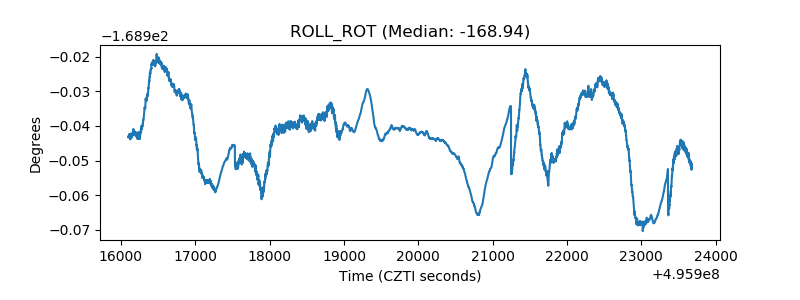 |
| _Roll_DEC | 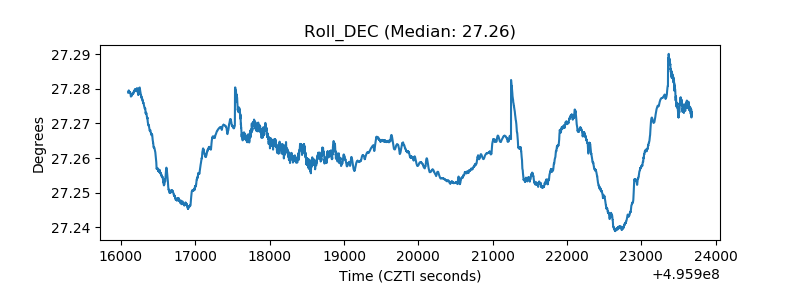 |
| _Roll_RA | 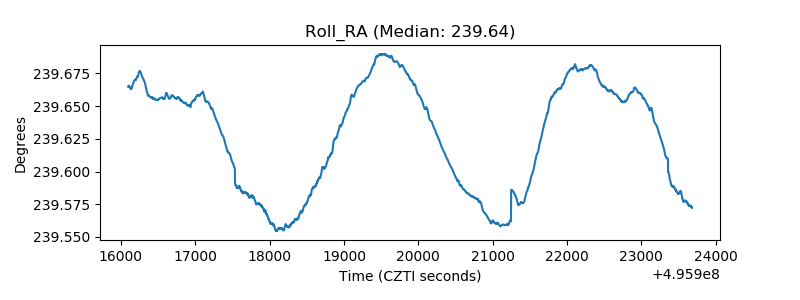 |
| Veto Counter | 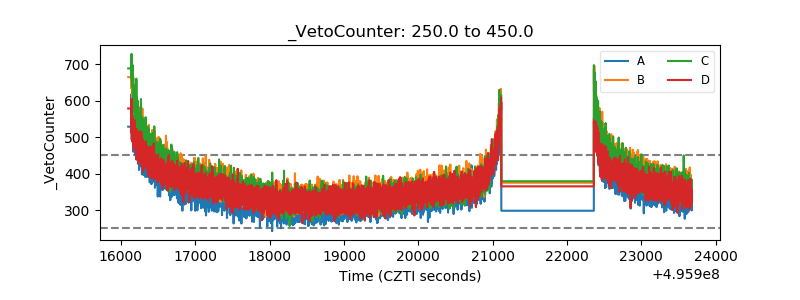 |