| Param | Original file | Final file |
|---|---|---|
| Filename | modeM0/AS1A14_057T04_9000006508_53966cztM0_level2.fits | modeM0/AS1A14_057T04_9000006508_53966cztM0_level2_quad_clean.evt |
| Size (bytes) | 670,438,080 | 91,926,720 |
| Size | 639.4 MB | 87.7 MB |
| Events in quadrant A | 3,514,672 | 670,237 |
| Events in quadrant B | 4,055,354 | 691,008 |
| Events in quadrant C | 6,364,659 | 534,766 |
| Events in quadrant D | 10,349,885 | 408,695 |
| Mode M0 | |||
|---|---|---|---|
| Quadrant | BADHDUFLAG | Total packets | Discarded packets |
| A | 0 | 15303 | 2 |
| B | 0 | 17070 | 2 |
| C | 0 | 23596 | 2 |
| D | 0 | 35554 | 2 |
| Mode SS | |||
|---|---|---|---|
| Quadrant | BADHDUFLAG | Total packets | Discarded packets |
| A | 0 | 140 | 0 |
| B | 0 | 140 | 0 |
| C | 0 | 140 | 0 |
| D | 0 | 140 | 0 |
| Mode M9 | |||
|---|---|---|---|
| Quadrant | BADHDUFLAG | Total packets | Discarded packets |
| A | 0 | 10 | 0 |
| B | 0 | 10 | 0 |
| C | 0 | 11 | 0 |
| D | 0 | 11 | 0 |
| Quadrant | Total seconds | Saturated seconds | Saturation percentage |
|---|---|---|---|
| A | 6869 | 68 | 0.989955% |
| B | 6869 | 294 | 4.280099% |
| C | 6869 | 1212 | 17.644490% |
| D | 6869 | 2443 | 35.565585% |
Noise dominated data is calculated using 1-second bins in cleaned event files. If a bin has >2000 counts, and if more than 50% of those come from <1% of pixels, then it is considered to be noise-dominated and hence unusable.
| Quadrant | # 1 sec bins | Bins with >0 counts | Bins with >2000 counts | High rate bins dominated by noise | Noise dominated (total time) | Noise dominated (detector-on time) | Marked lightcurve |
|---|---|---|---|---|---|---|---|
| A | 7899 | 6870 | 17 | 17 | 0.22% | 0.25% | 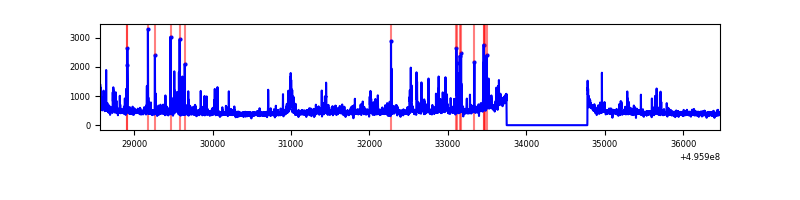 |
| B | 7899 | 6870 | 134 | 134 | 1.70% | 1.95% | 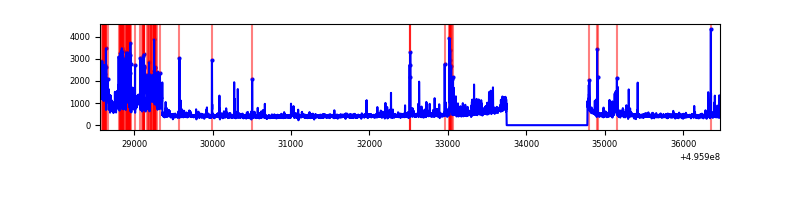 |
| C | 7899 | 6870 | 1132 | 1132 | 14.33% | 16.48% | 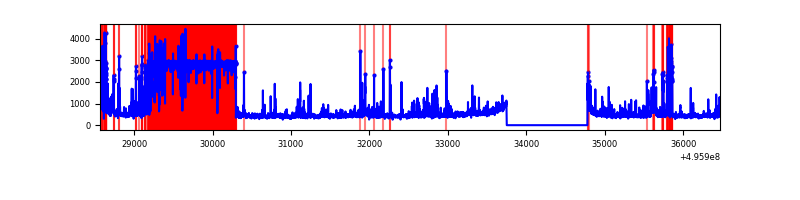 |
| D | 7899 | 6870 | 2119 | 2119 | 26.83% | 30.84% | 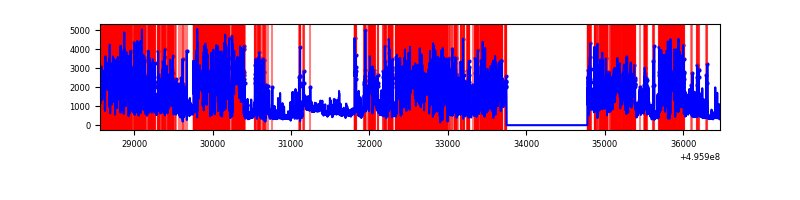 |
Top three noisy pixels from each quadrant. If the there are fewer than three noisy pixels in the level2.evt file, extra rows are filled as -1
| Pixel properties | Quadrant properties | ||||||
|---|---|---|---|---|---|---|---|
| Quadrant | DetID | PixID | Counts | Sigma | Mean | Median | Sigma |
| A | 15 | 174 | 133126 | 719.26 | 752 | 735 | 184.1 |
| A | 8 | 6 | 79897 | 430.08 | 752 | 735 | 184.1 |
| A | 8 | 248 | 63558 | 341.31 | 752 | 735 | 184.1 |
| B | 5 | 250 | 600400 | 3790.47 | 739 | 714 | 158.2 |
| B | 0 | 213 | 205413 | 1293.85 | 739 | 714 | 158.2 |
| B | 5 | 185 | 71579 | 447.92 | 739 | 714 | 158.2 |
| C | 1 | 241 | 3230003 | 17946.89 | 653 | 647 | 179.9 |
| C | 12 | 2 | 147689 | 817.17 | 653 | 647 | 179.9 |
| C | 13 | 3 | 114561 | 633.07 | 653 | 647 | 179.9 |
| D | 8 | 176 | 6097811 | 36569.02 | 583 | 558 | 166.7 |
| D | 6 | 239 | 734014 | 4398.99 | 583 | 558 | 166.7 |
| D | 2 | 165 | 507410 | 3039.91 | 583 | 558 | 166.7 |
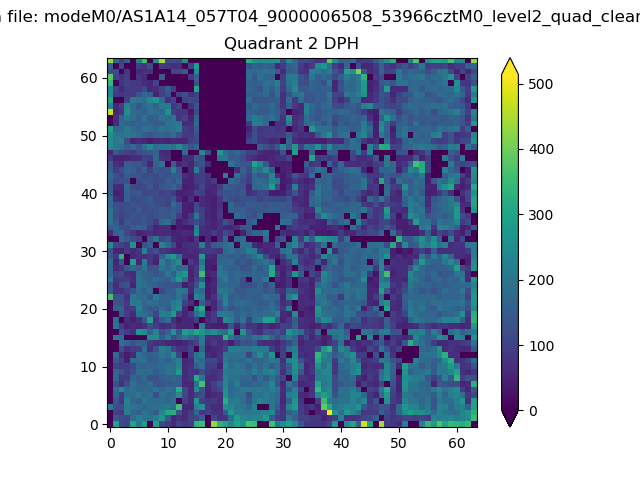
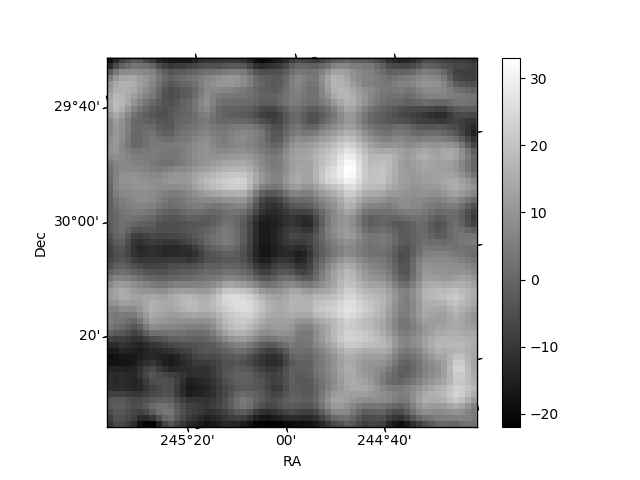
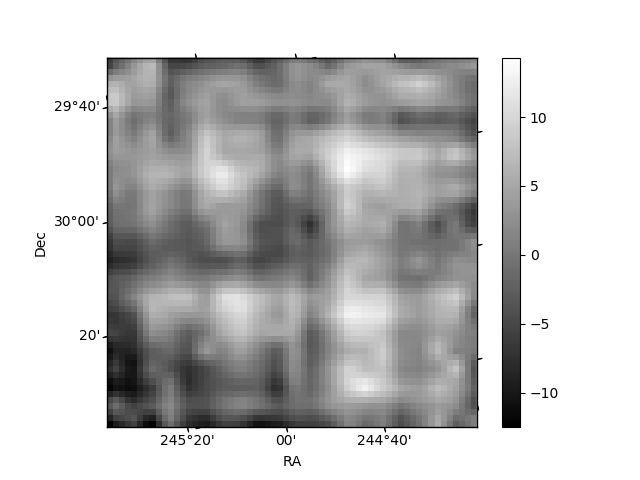
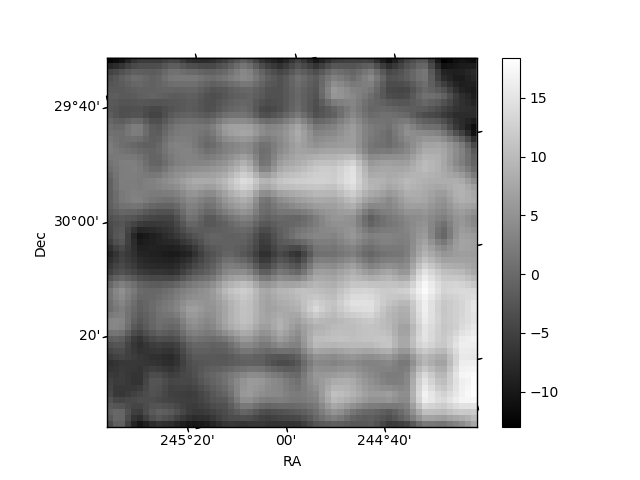
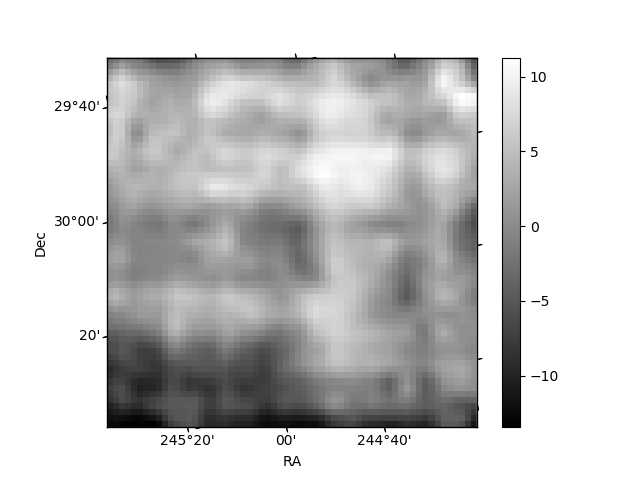
Histogram calculated using DETX and DETY for each event in the final _common_clean file
| Quadrant A | 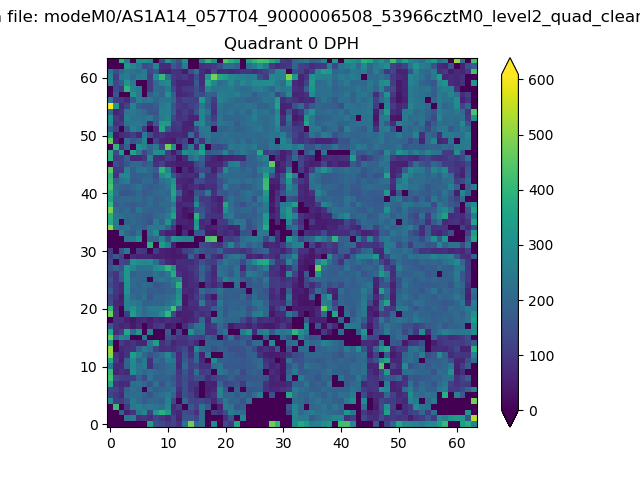 |
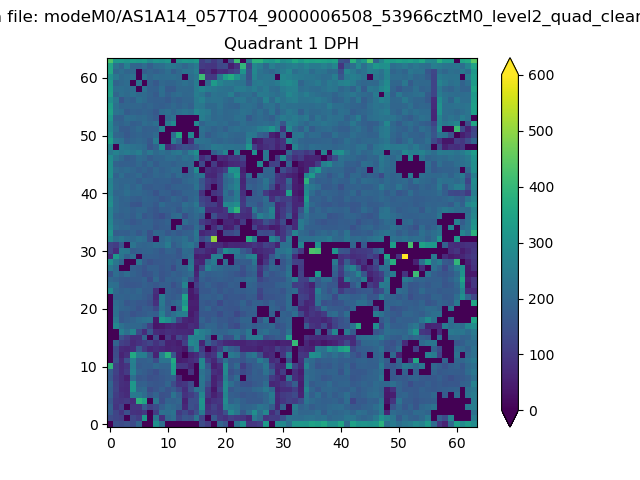 |
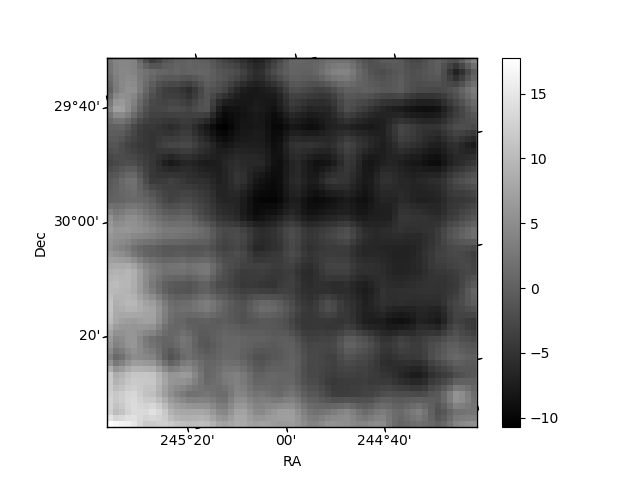
Quadrant B |
|---|---|---|---|
| Quadrant D | 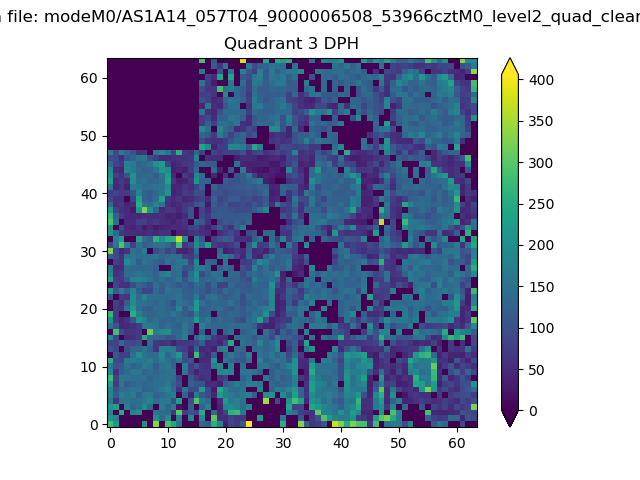 |
 |
Quadrant C |
| Plot type | Count rate plots | Images |
|---|---|---|
| Comparison with Poisson distribution Blue bars denote a histogram of data divided into 1 sec bins. Red curve is a Poisson curve with rate = median count rate of data. |
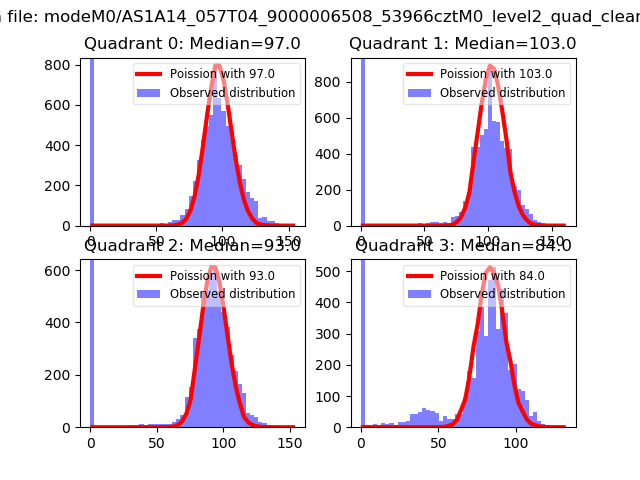 |
 |
| Quadrant-wise count rates Data is divided into 100 sec bins |
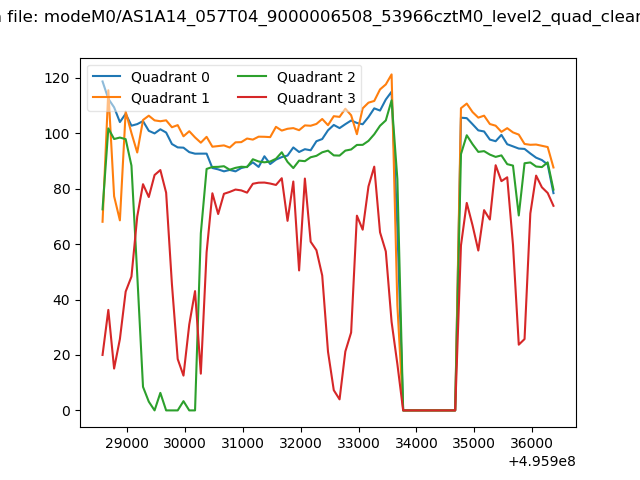 |
|
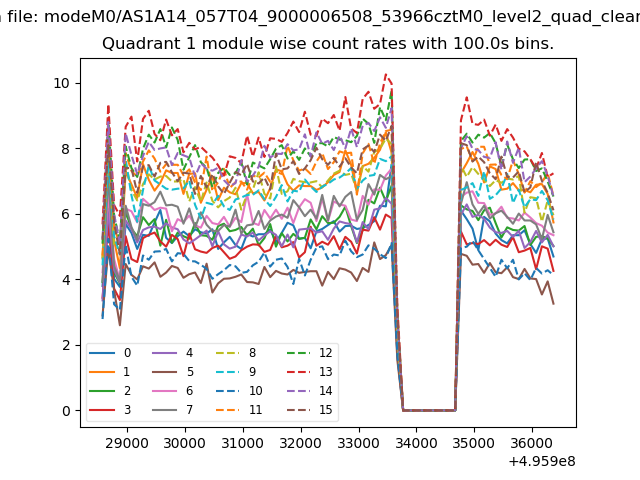
| Module-wise count rates for Quadrant A Data is divided into 100 sec bins |
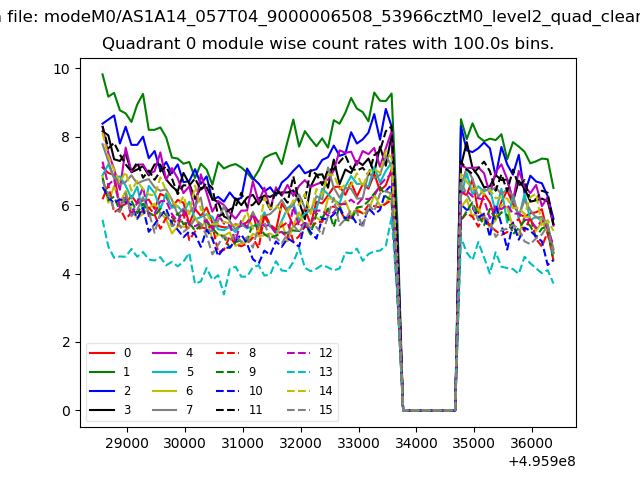 |
 |
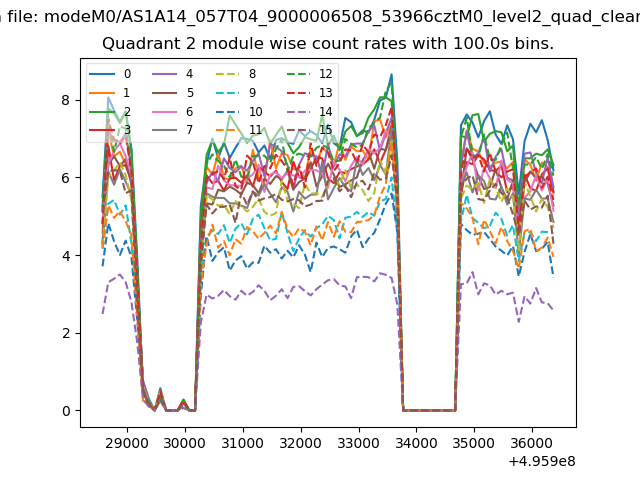
| Module-wise count rates for Quadrant B Data is divided into 100 sec bins |
 |
 |
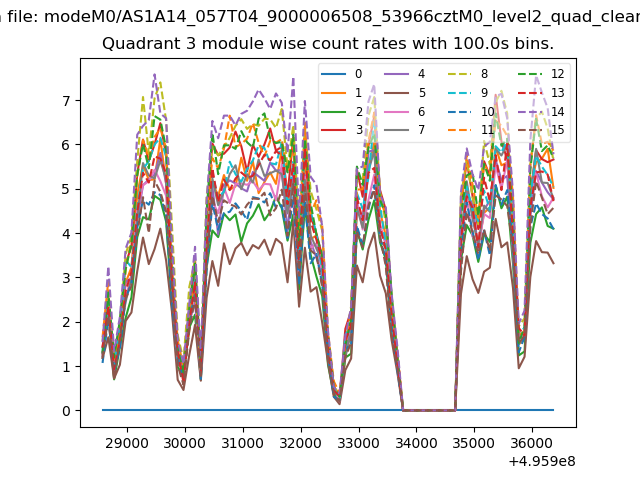
| Module-wise count rates for Quadrant C Data is divided into 100 sec bins |
 |
 |
| Module-wise count rates for Quadrant D Data is divided into 100 sec bins |
 |
 |
| Parameter | Plot |
|---|---|
| CZT HV Monitor |  |
| D_VDD | 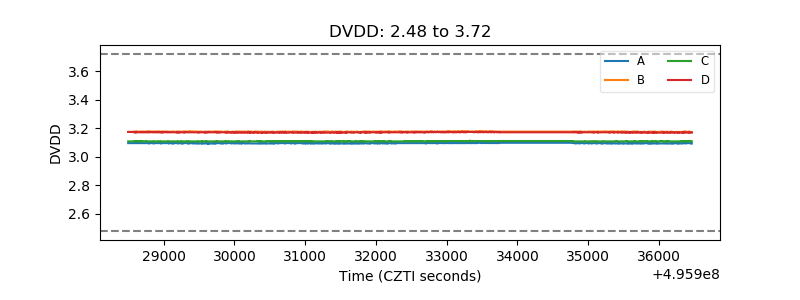 |
| Temperature 1 | 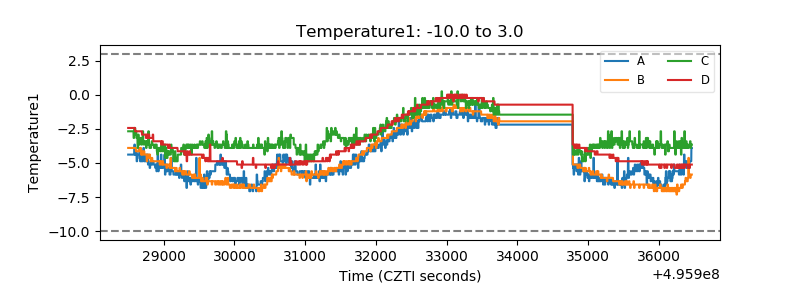 |
| Veto HV Monitor | 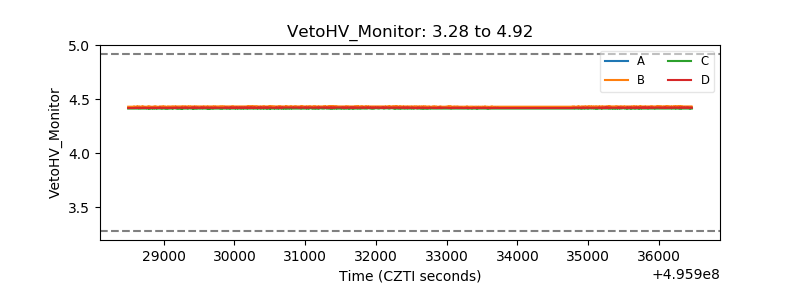 |
| Veto LLD | 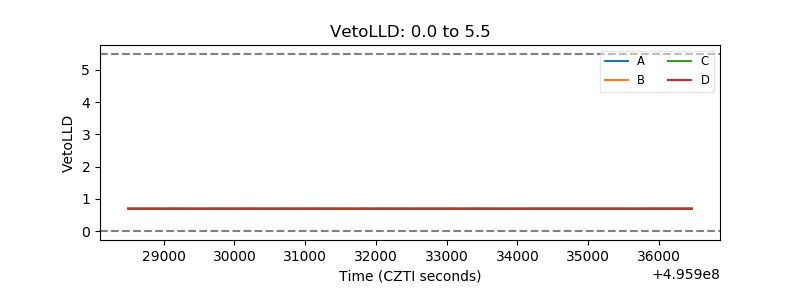 |
| Alpha Counter | 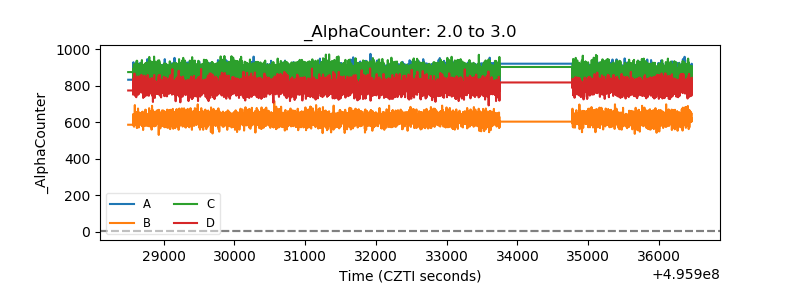 |
| _CPM_Rate | 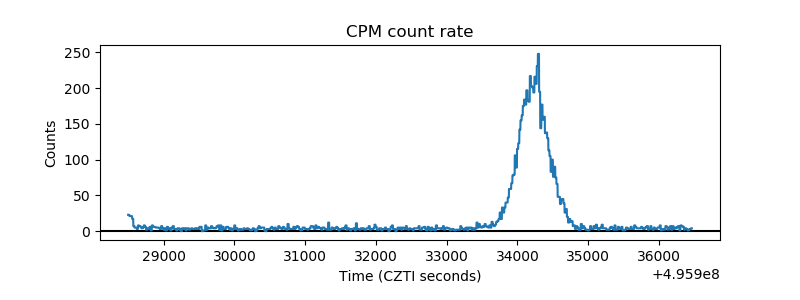 |
| CZT Counter | 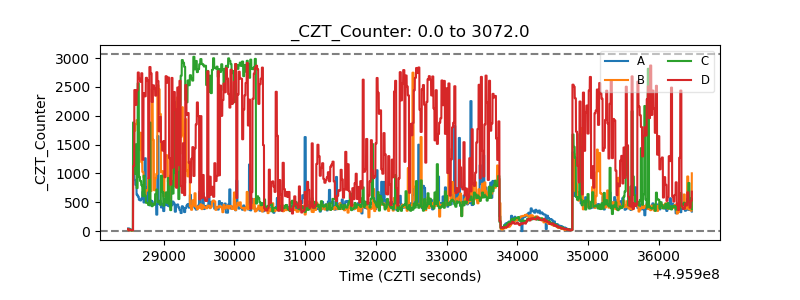 |
| +2.5 Volts monitor | 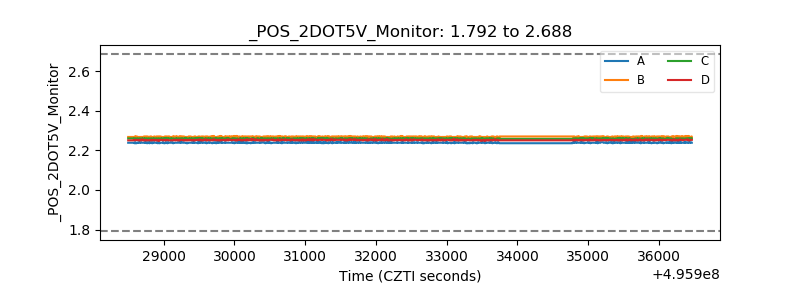 |
| +5 Volts monitor |  |
| _ROLL_ROT | 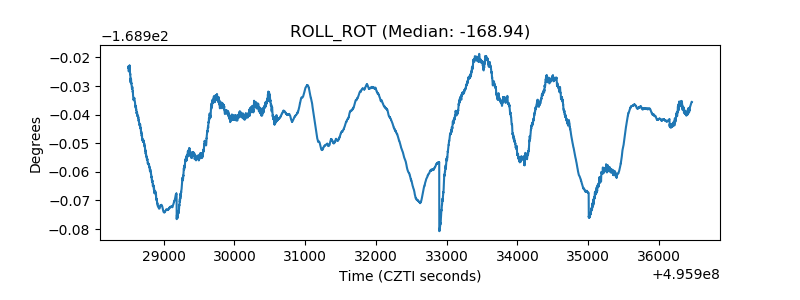 |
| _Roll_DEC | 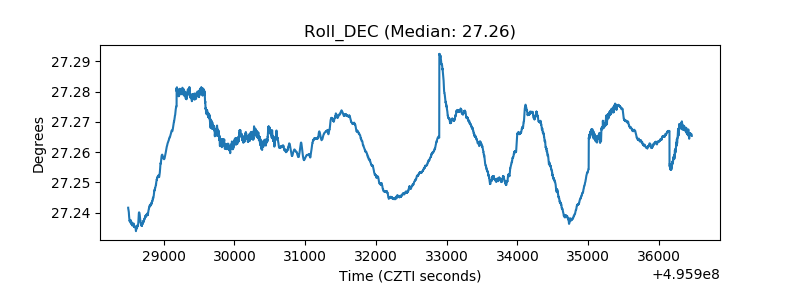 |
| _Roll_RA | 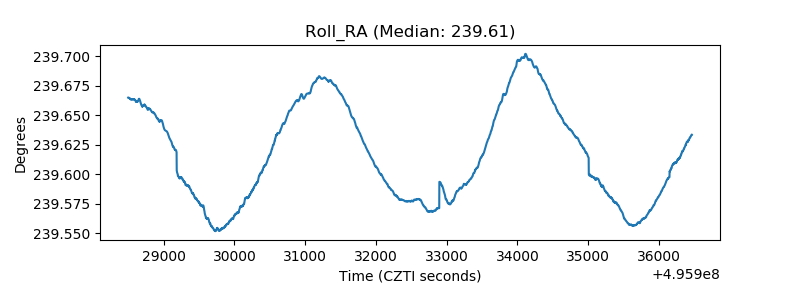 |
| Veto Counter | 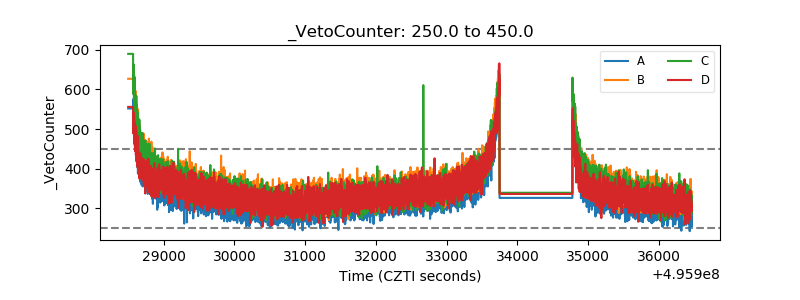 |