| Param | Original file | Final file |
|---|---|---|
| Filename | modeM0/AS1A14_057T04_9000006508_53967cztM0_level2.fits | modeM0/AS1A14_057T04_9000006508_53967cztM0_level2_quad_clean.evt |
| Size (bytes) | 565,274,880 | 99,290,880 |
| Size | 539.1 MB | 94.7 MB |
| Events in quadrant A | 3,808,352 | 657,698 |
| Events in quadrant B | 3,673,721 | 707,171 |
| Events in quadrant C | 5,635,673 | 602,440 |
| Events in quadrant D | 7,257,649 | 545,905 |
| Mode M0 | |||
|---|---|---|---|
| Quadrant | BADHDUFLAG | Total packets | Discarded packets |
| A | 0 | 16541 | 2 |
| B | 0 | 16115 | 2 |
| C | 0 | 21640 | 7 |
| D | 0 | 26519 | 2 |
| Mode SS | |||
|---|---|---|---|
| Quadrant | BADHDUFLAG | Total packets | Discarded packets |
| A | 0 | 144 | 0 |
| B | 0 | 144 | 0 |
| C | 0 | 144 | 0 |
| D | 0 | 144 | 0 |
| Mode M9 | |||
|---|---|---|---|
| Quadrant | BADHDUFLAG | Total packets | Discarded packets |
| A | 0 | 7 | 0 |
| B | 0 | 8 | 0 |
| C | 0 | 8 | 0 |
| D | 0 | 8 | 0 |
| Quadrant | Total seconds | Saturated seconds | Saturation percentage |
|---|---|---|---|
| A | 7078 | 221 | 3.122351% |
| B | 7078 | 211 | 2.981068% |
| C | 7077 | 576 | 8.139042% |
| D | 7077 | 997 | 14.087890% |
Noise dominated data is calculated using 1-second bins in cleaned event files. If a bin has >2000 counts, and if more than 50% of those come from <1% of pixels, then it is considered to be noise-dominated and hence unusable.
| Quadrant | # 1 sec bins | Bins with >0 counts | Bins with >2000 counts | High rate bins dominated by noise | Noise dominated (total time) | Noise dominated (detector-on time) | Marked lightcurve |
|---|---|---|---|---|---|---|---|
| A | 7753 | 7079 | 132 | 132 | 1.70% | 1.86% | 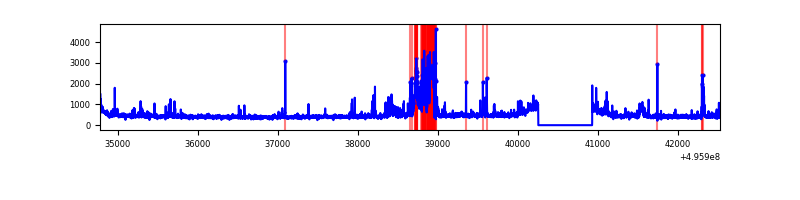 |
| B | 7753 | 7079 | 64 | 64 | 0.83% | 0.90% | 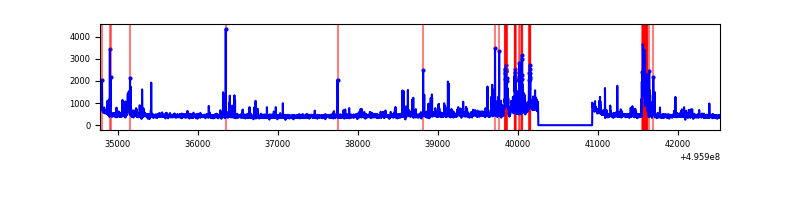 |
| C | 7752 | 7078 | 523 | 523 | 6.75% | 7.39% | 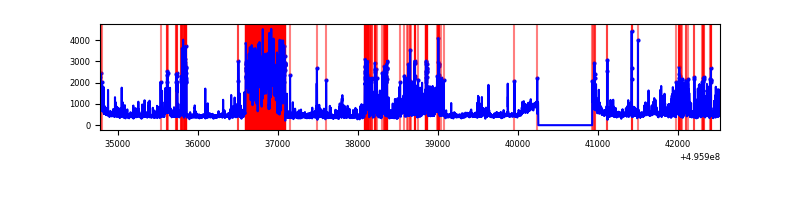 |
| D | 7752 | 7078 | 846 | 846 | 10.91% | 11.95% | 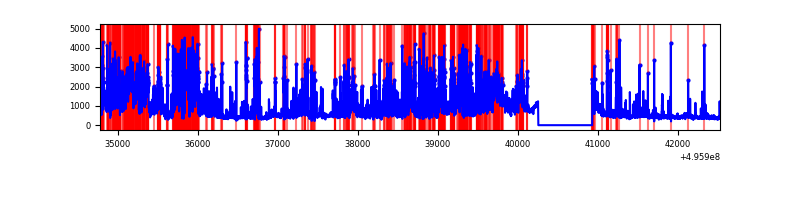 |
Top three noisy pixels from each quadrant. If the there are fewer than three noisy pixels in the level2.evt file, extra rows are filled as -1
| Pixel properties | Quadrant properties | ||||||
|---|---|---|---|---|---|---|---|
| Quadrant | DetID | PixID | Counts | Sigma | Mean | Median | Sigma |
| A | 15 | 174 | 429333 | 2252.96 | 769 | 751 | 190.2 |
| A | 7 | 14 | 117435 | 613.38 | 769 | 751 | 190.2 |
| A | 12 | 17 | 77367 | 402.75 | 769 | 751 | 190.2 |
| B | 5 | 185 | 145535 | 885.86 | 766 | 739 | 163.5 |
| B | 4 | 171 | 125096 | 760.82 | 766 | 739 | 163.5 |
| B | 0 | 213 | 113923 | 692.46 | 766 | 739 | 163.5 |
| C | 1 | 241 | 1635270 | 8049.57 | 735 | 729 | 203.1 |
| C | 9 | 38 | 646577 | 3180.58 | 735 | 729 | 203.1 |
| C | 12 | 249 | 97526 | 476.69 | 735 | 729 | 203.1 |
| D | 8 | 176 | 2741733 | 13685.87 | 707 | 678 | 200.3 |
| D | 6 | 239 | 681375 | 3398.67 | 707 | 678 | 200.3 |
| D | 2 | 165 | 294048 | 1464.77 | 707 | 678 | 200.3 |
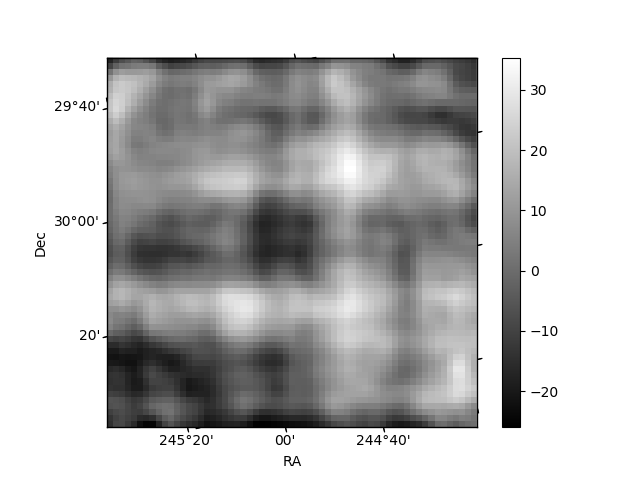
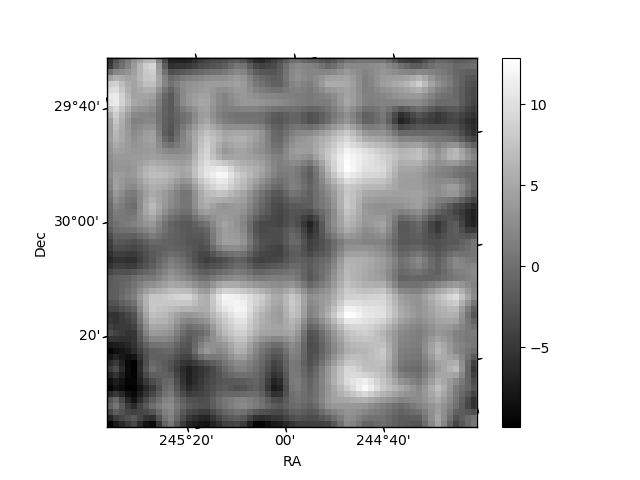
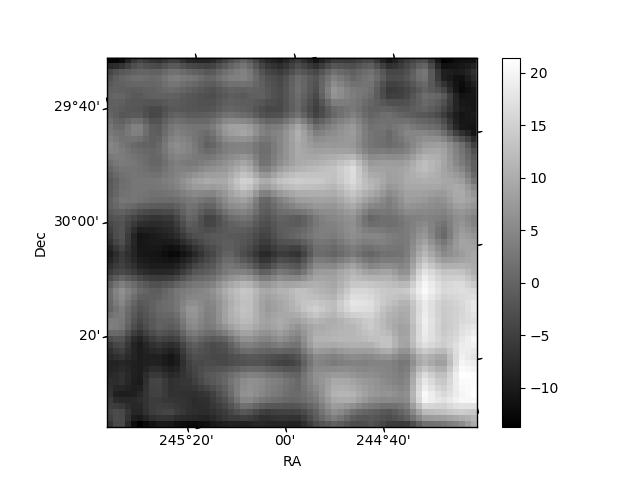
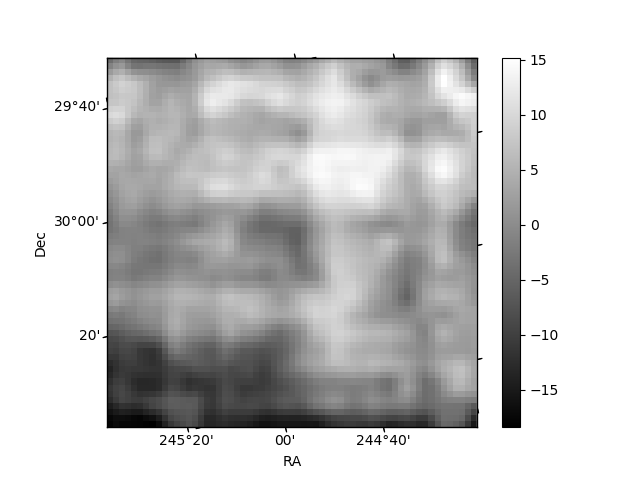
Histogram calculated using DETX and DETY for each event in the final _common_clean file
| Quadrant A | 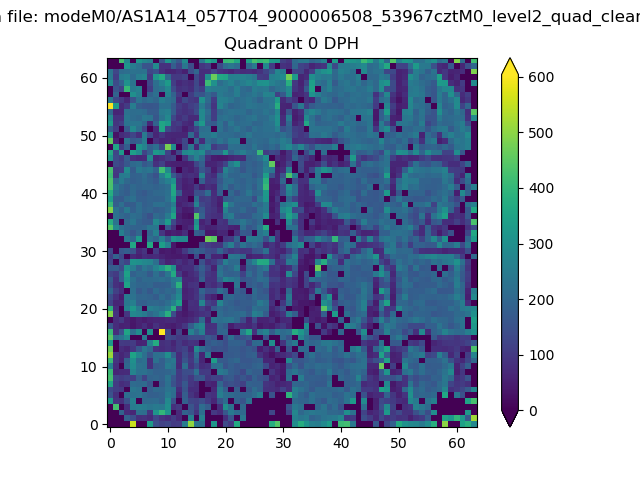 |
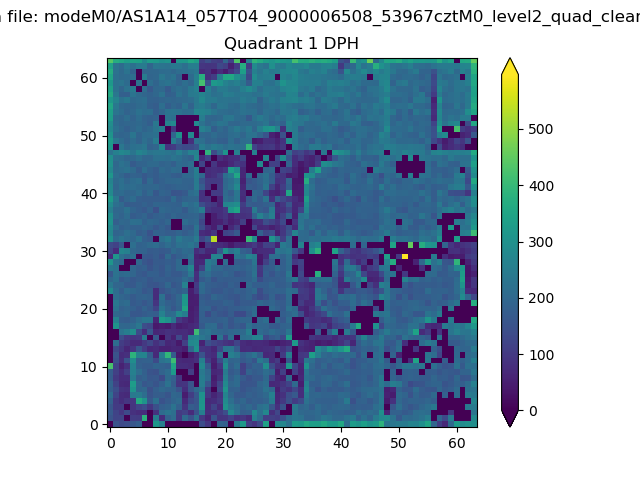 |
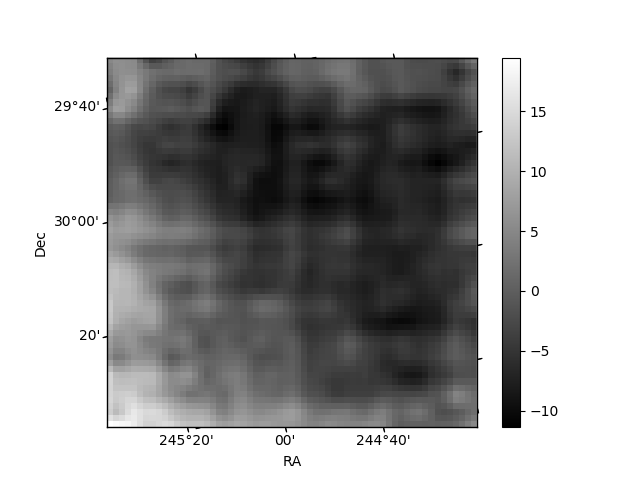
Quadrant B |
|---|---|---|---|
| Quadrant D | 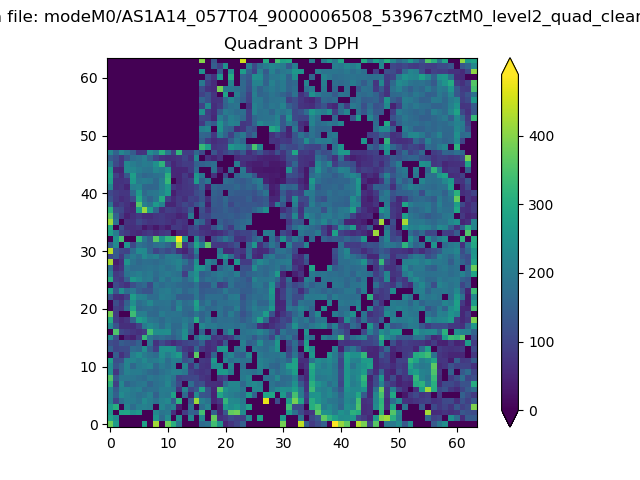 |
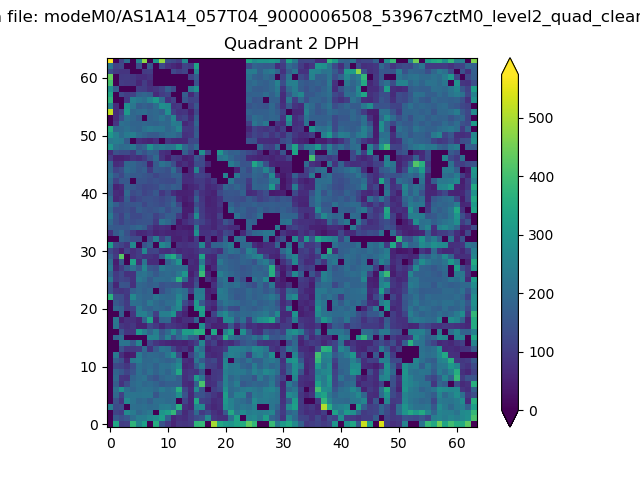 |
Quadrant C |
| Plot type | Count rate plots | Images |
|---|---|---|
| Comparison with Poisson distribution Blue bars denote a histogram of data divided into 1 sec bins. Red curve is a Poisson curve with rate = median count rate of data. |
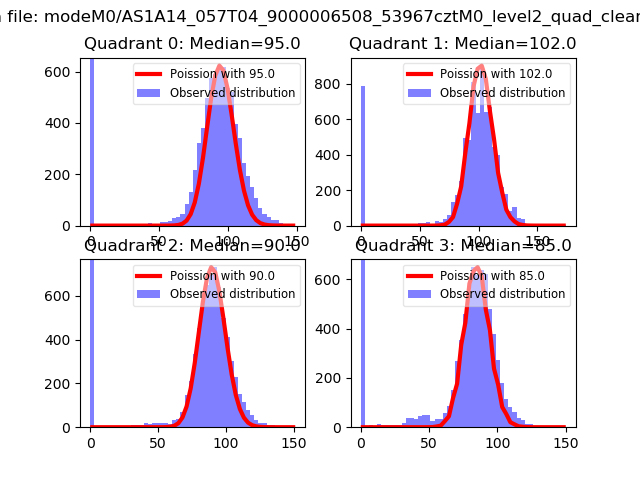 |
 |
| Quadrant-wise count rates Data is divided into 100 sec bins |
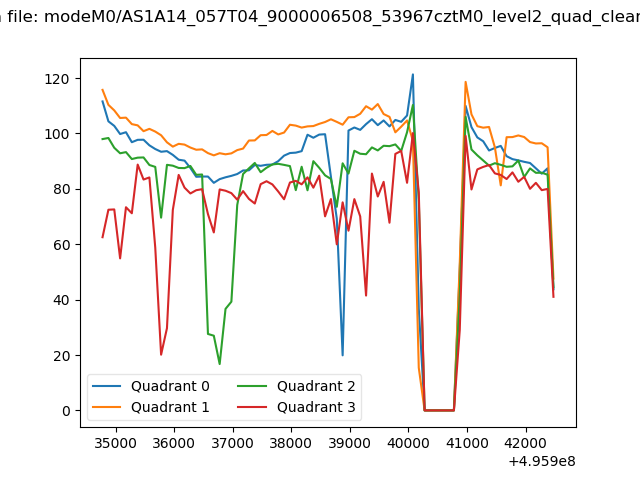 |
|
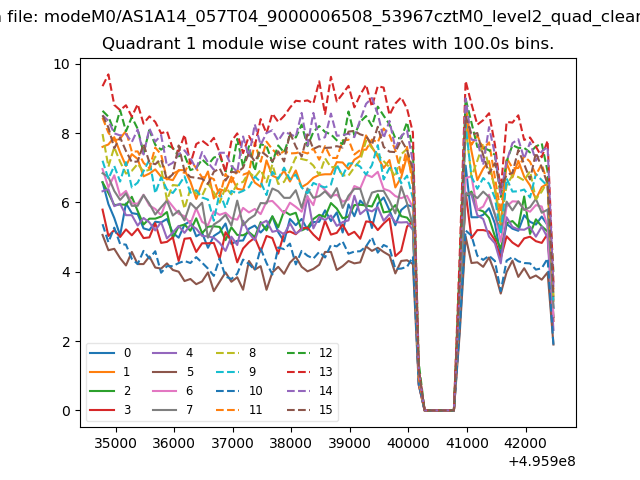
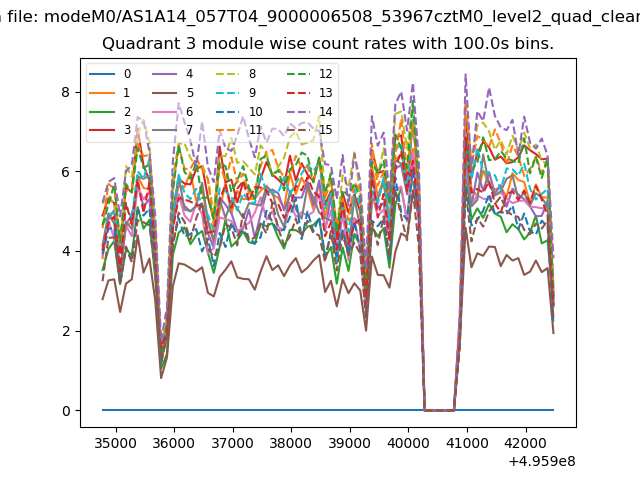
| Module-wise count rates for Quadrant A Data is divided into 100 sec bins |
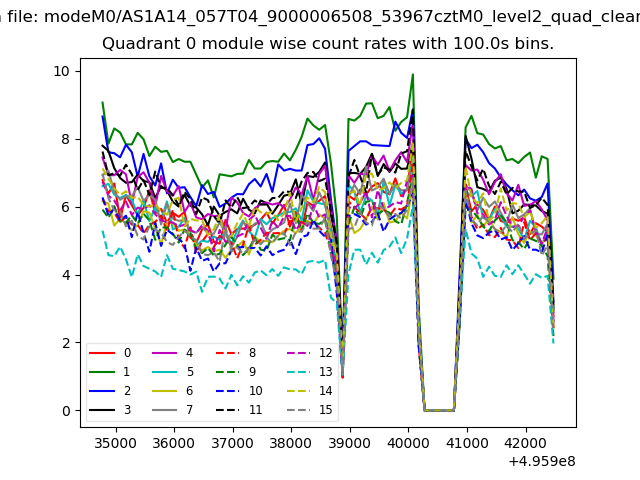 |
 |
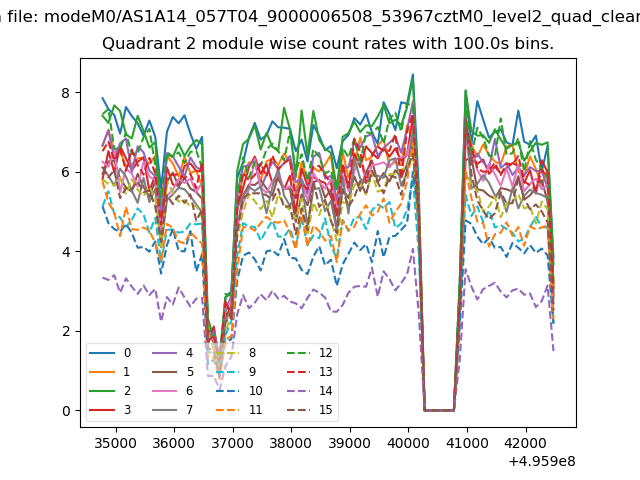
| Module-wise count rates for Quadrant B Data is divided into 100 sec bins |
 |
 |
| Module-wise count rates for Quadrant C Data is divided into 100 sec bins |
 |
 |
| Module-wise count rates for Quadrant D Data is divided into 100 sec bins |
 |
 |
| Parameter | Plot |
|---|---|
| CZT HV Monitor | 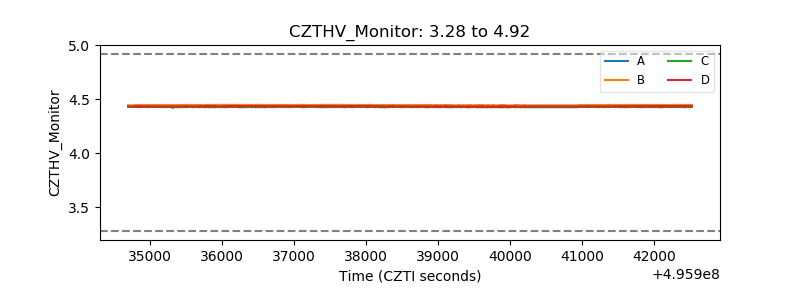 |
| D_VDD | 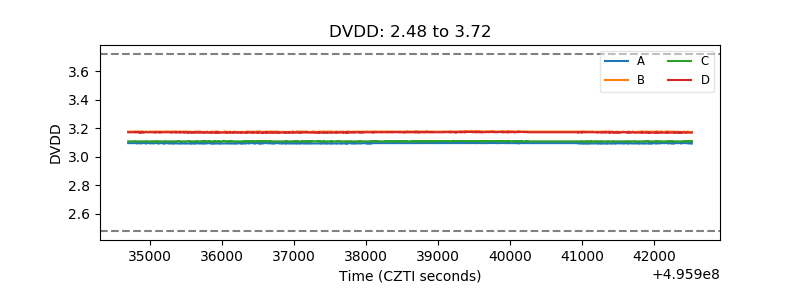 |
| Temperature 1 | 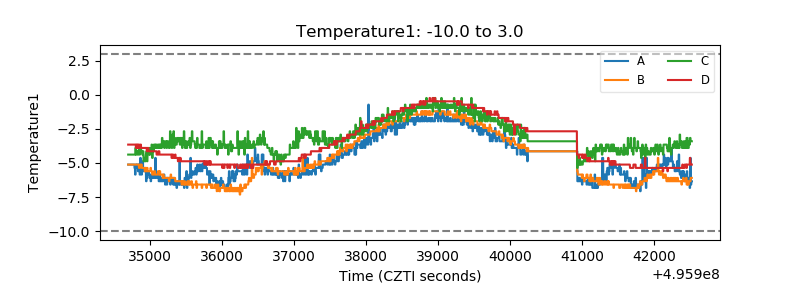 |
| Veto HV Monitor | 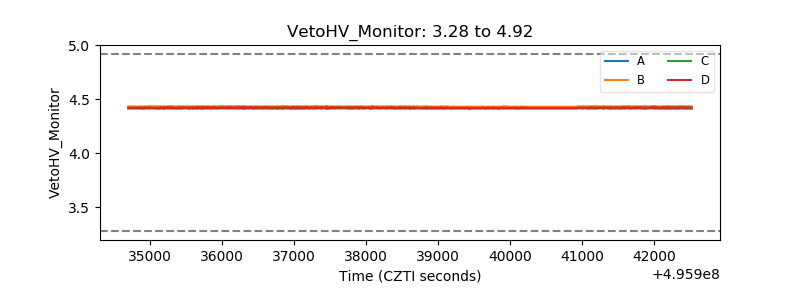 |
| Veto LLD | 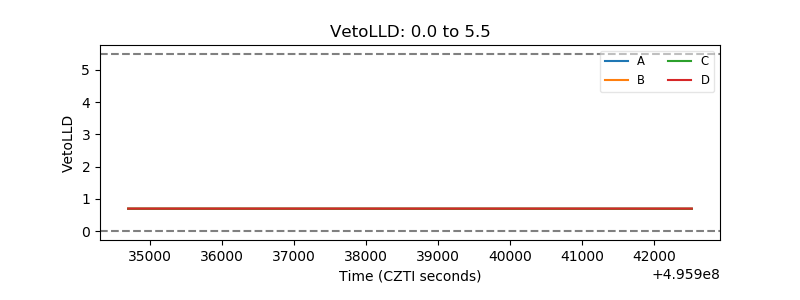 |
| Alpha Counter | 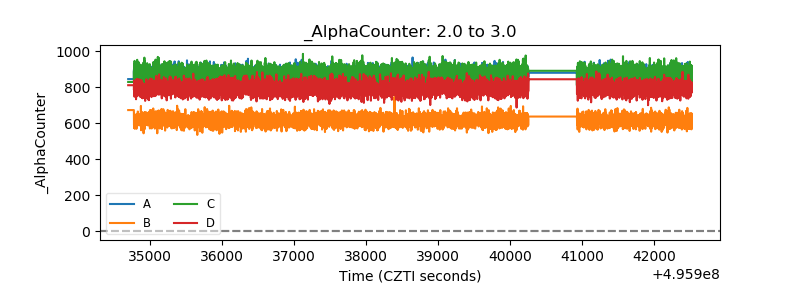 |
| _CPM_Rate | 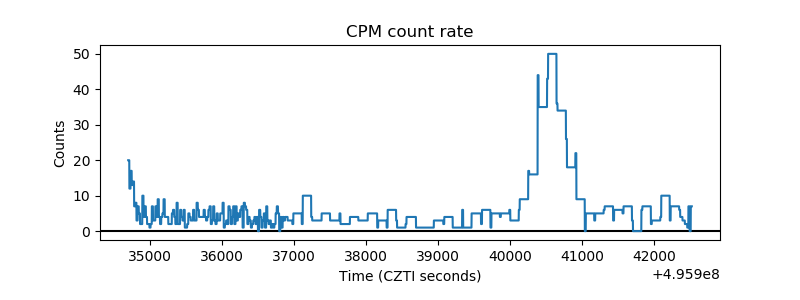 |
| CZT Counter | 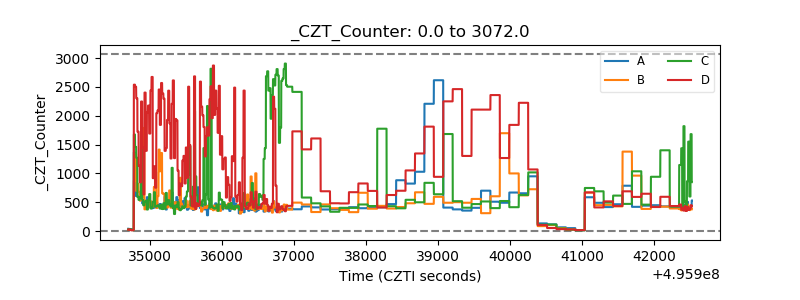 |
| +2.5 Volts monitor | 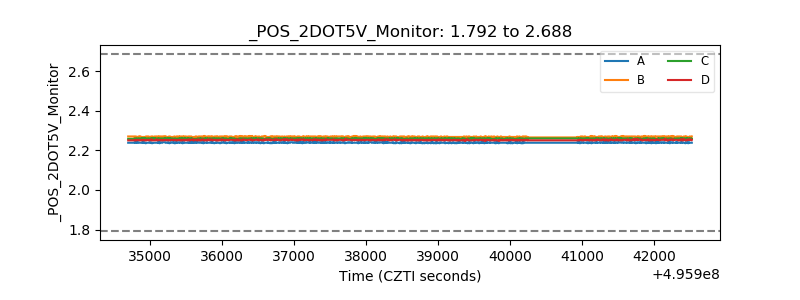 |
| +5 Volts monitor | 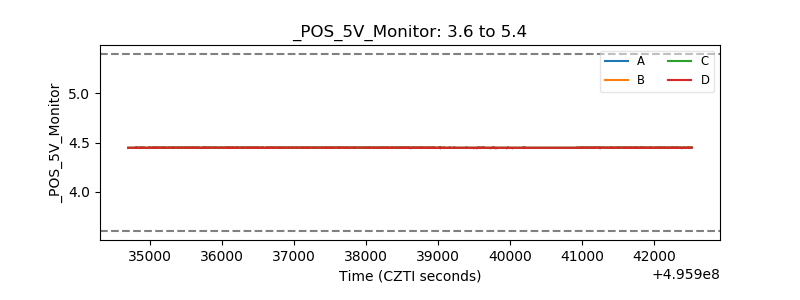 |
| _ROLL_ROT | 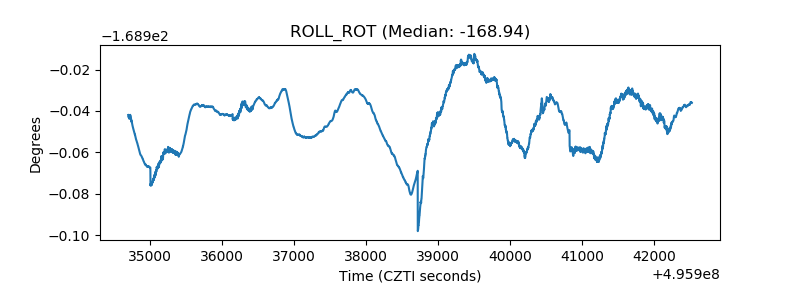 |
| _Roll_DEC | 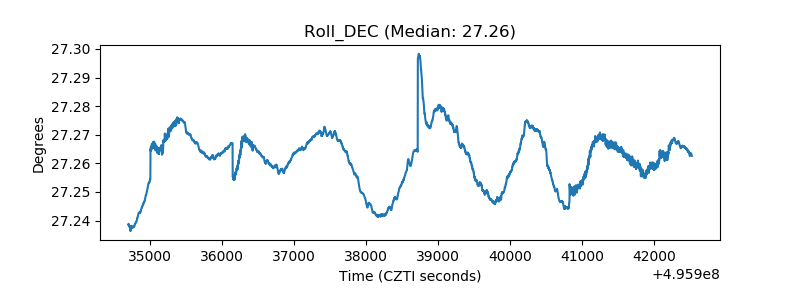 |
| _Roll_RA | 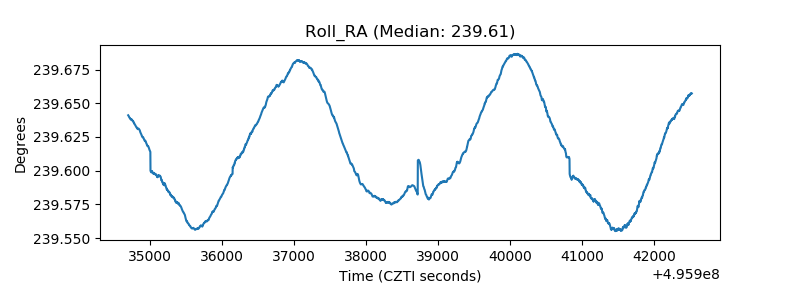 |
| Veto Counter | 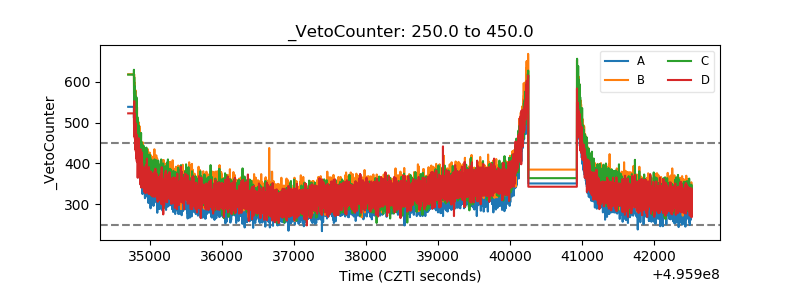 |