| Param | Original file | Final file |
|---|---|---|
| Filename | modeM0/AS1A14_057T04_9000006508_53968cztM0_level2.fits | modeM0/AS1A14_057T04_9000006508_53968cztM0_level2_quad_clean.evt |
| Size (bytes) | 530,712,000 | 103,965,120 |
| Size | 506.1 MB | 99.1 MB |
| Events in quadrant A | 3,690,509 | 694,550 |
| Events in quadrant B | 3,977,782 | 723,557 |
| Events in quadrant C | 5,101,208 | 626,652 |
| Events in quadrant D | 6,303,789 | 590,648 |
| Mode M0 | |||
|---|---|---|---|
| Quadrant | BADHDUFLAG | Total packets | Discarded packets |
| A | 0 | 16307 | 0 |
| B | 0 | 17036 | 0 |
| C | 0 | 20446 | 0 |
| D | 0 | 23958 | 0 |
| Mode SS | |||
|---|---|---|---|
| Quadrant | BADHDUFLAG | Total packets | Discarded packets |
| A | 0 | 146 | 0 |
| B | 0 | 146 | 0 |
| C | 0 | 146 | 0 |
| D | 0 | 146 | 0 |
| Quadrant | Total seconds | Saturated seconds | Saturation percentage |
|---|---|---|---|
| A | 7367 | 93 | 1.262386% |
| B | 7368 | 282 | 3.827362% |
| C | 7367 | 474 | 6.434098% |
| D | 7367 | 653 | 8.863852% |
Noise dominated data is calculated using 1-second bins in cleaned event files. If a bin has >2000 counts, and if more than 50% of those come from <1% of pixels, then it is considered to be noise-dominated and hence unusable.
| Quadrant | # 1 sec bins | Bins with >0 counts | Bins with >2000 counts | High rate bins dominated by noise | Noise dominated (total time) | Noise dominated (detector-on time) | Marked lightcurve |
|---|---|---|---|---|---|---|---|
| A | 7367 | 7367 | 23 | 23 | 0.31% | 0.31% | 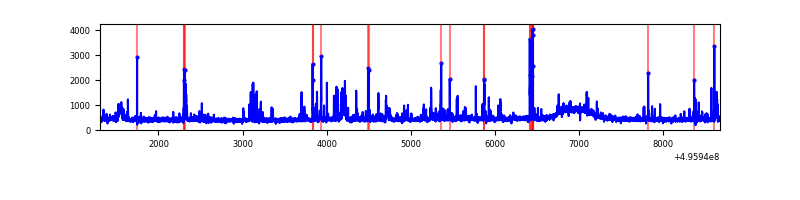 |
| B | 7368 | 7368 | 75 | 75 | 1.02% | 1.02% | 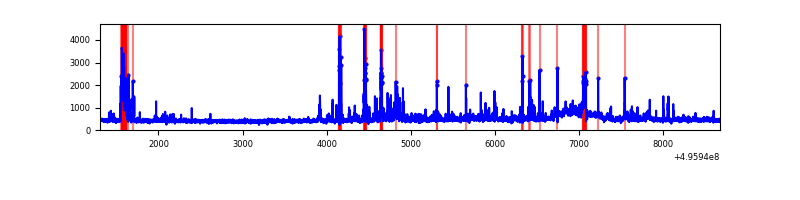 |
| C | 7367 | 7367 | 164 | 164 | 2.23% | 2.23% | 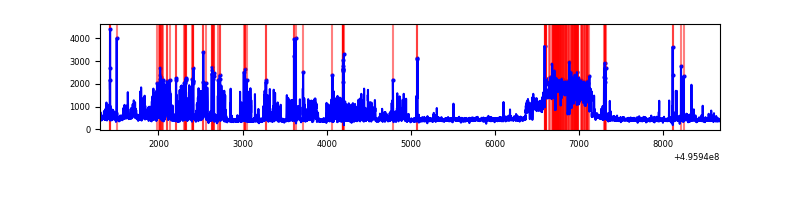 |
| D | 7367 | 7367 | 474 | 474 | 6.43% | 6.43% | 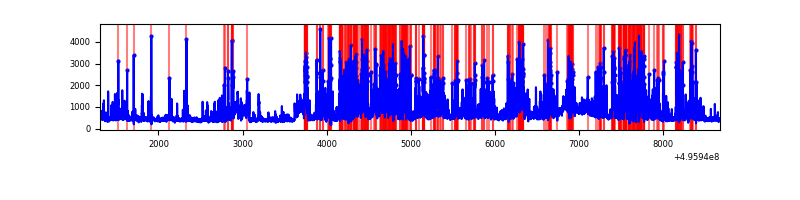 |
Top three noisy pixels from each quadrant. If the there are fewer than three noisy pixels in the level2.evt file, extra rows are filled as -1
| Pixel properties | Quadrant properties | ||||||
|---|---|---|---|---|---|---|---|
| Quadrant | DetID | PixID | Counts | Sigma | Mean | Median | Sigma |
| A | 12 | 17 | 197753 | 980.53 | 814 | 791 | 200.9 |
| A | 7 | 14 | 81806 | 403.32 | 814 | 791 | 200.9 |
| A | 15 | 174 | 60905 | 299.26 | 814 | 791 | 200.9 |
| B | 5 | 185 | 202343 | 1171.48 | 802 | 772 | 172.1 |
| B | 5 | 250 | 147678 | 853.78 | 802 | 772 | 172.1 |
| B | 0 | 213 | 112127 | 647.16 | 802 | 772 | 172.1 |
| C | 9 | 38 | 886699 | 4164.13 | 779 | 774 | 212.8 |
| C | 4 | 5 | 789753 | 3708.45 | 779 | 774 | 212.8 |
| C | 12 | 2 | 151913 | 710.4 | 779 | 774 | 212.8 |
| D | 8 | 176 | 1599486 | 7455.96 | 763 | 731 | 214.4 |
| D | 6 | 239 | 789196 | 3677.09 | 763 | 731 | 214.4 |
| D | 2 | 172 | 535368 | 2493.34 | 763 | 731 | 214.4 |
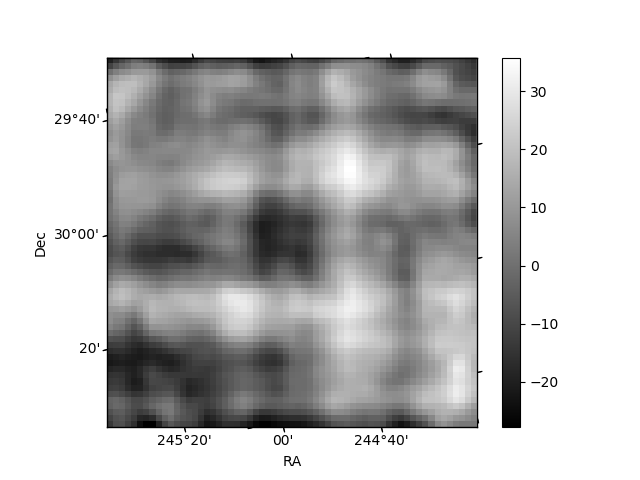
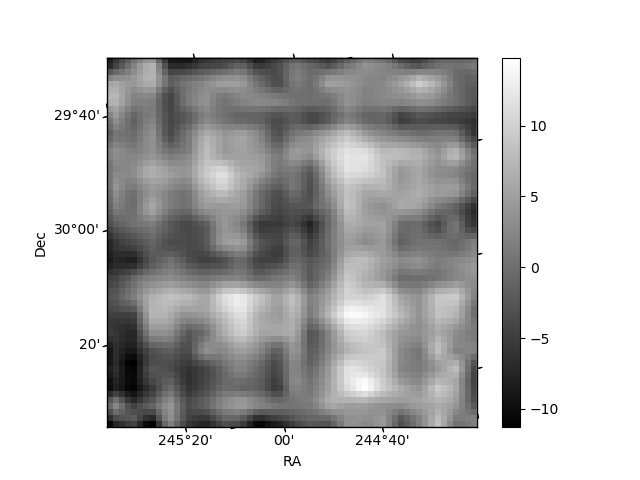
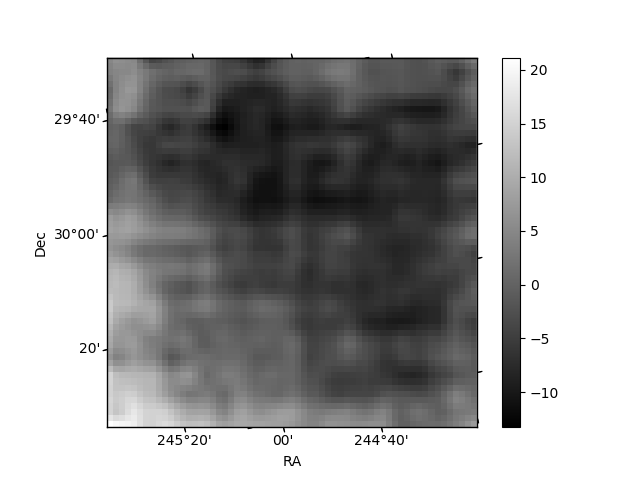
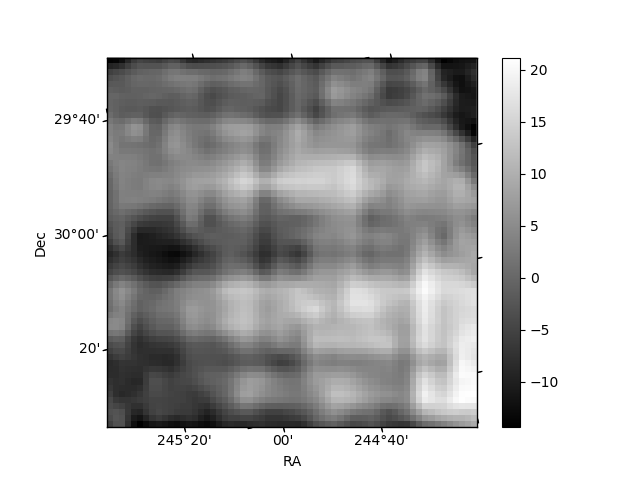
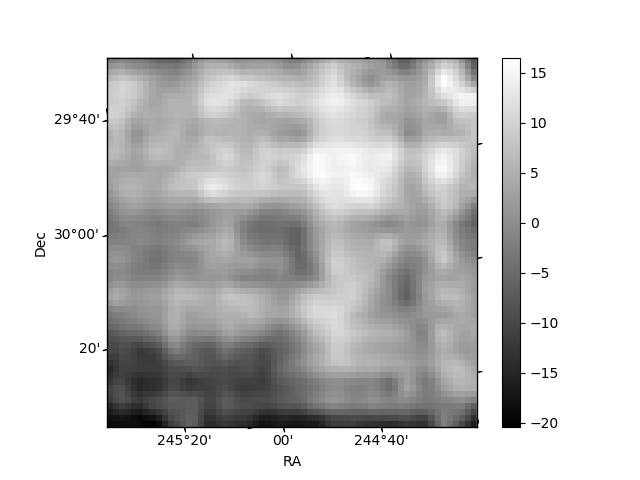
Histogram calculated using DETX and DETY for each event in the final _common_clean file
| Quadrant A | 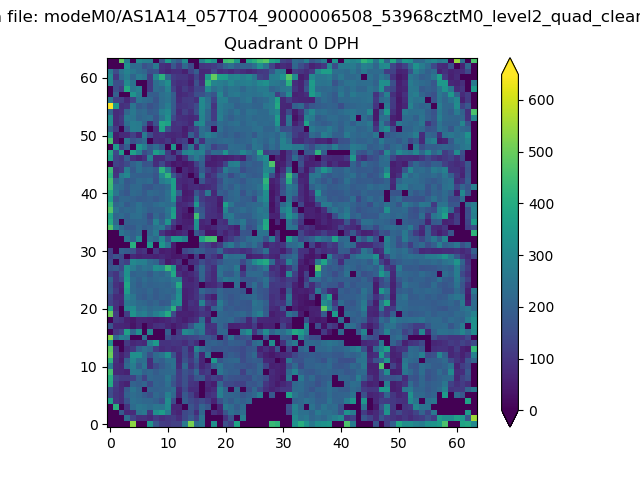 |
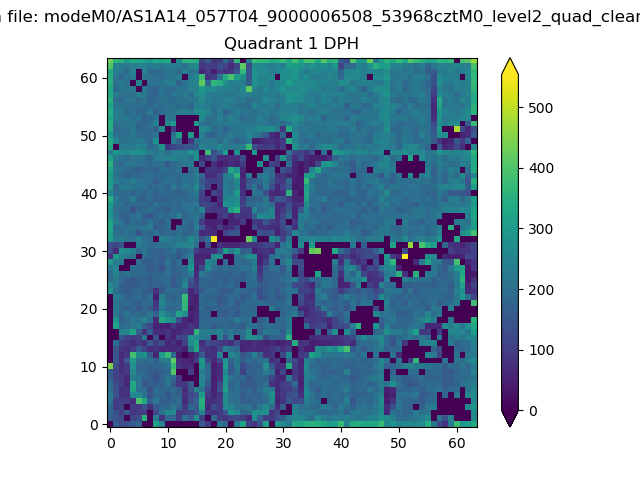 |
Quadrant B |
|---|---|---|---|
| Quadrant D | 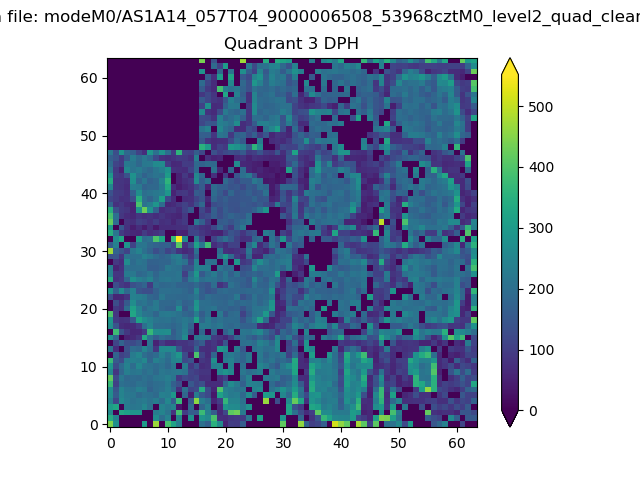 |
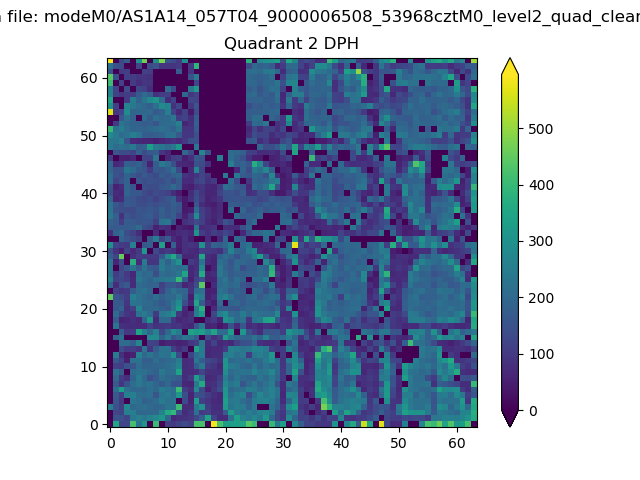 |
Quadrant C |
| Plot type | Count rate plots | Images |
|---|---|---|
| Comparison with Poisson distribution Blue bars denote a histogram of data divided into 1 sec bins. Red curve is a Poisson curve with rate = median count rate of data. |
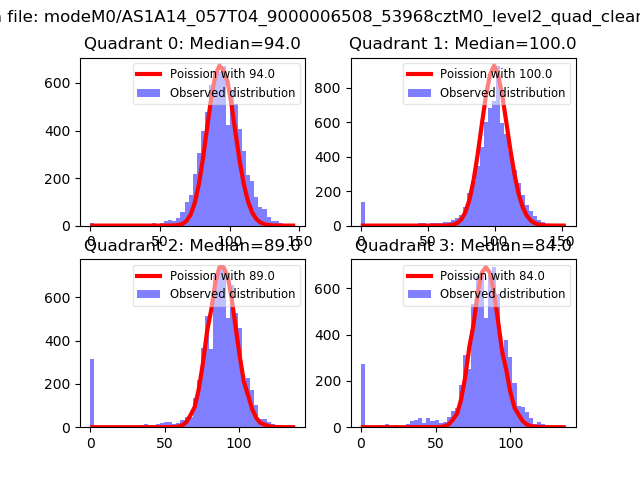 |
 |
| Quadrant-wise count rates Data is divided into 100 sec bins |
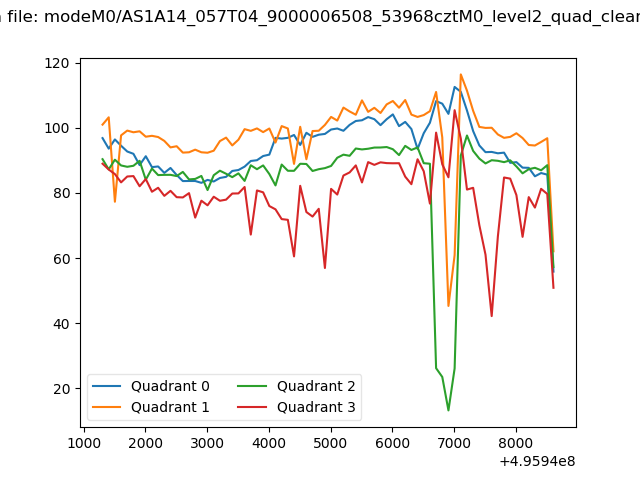 |
|
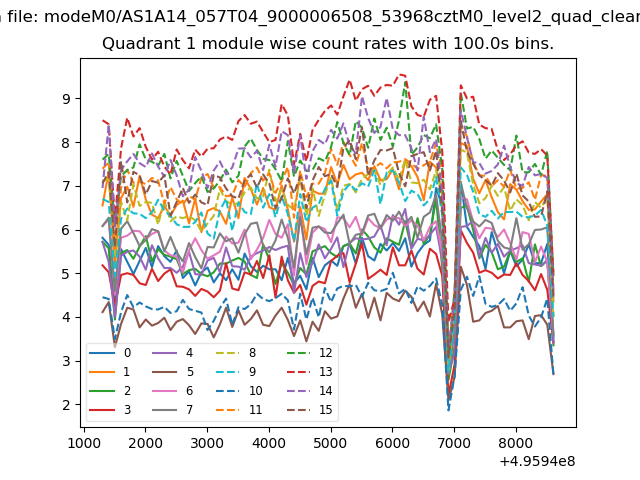
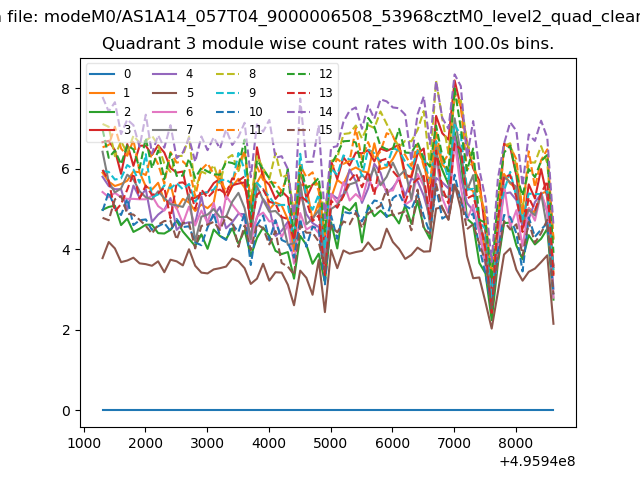
| Module-wise count rates for Quadrant A Data is divided into 100 sec bins |
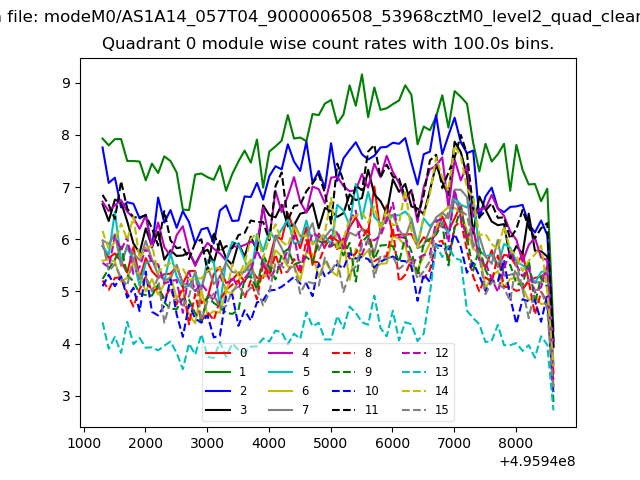 |
 |
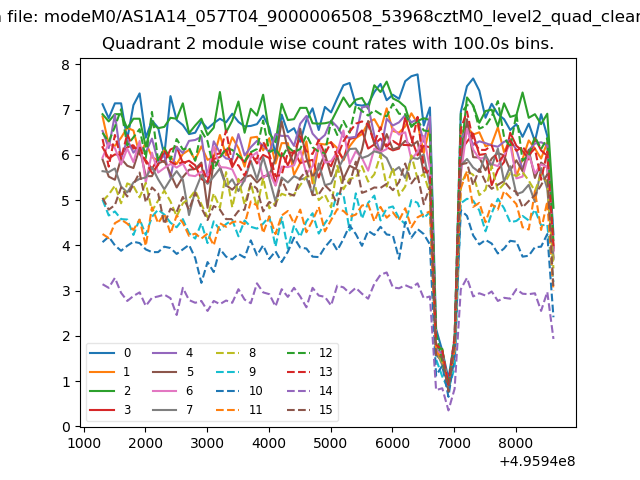
| Module-wise count rates for Quadrant B Data is divided into 100 sec bins |
 |
 |
| Module-wise count rates for Quadrant C Data is divided into 100 sec bins |
 |
 |
| Module-wise count rates for Quadrant D Data is divided into 100 sec bins |
 |
 |
| Parameter | Plot |
|---|---|
| CZT HV Monitor | 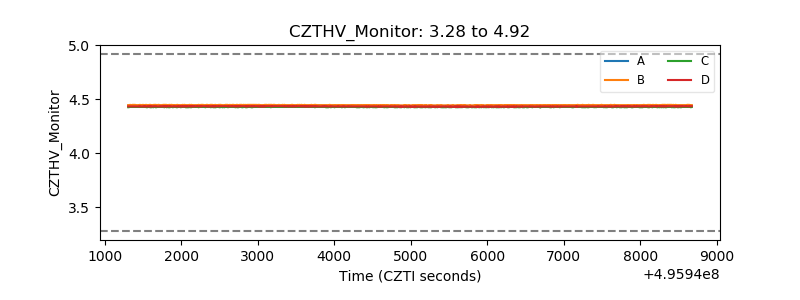 |
| D_VDD | 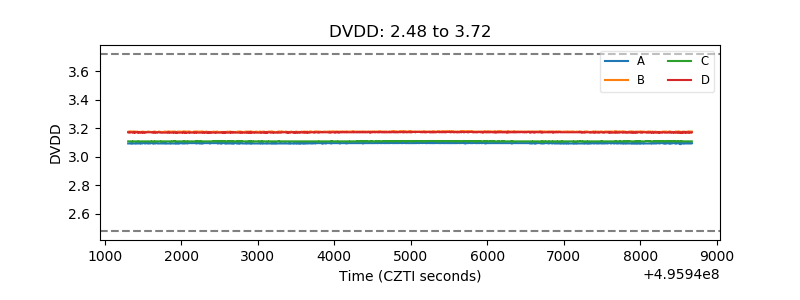 |
| Temperature 1 | 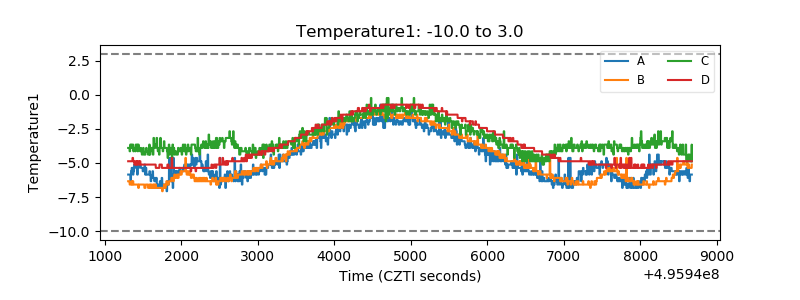 |
| Veto HV Monitor | 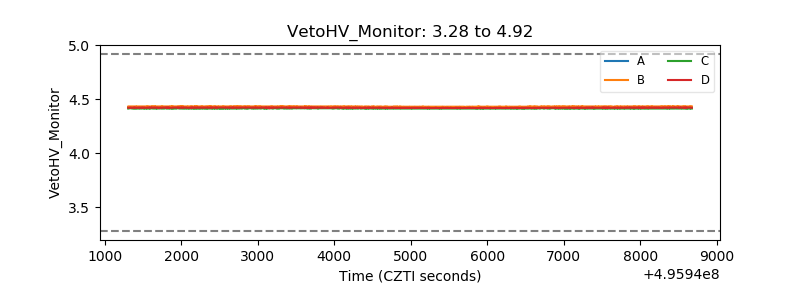 |
| Veto LLD | 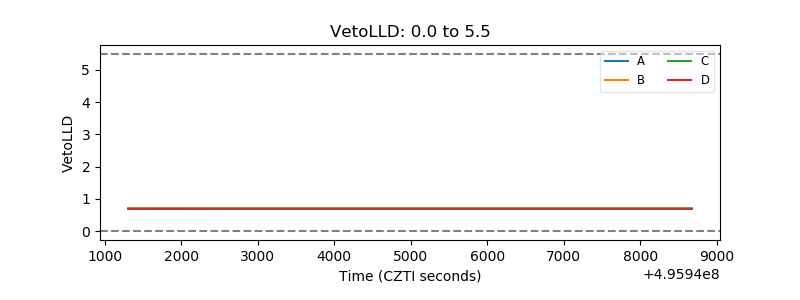 |
| Alpha Counter | 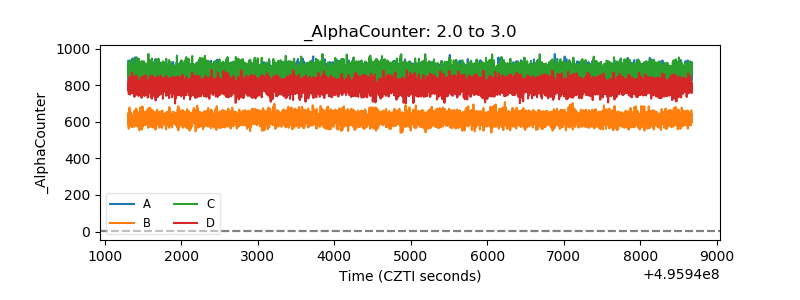 |
| _CPM_Rate | 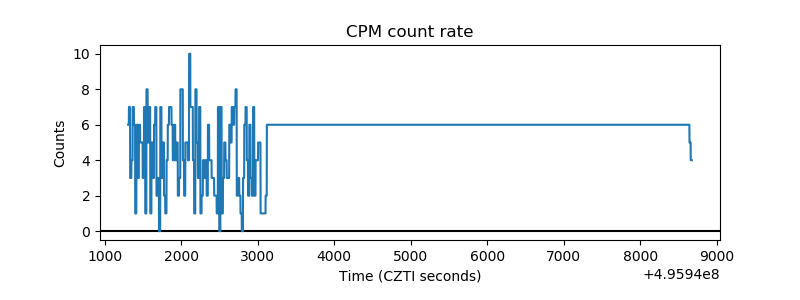 |
| CZT Counter | 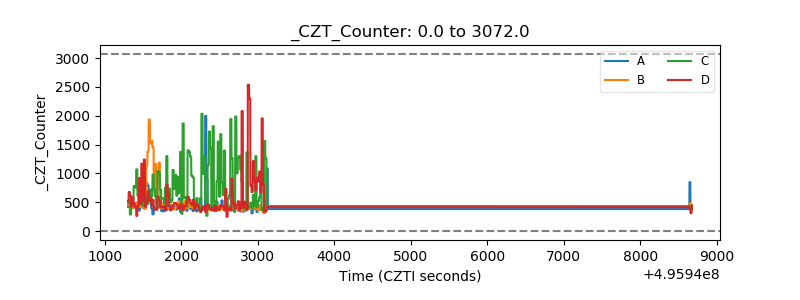 |
| +2.5 Volts monitor |  |
| +5 Volts monitor |  |
| _ROLL_ROT | 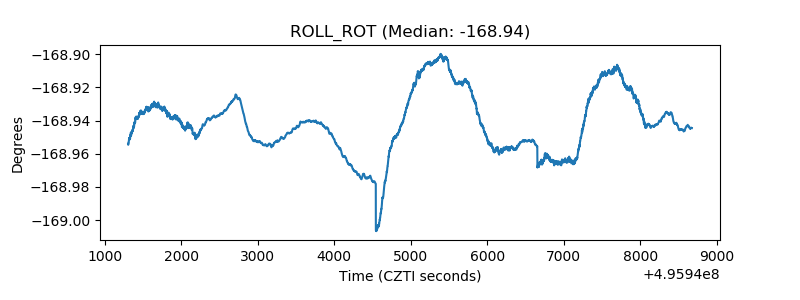 |
| _Roll_DEC | 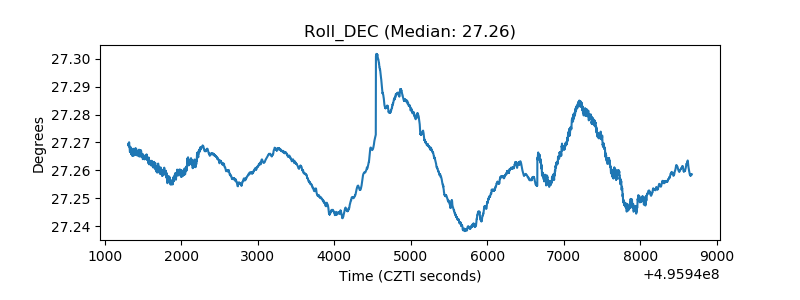 |
| _Roll_RA | 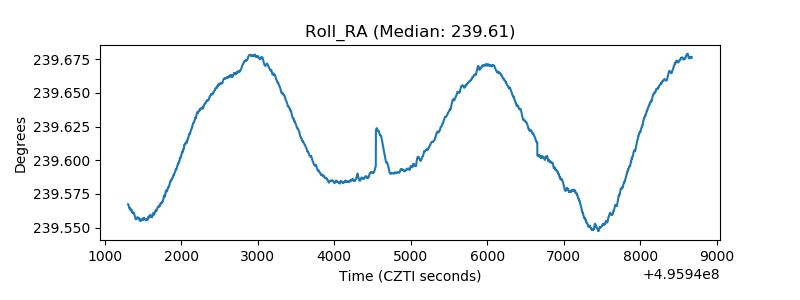 |
| Veto Counter | 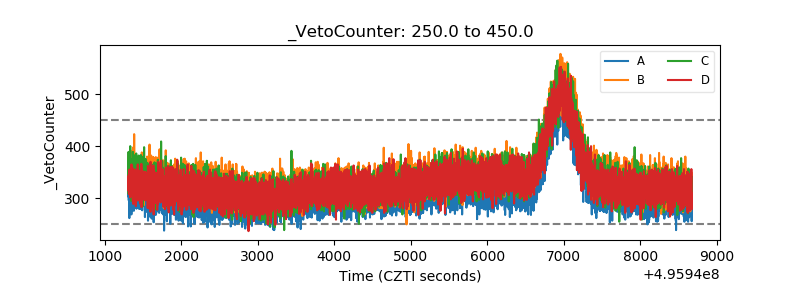 |