| Param | Original file | Final file |
|---|---|---|
| Filename | modeM0/AS1A14_057T04_9000006508_53969cztM0_level2.fits | modeM0/AS1A14_057T04_9000006508_53969cztM0_level2_quad_clean.evt |
| Size (bytes) | 838,177,920 | 116,490,240 |
| Size | 799.3 MB | 111.1 MB |
| Events in quadrant A | 4,619,978 | 829,911 |
| Events in quadrant B | 5,387,724 | 868,765 |
| Events in quadrant C | 11,356,708 | 540,628 |
| Events in quadrant D | 8,978,221 | 674,840 |
| Mode M0 | |||
|---|---|---|---|
| Quadrant | BADHDUFLAG | Total packets | Discarded packets |
| A | 0 | 20004 | 0 |
| B | 0 | 22050 | 0 |
| C | 0 | 39843 | 0 |
| D | 0 | 32988 | 0 |
| Mode SS | |||
|---|---|---|---|
| Quadrant | BADHDUFLAG | Total packets | Discarded packets |
| A | 0 | 176 | 0 |
| B | 0 | 176 | 0 |
| C | 0 | 176 | 0 |
| D | 0 | 176 | 0 |
| Quadrant | Total seconds | Saturated seconds | Saturation percentage |
|---|---|---|---|
| A | 8829 | 151 | 1.710273% |
| B | 8829 | 321 | 3.635746% |
| C | 8830 | 2981 | 33.759909% |
| D | 8830 | 1213 | 13.737259% |
Noise dominated data is calculated using 1-second bins in cleaned event files. If a bin has >2000 counts, and if more than 50% of those come from <1% of pixels, then it is considered to be noise-dominated and hence unusable.
| Quadrant | # 1 sec bins | Bins with >0 counts | Bins with >2000 counts | High rate bins dominated by noise | Noise dominated (total time) | Noise dominated (detector-on time) | Marked lightcurve |
|---|---|---|---|---|---|---|---|
| A | 8829 | 8829 | 57 | 57 | 0.65% | 0.65% | 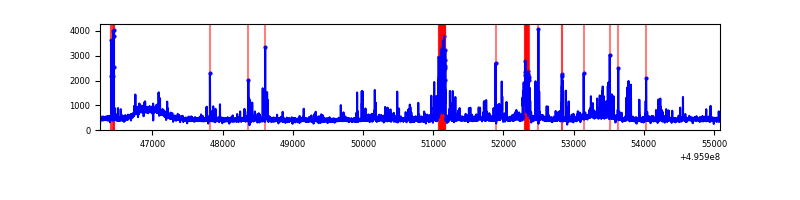 |
| B | 8829 | 8829 | 96 | 96 | 1.09% | 1.09% | 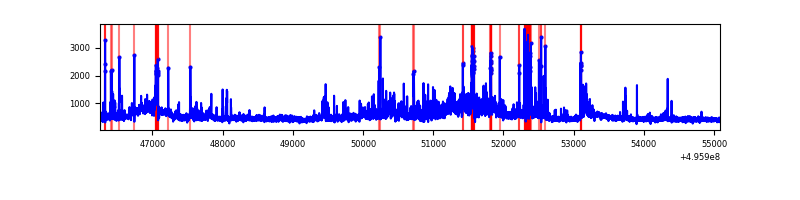 |
| C | 8830 | 8830 | 2508 | 2508 | 28.40% | 28.40% | 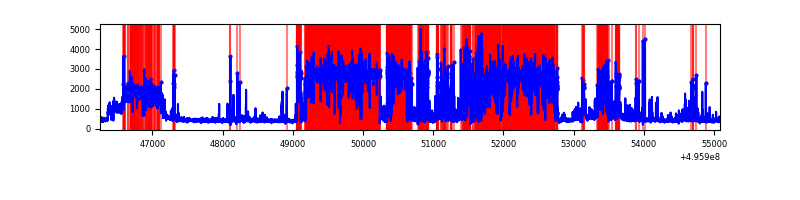 |
| D | 8830 | 8830 | 957 | 957 | 10.84% | 10.84% | 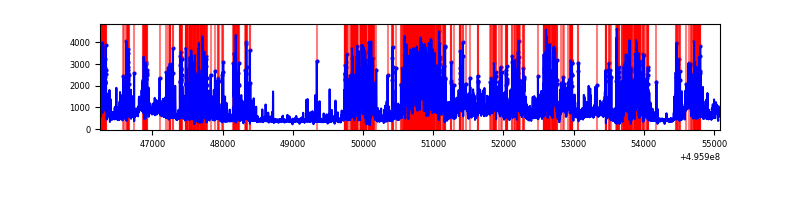 |
Top three noisy pixels from each quadrant. If the there are fewer than three noisy pixels in the level2.evt file, extra rows are filled as -1
| Pixel properties | Quadrant properties | ||||||
|---|---|---|---|---|---|---|---|
| Quadrant | DetID | PixID | Counts | Sigma | Mean | Median | Sigma |
| A | 12 | 17 | 195234 | 804.59 | 985 | 959 | 241.5 |
| A | 7 | 14 | 139966 | 575.7 | 985 | 959 | 241.5 |
| A | 8 | 246 | 104651 | 429.44 | 985 | 959 | 241.5 |
| B | 5 | 250 | 795153 | 3800.78 | 974 | 939 | 209.0 |
| B | 0 | 213 | 249962 | 1191.72 | 974 | 939 | 209.0 |
| B | 5 | 185 | 180403 | 858.84 | 974 | 939 | 209.0 |
| C | 1 | 241 | 6861482 | 30559.61 | 821 | 816 | 224.5 |
| C | 4 | 5 | 813408 | 3619.55 | 821 | 816 | 224.5 |
| C | 12 | 2 | 140769 | 623.4 | 821 | 816 | 224.5 |
| D | 8 | 176 | 3189948 | 12535.51 | 906 | 869 | 254.4 |
| D | 6 | 239 | 1238269 | 4863.93 | 906 | 869 | 254.4 |
| D | 10 | 172 | 198330 | 776.17 | 906 | 869 | 254.4 |
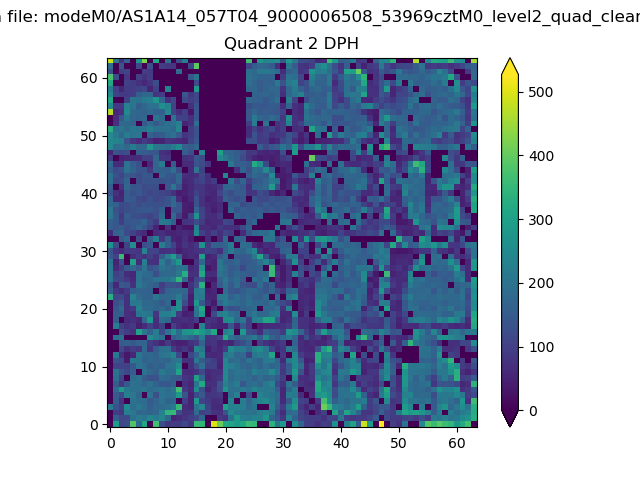
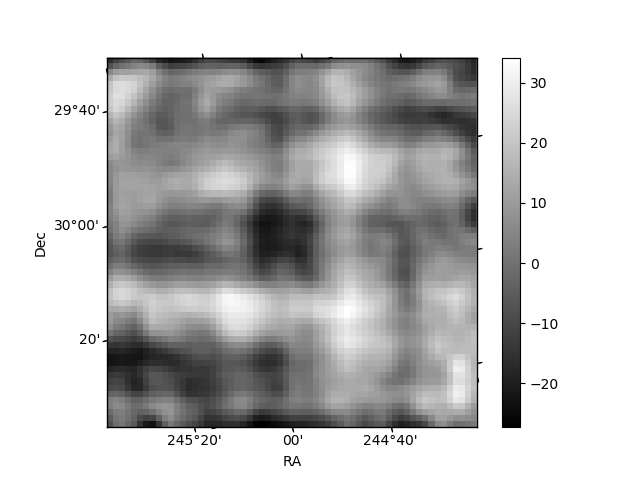
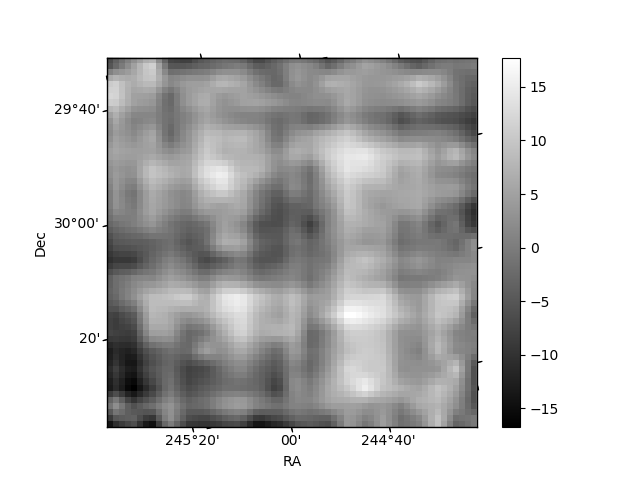
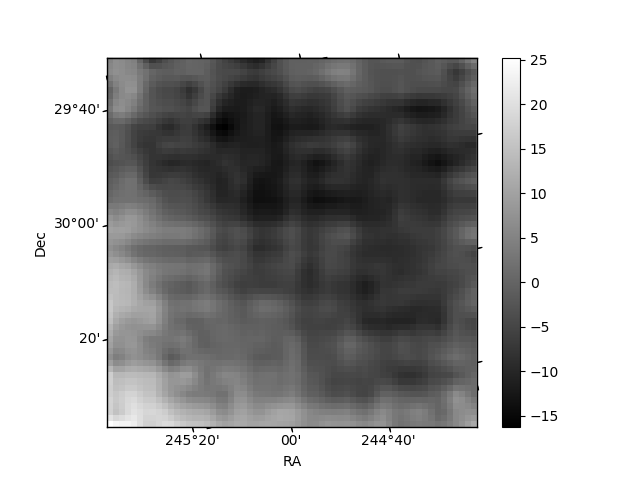
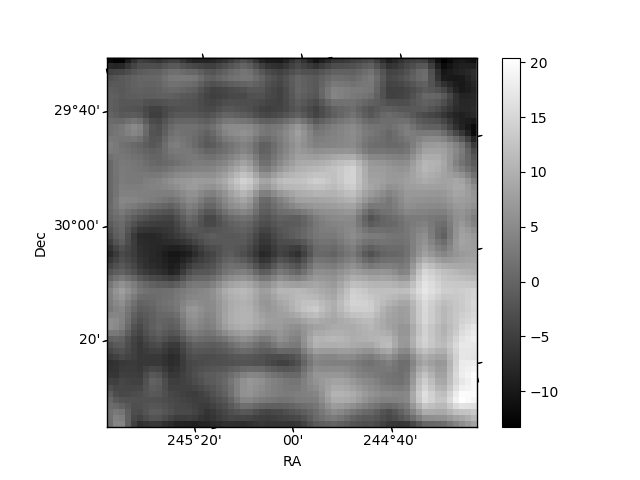
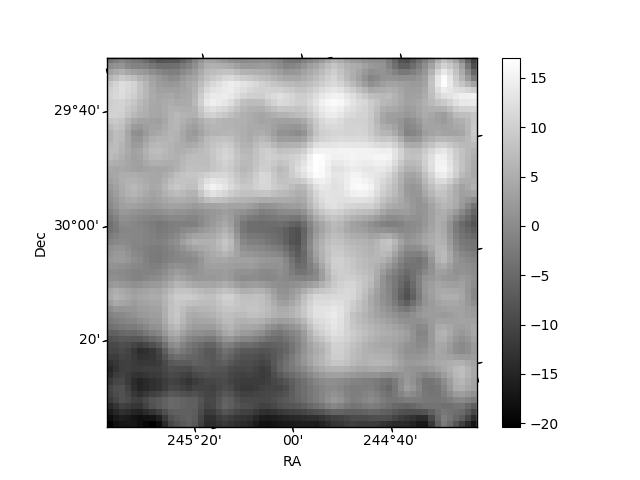
Histogram calculated using DETX and DETY for each event in the final _common_clean file
| Quadrant A | 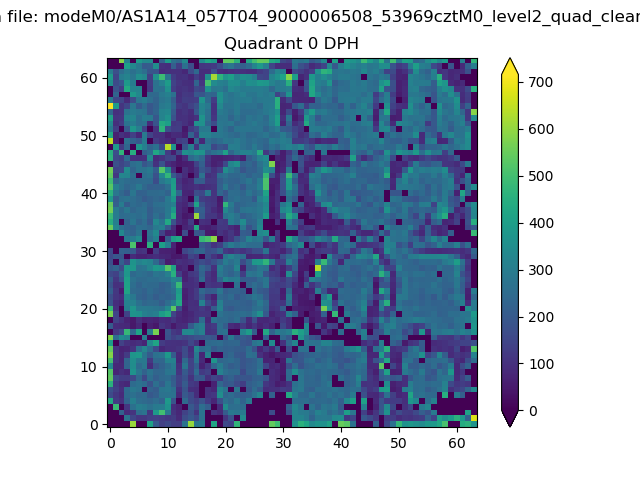 |
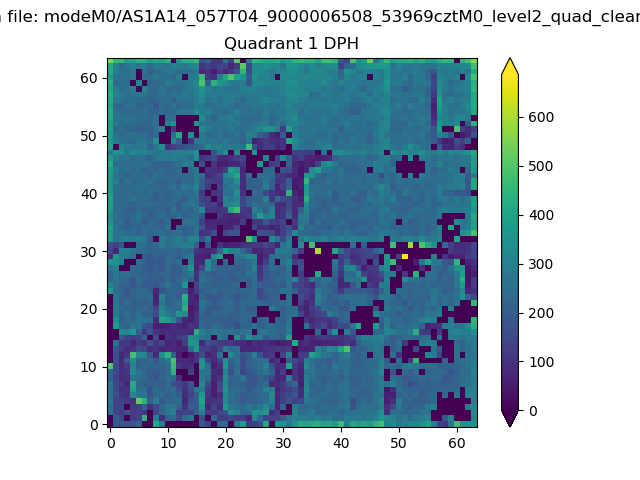 |
Quadrant B |
|---|---|---|---|
| Quadrant D | 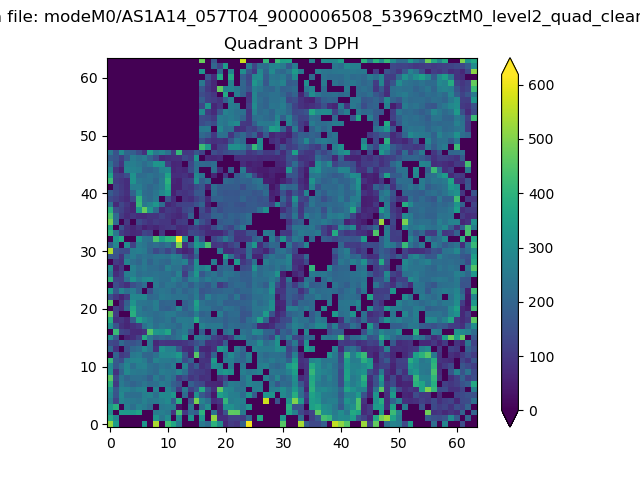 |
 |
Quadrant C |
| Plot type | Count rate plots | Images |
|---|---|---|
| Comparison with Poisson distribution Blue bars denote a histogram of data divided into 1 sec bins. Red curve is a Poisson curve with rate = median count rate of data. |
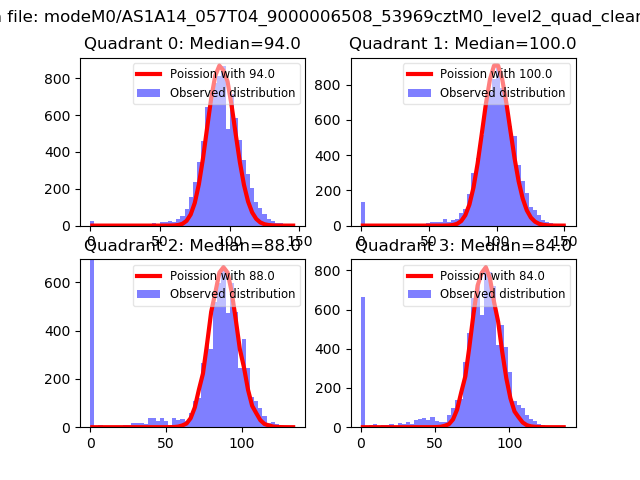 |
 |
| Quadrant-wise count rates Data is divided into 100 sec bins |
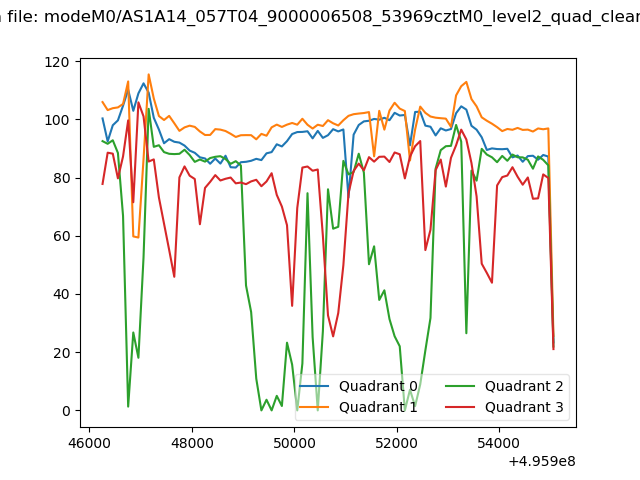 |
|
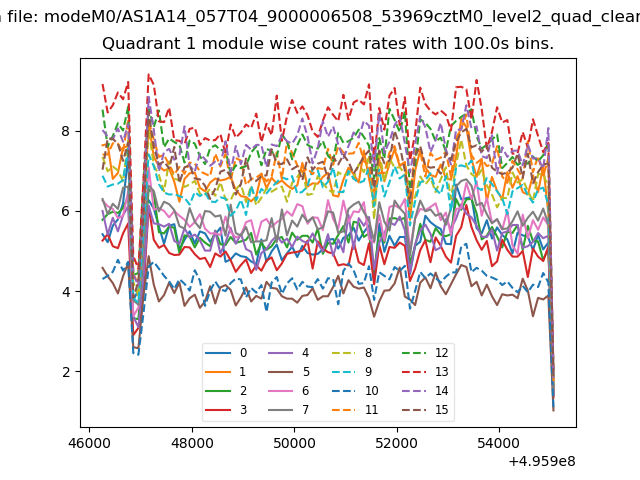
| Module-wise count rates for Quadrant A Data is divided into 100 sec bins |
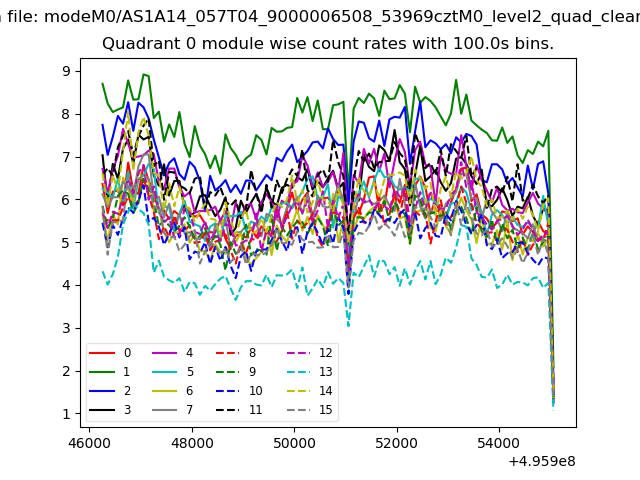 |
 |
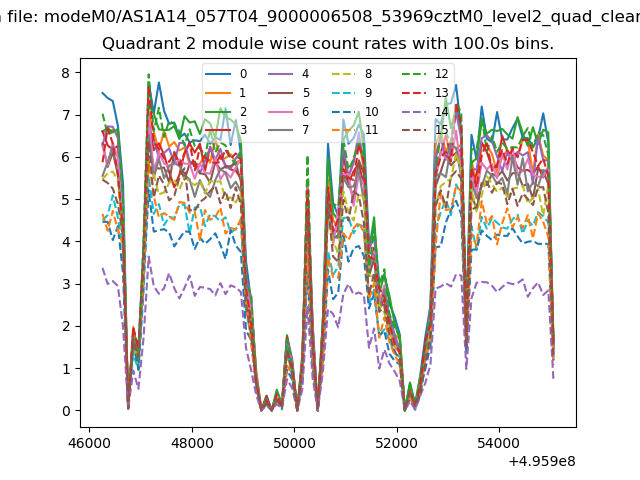
| Module-wise count rates for Quadrant B Data is divided into 100 sec bins |
 |
 |
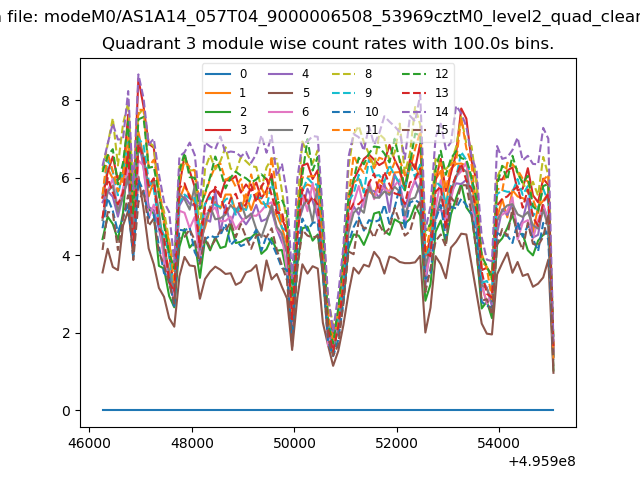
| Module-wise count rates for Quadrant C Data is divided into 100 sec bins |
 |
 |
| Module-wise count rates for Quadrant D Data is divided into 100 sec bins |
 |
 |
| Parameter | Plot |
|---|---|
| CZT HV Monitor | 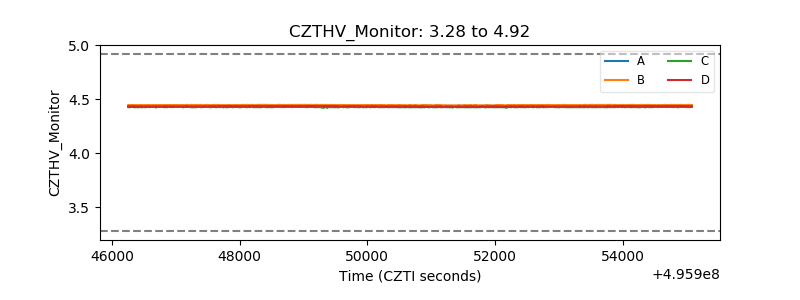 |
| D_VDD | 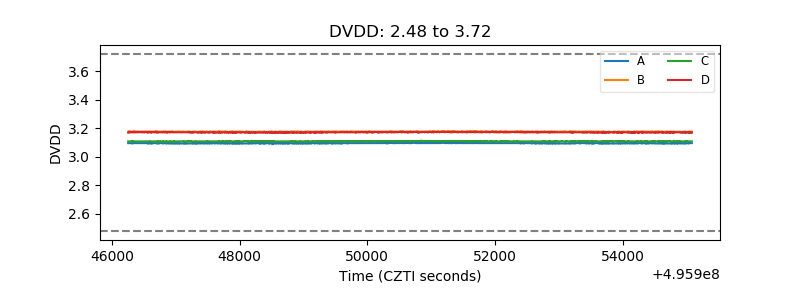 |
| Temperature 1 | 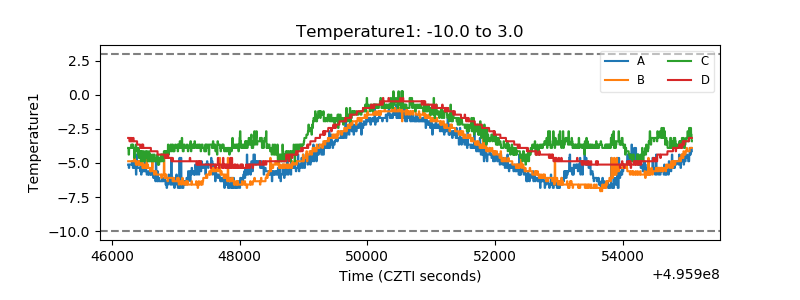 |
| Veto HV Monitor | 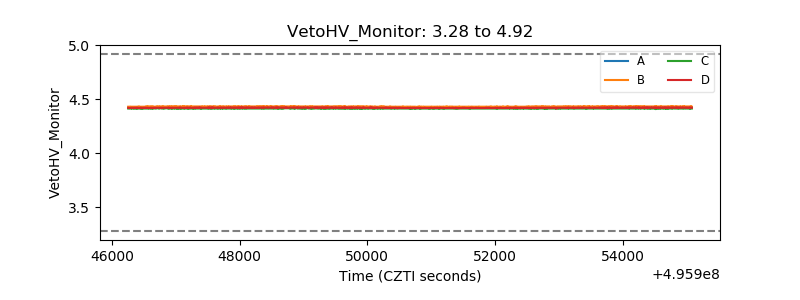 |
| Veto LLD | 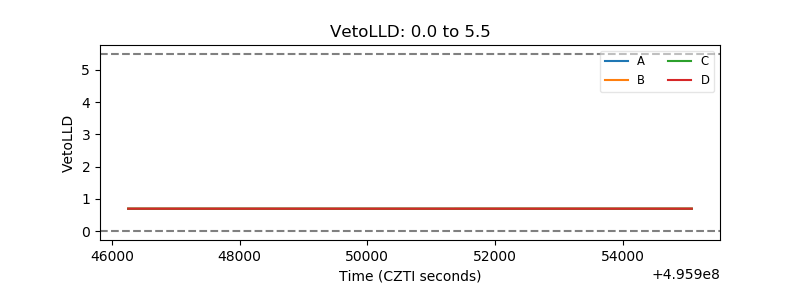 |
| Alpha Counter | 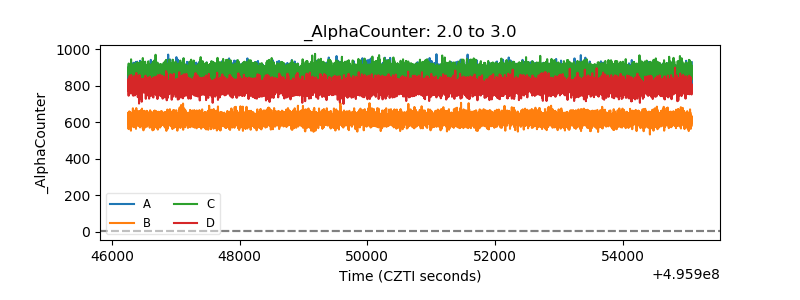 |
| _CPM_Rate | 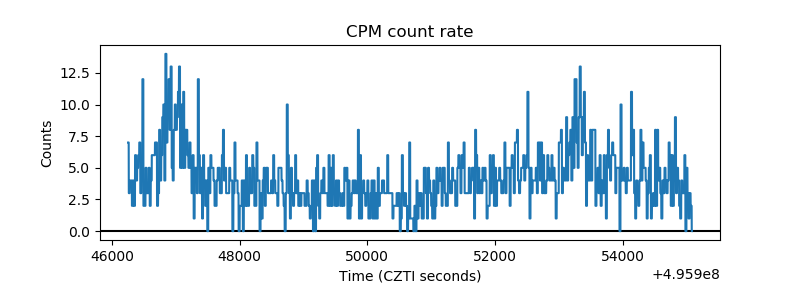 |
| CZT Counter | 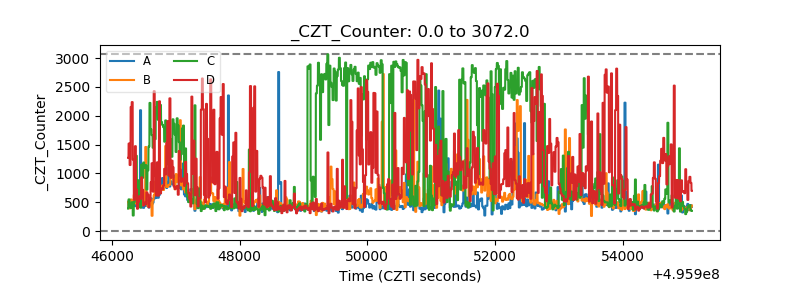 |
| +2.5 Volts monitor |  |
| +5 Volts monitor |  |
| _ROLL_ROT | 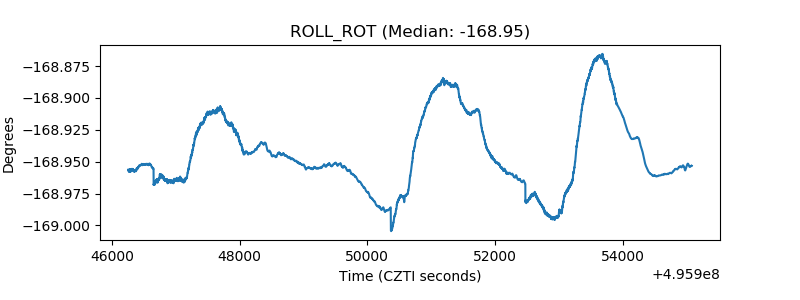 |
| _Roll_DEC | 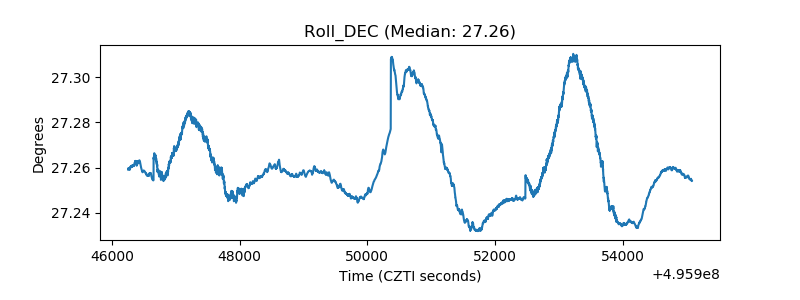 |
| _Roll_RA | 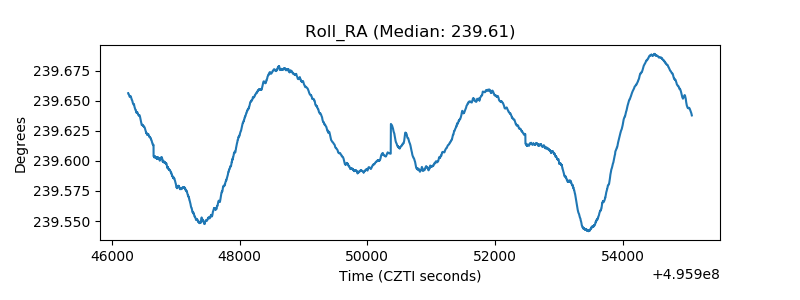 |
| Veto Counter |  |