| Param | Original file | Final file |
|---|---|---|
| Filename | modeM0/AS1A14_041T01_9000006510cztM0_level2.fits | modeM0/AS1A14_041T01_9000006510cztM0_level2_quad_clean.evt |
| Size (bytes) | 5,010,549,120 | 2,438,850,240 |
| Size | 4.7 GB | 2.3 GB |
| Events in quadrant A | 31,122,956 | 8,706,971 |
| Events in quadrant B | 28,764,924 | 9,086,088 |
| Events in quadrant C | 28,889,778 | 7,705,236 |
| Events in quadrant D | 19,793,956 | 5,305,467 |
| Mode M9 | |||
|---|---|---|---|
| Quadrant | BADHDUFLAG | Total packets | Discarded packets |
| A | 0 | 743 | 0 |
| B | 0 | 743 | 0 |
| C | 0 | 744 | 0 |
| D | 0 | 744 | 0 |
| Mode SS | |||
|---|---|---|---|
| Quadrant | BADHDUFLAG | Total packets | Discarded packets |
| A | 0 | 12736 | 0 |
| B | 0 | 12736 | 0 |
| C | 0 | 12736 | 0 |
| D | 0 | 12736 | 0 |
| Mode M0 | |||
|---|---|---|---|
| Quadrant | BADHDUFLAG | Total packets | Discarded packets |
| A | 0 | 1499972 | 0 |
| B | 0 | 1701750 | 0 |
| C | 0 | 1765984 | 0 |
| D | 0 | 2940029 | 0 |
| Quadrant | Total seconds | Saturated seconds | Saturation percentage |
|---|---|---|---|
| A | 628239 | 23181 | 3.689838% |
| B | 628248 | 41921 | 6.672683% |
| C | 628251 | 50484 | 8.035642% |
| D | 628243 | 213808 | 34.032691% |
Noise dominated data is calculated using 1-second bins in cleaned event files. If a bin has >2000 counts, and if more than 50% of those come from <1% of pixels, then it is considered to be noise-dominated and hence unusable.
| Quadrant | # 1 sec bins | Bins with >0 counts | Bins with >2000 counts | High rate bins dominated by noise | Noise dominated (total time) | Noise dominated (detector-on time) | Marked lightcurve |
|---|---|---|---|---|---|---|---|
| A | 757395 | 627920 | 0 | 0 | 0.00% | 0.00% | 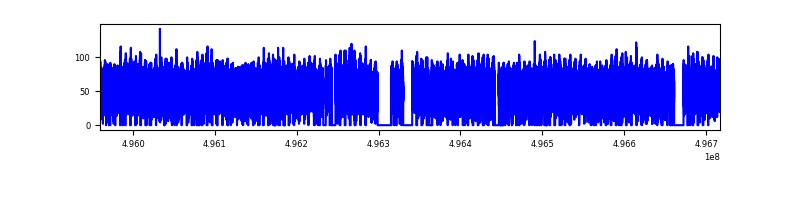 |
| B | 757396 | 627721 | 0 | 0 | 0.00% | 0.00% | 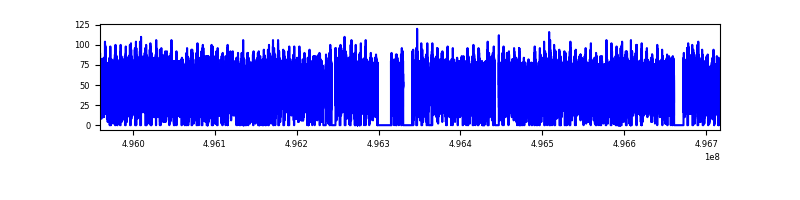 |
| C | 757396 | 625337 | 0 | 0 | 0.00% | 0.00% | 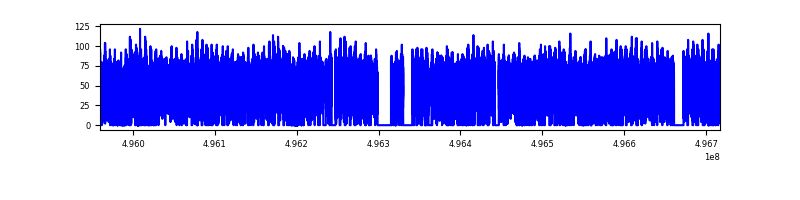 |
| D | 757396 | 591872 | 0 | 0 | 0.00% | 0.00% | 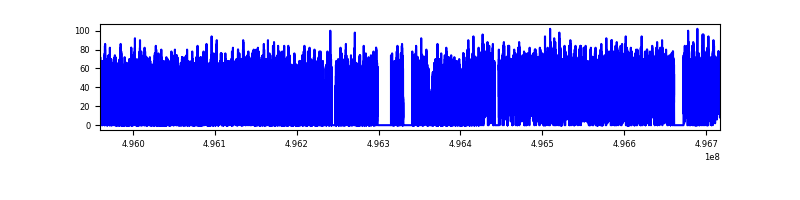 |
Top three noisy pixels from each quadrant. If the there are fewer than three noisy pixels in the level2.evt file, extra rows are filled as -1
| Pixel properties | Quadrant properties | ||||||
|---|---|---|---|---|---|---|---|
| Quadrant | DetID | PixID | Counts | Sigma | Mean | Median | Sigma |
| A | 14 | 188 | 34960 | 9.95 | 8188 | 7549 | 2753.7 |
| A | 9 | 255 | 31306 | 8.63 | 8188 | 7549 | 2753.7 |
| A | 14 | 204 | 28575 | 7.64 | 8188 | 7549 | 2753.7 |
| B | 2 | 9 | 33197 | 14.57 | 7646 | 7256 | 1779.8 |
| B | 2 | 8 | 29520 | 12.51 | 7646 | 7256 | 1779.8 |
| B | 9 | 173 | 24095 | 9.46 | 7646 | 7256 | 1779.8 |
| C | 15 | 175 | 24444 | 6.51 | 7751 | 7049 | 2670.3 |
| C | 2 | 31 | 23267 | 6.07 | 7751 | 7049 | 2670.3 |
| C | 3 | 203 | 22337 | 5.73 | 7751 | 7049 | 2670.3 |
| D | 6 | 218 | 25301 | 10.45 | 5681 | 5024 | 1939.6 |
| D | 15 | 11 | 19310 | 7.37 | 5681 | 5024 | 1939.6 |
| D | 3 | 30 | 18200 | 6.79 | 5681 | 5024 | 1939.6 |
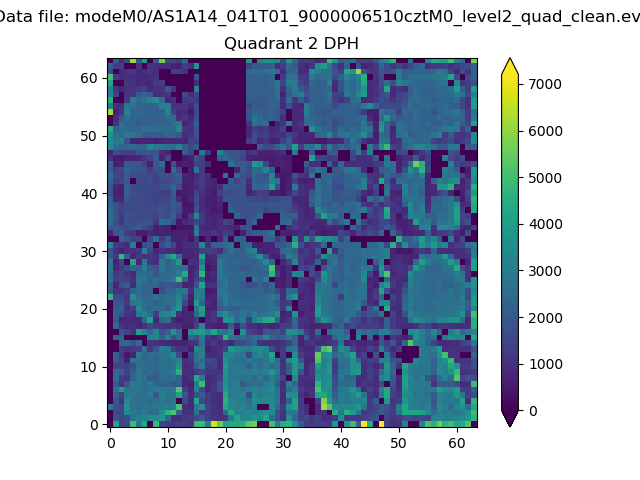
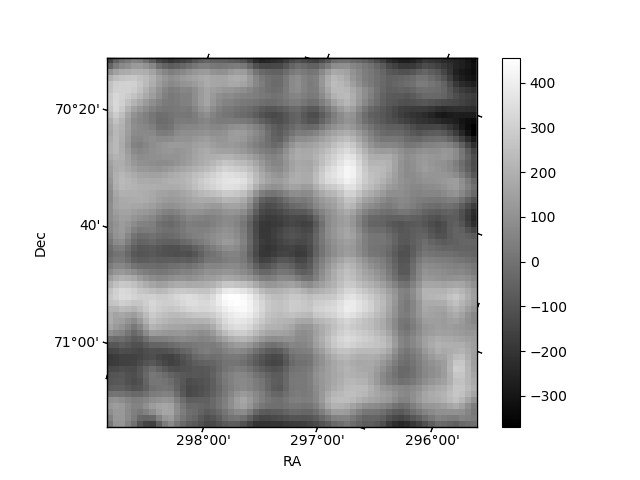
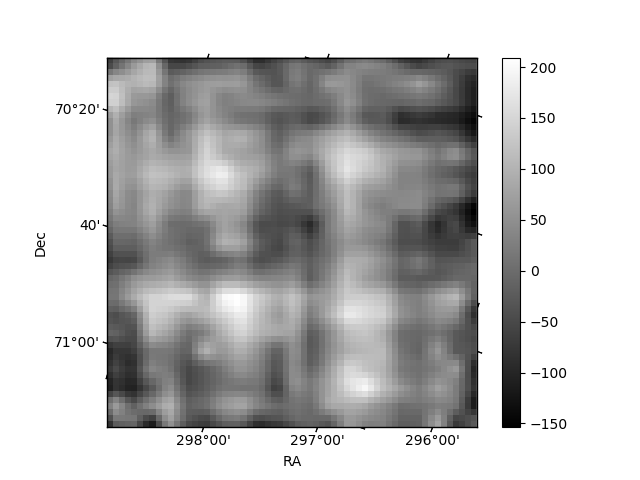
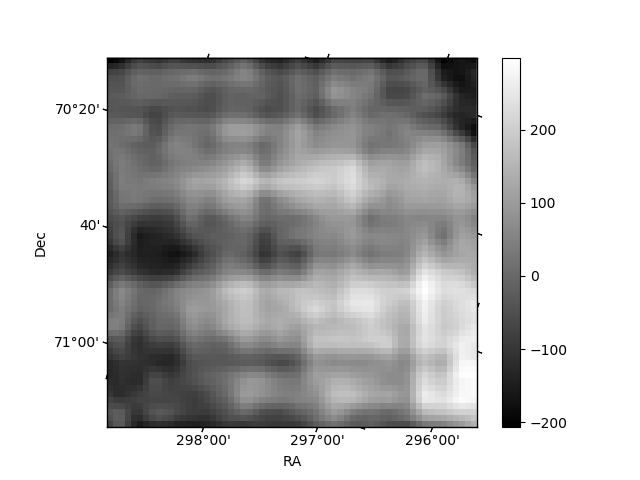
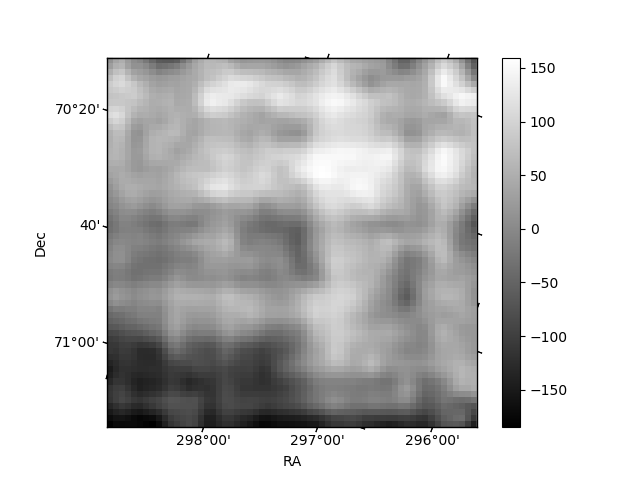
Histogram calculated using DETX and DETY for each event in the final _common_clean file
| Quadrant A | 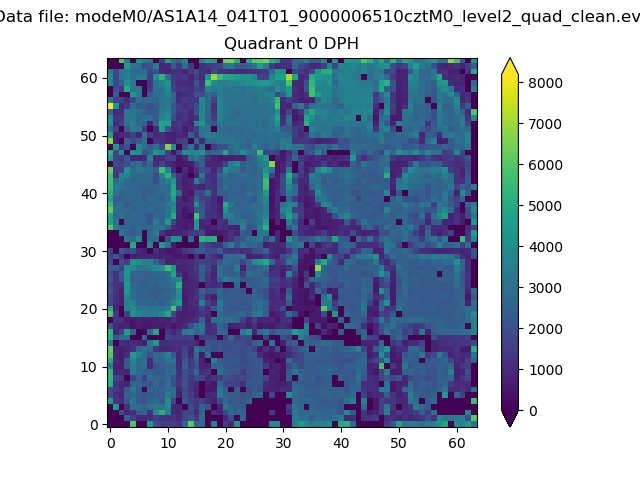 |
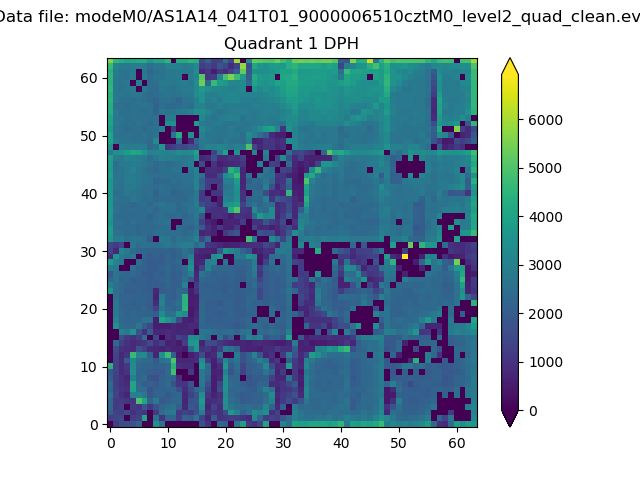 |
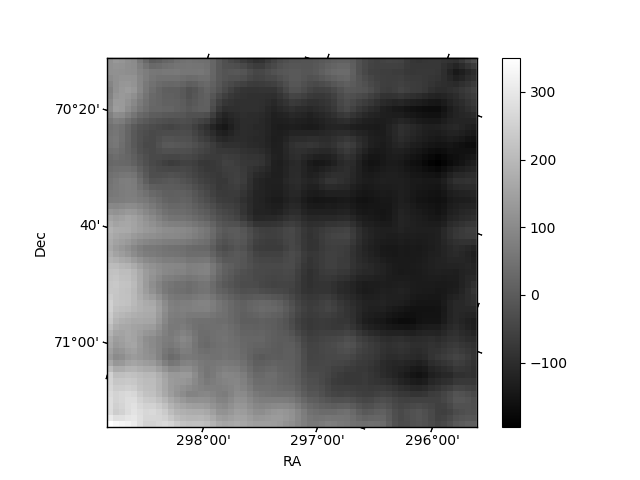
Quadrant B |
|---|---|---|---|
| Quadrant D | 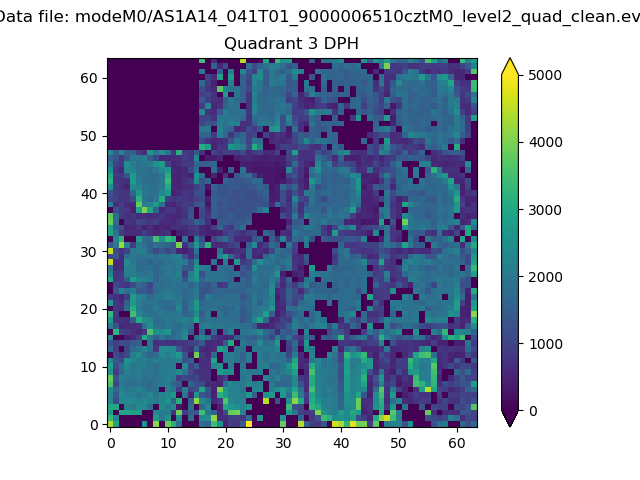 |
 |
Quadrant C |
| Plot type | Count rate plots | Images |
|---|---|---|
| Comparison with Poisson distribution Blue bars denote a histogram of data divided into 1 sec bins. Red curve is a Poisson curve with rate = median count rate of data. |
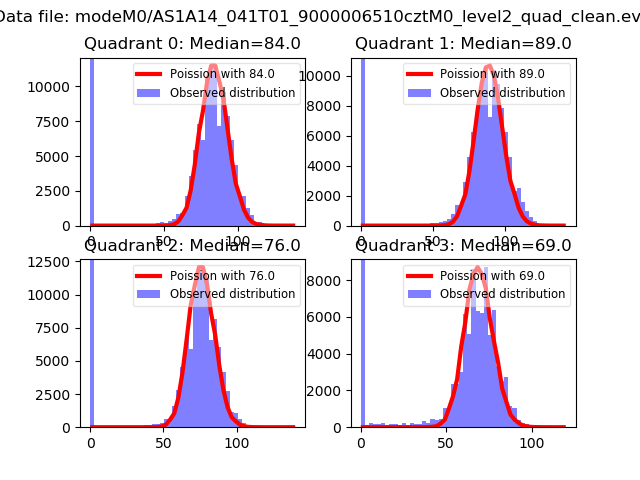 |
 |
| Quadrant-wise count rates Data is divided into 100 sec bins |
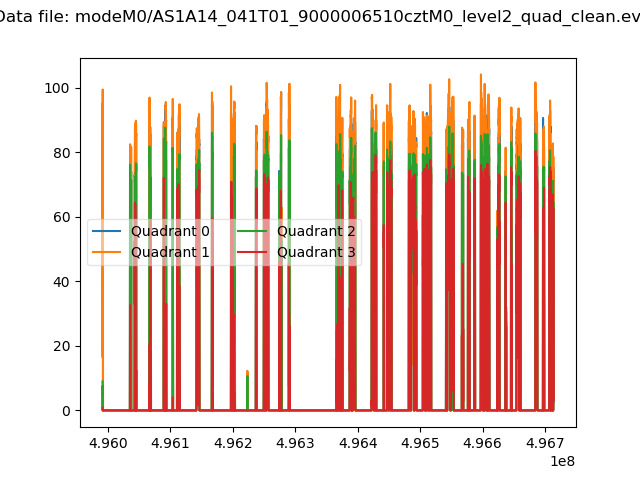 |
|
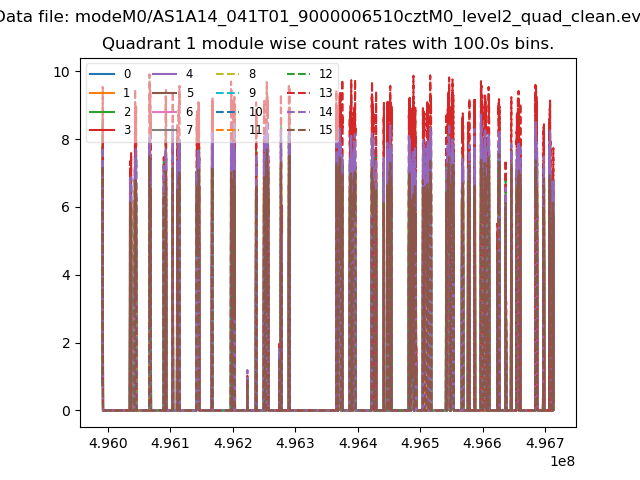
| Module-wise count rates for Quadrant A Data is divided into 100 sec bins |
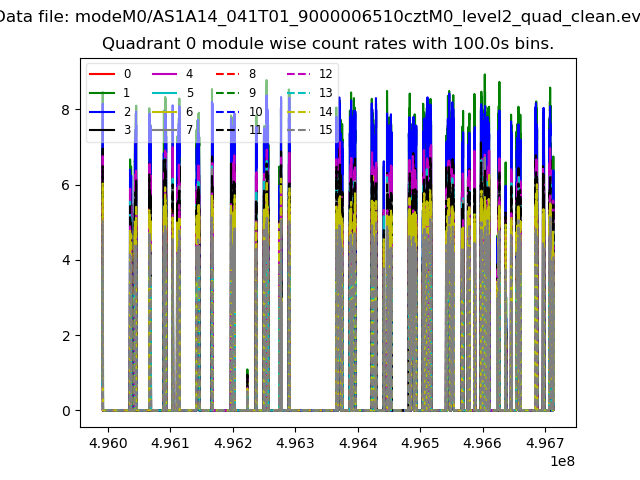 |
 |
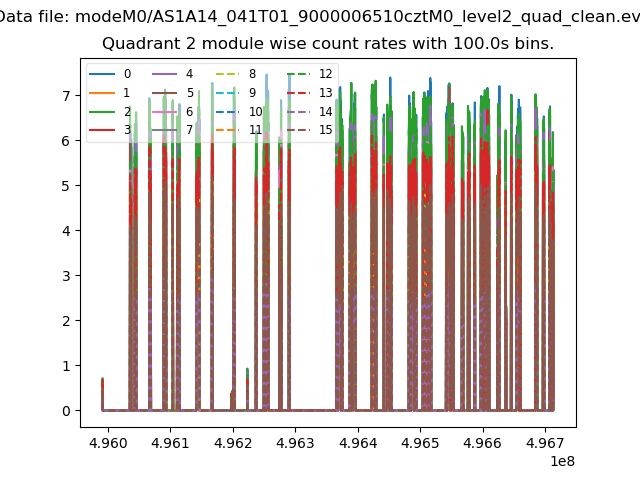
| Module-wise count rates for Quadrant B Data is divided into 100 sec bins |
 |
 |
| Module-wise count rates for Quadrant C Data is divided into 100 sec bins |
 |
 |
| Module-wise count rates for Quadrant D Data is divided into 100 sec bins |
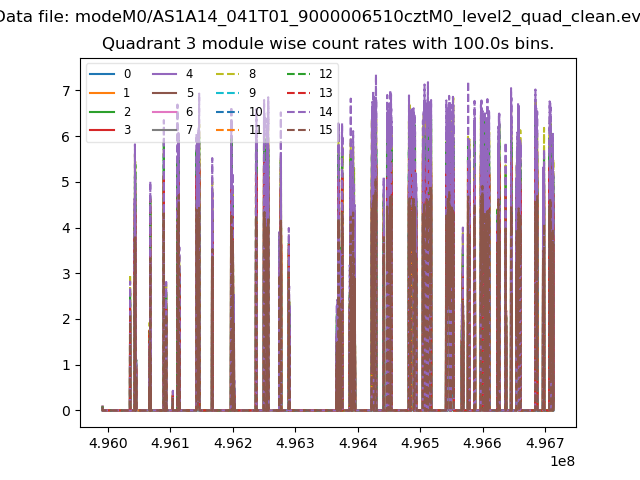 |
 |
| Parameter | Plot |
|---|---|
| CZT HV Monitor | 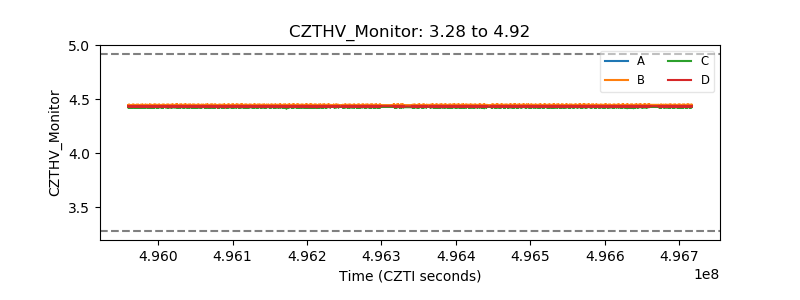 |
| D_VDD | 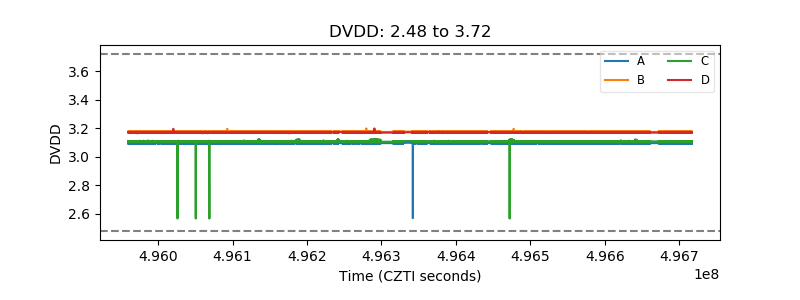 |
| Temperature 1 | 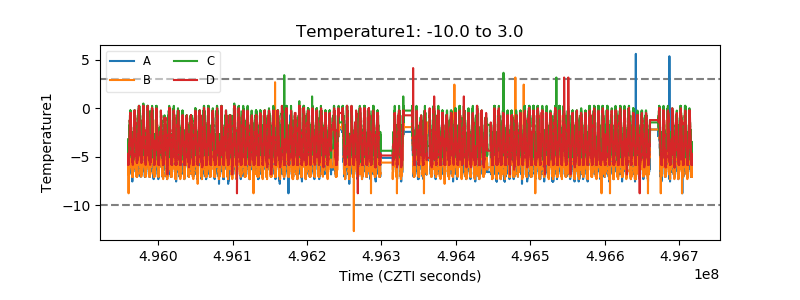 |
| Veto HV Monitor | 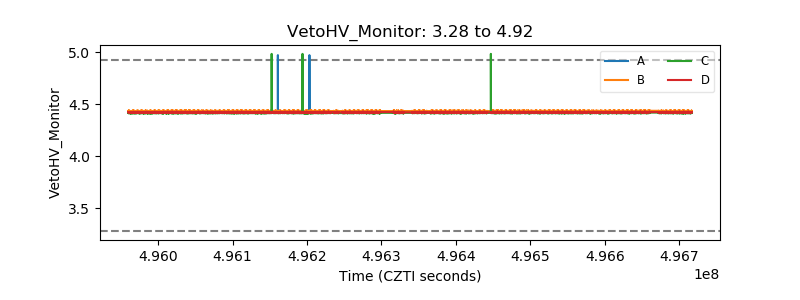 |
| Veto LLD | 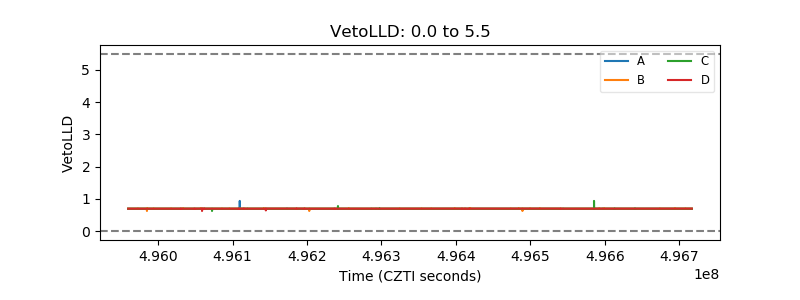 |
| Alpha Counter | 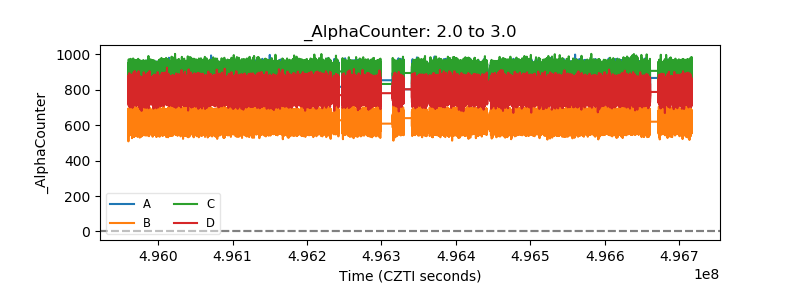 |
| _CPM_Rate | 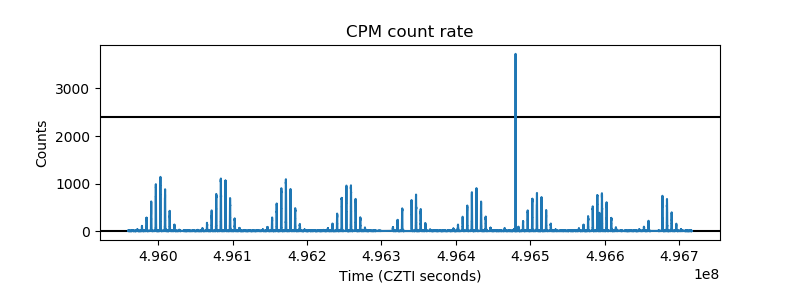 |
| CZT Counter | 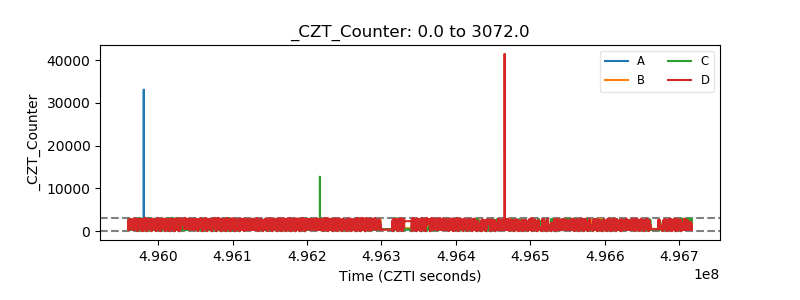 |
| +2.5 Volts monitor | 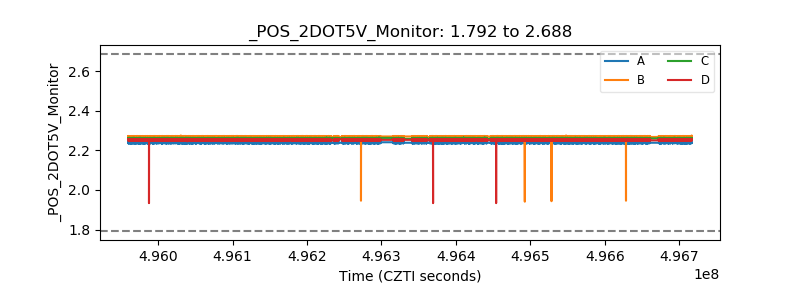 |
| +5 Volts monitor | 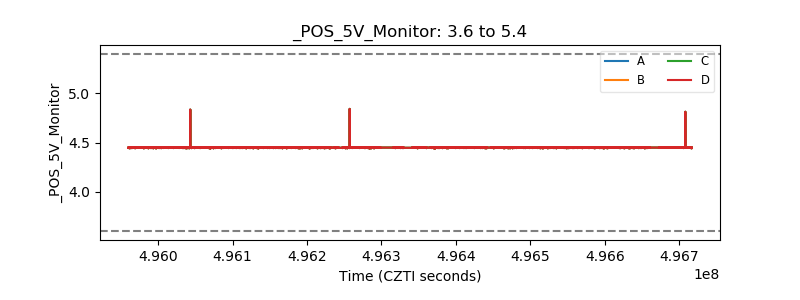 |
| _ROLL_ROT | 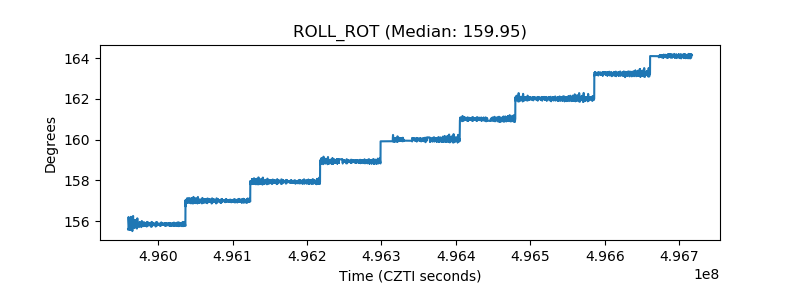 |
| _Roll_DEC | 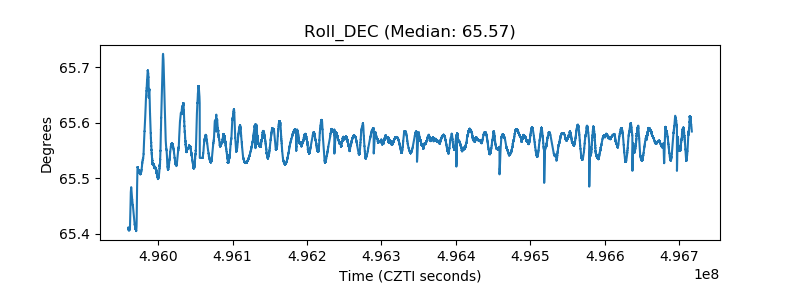 |
| _Roll_RA | 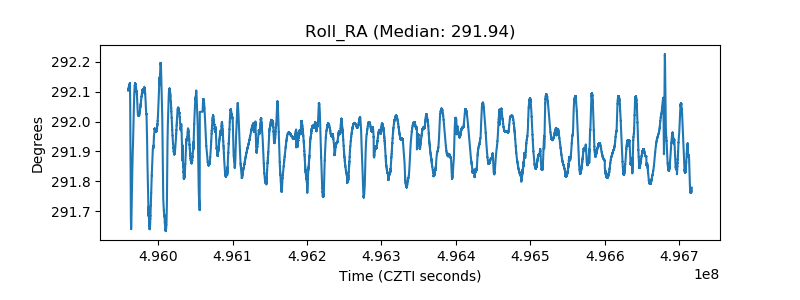 |
| Veto Counter | 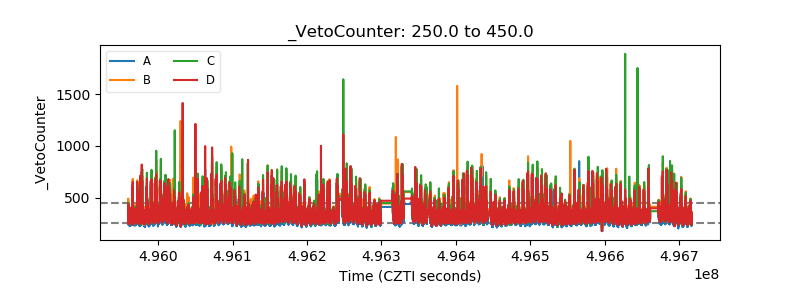 |