| Param | Original file | Final file |
|---|---|---|
| Filename | modeM0/AS1A14_041T01_9000006510_53973cztM0_level2.fits | modeM0/AS1A14_041T01_9000006510_53973cztM0_level2_quad_clean.evt |
| Size (bytes) | 1,767,098,880 | 247,141,440 |
| Size | 1.6 GB | 235.7 MB |
| Events in quadrant A | 11,140,858 | 1,715,573 |
| Events in quadrant B | 9,412,161 | 1,935,271 |
| Events in quadrant C | 16,407,876 | 1,420,121 |
| Events in quadrant D | 26,946,670 | 1,070,283 |
| Mode M9 | |||
|---|---|---|---|
| Quadrant | BADHDUFLAG | Total packets | Discarded packets |
| A | 0 | 12 | 0 |
| B | 0 | 12 | 0 |
| C | 0 | 12 | 0 |
| D | 0 | 12 | 0 |
| Mode SS | |||
|---|---|---|---|
| Quadrant | BADHDUFLAG | Total packets | Discarded packets |
| A | 0 | 392 | 0 |
| B | 0 | 392 | 0 |
| C | 0 | 392 | 0 |
| D | 0 | 392 | 0 |
| Mode M0 | |||
|---|---|---|---|
| Quadrant | BADHDUFLAG | Total packets | Discarded packets |
| A | 0 | 46952 | 5 |
| B | 0 | 42050 | 8 |
| C | 0 | 62637 | 2 |
| D | 0 | 93653 | 33 |
| Quadrant | Total seconds | Saturated seconds | Saturation percentage |
|---|---|---|---|
| A | 19463 | 955 | 4.906746% |
| B | 19462 | 539 | 2.769500% |
| C | 19466 | 2799 | 14.378917% |
| D | 19461 | 6130 | 31.498895% |
Noise dominated data is calculated using 1-second bins in cleaned event files. If a bin has >2000 counts, and if more than 50% of those come from <1% of pixels, then it is considered to be noise-dominated and hence unusable.
| Quadrant | # 1 sec bins | Bins with >0 counts | Bins with >2000 counts | High rate bins dominated by noise | Noise dominated (total time) | Noise dominated (detector-on time) | Marked lightcurve |
|---|---|---|---|---|---|---|---|
| A | 20585 | 19466 | 443 | 443 | 2.15% | 2.28% | 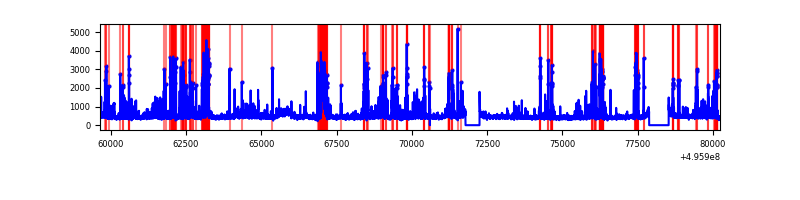 |
| B | 20586 | 19466 | 98 | 98 | 0.48% | 0.50% | 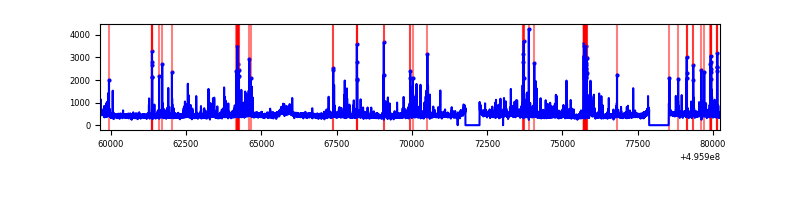 |
| C | 20586 | 19468 | 2319 | 2319 | 11.26% | 11.91% | 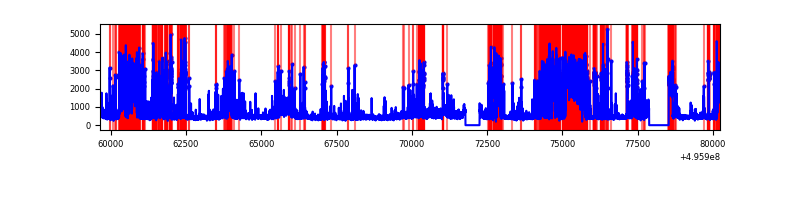 |
| D | 20585 | 19464 | 5177 | 5177 | 25.15% | 26.60% | 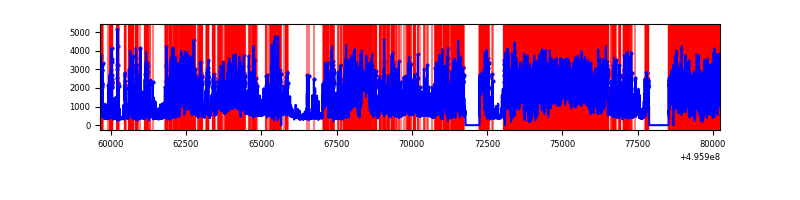 |
Top three noisy pixels from each quadrant. If the there are fewer than three noisy pixels in the level2.evt file, extra rows are filled as -1
| Pixel properties | Quadrant properties | ||||||
|---|---|---|---|---|---|---|---|
| Quadrant | DetID | PixID | Counts | Sigma | Mean | Median | Sigma |
| A | 15 | 174 | 838285 | 1641.48 | 2058 | 1999 | 509.5 |
| A | 0 | 8 | 622454 | 1217.84 | 2058 | 1999 | 509.5 |
| A | 14 | 248 | 394416 | 770.24 | 2058 | 1999 | 509.5 |
| B | 5 | 185 | 217743 | 495.65 | 2064 | 1993 | 435.3 |
| B | 0 | 213 | 192608 | 437.91 | 2064 | 1993 | 435.3 |
| B | 5 | 250 | 188003 | 427.33 | 2064 | 1993 | 435.3 |
| C | 1 | 241 | 6563729 | 12540.14 | 1903 | 1884 | 523.3 |
| C | 12 | 249 | 674451 | 1285.32 | 1903 | 1884 | 523.3 |
| C | 12 | 252 | 485721 | 924.65 | 1903 | 1884 | 523.3 |
| D | 8 | 176 | 13550476 | 28121.75 | 1680 | 1607 | 481.8 |
| D | 6 | 239 | 1612923 | 3344.41 | 1680 | 1607 | 481.8 |
| D | 10 | 172 | 1414488 | 2932.55 | 1680 | 1607 | 481.8 |
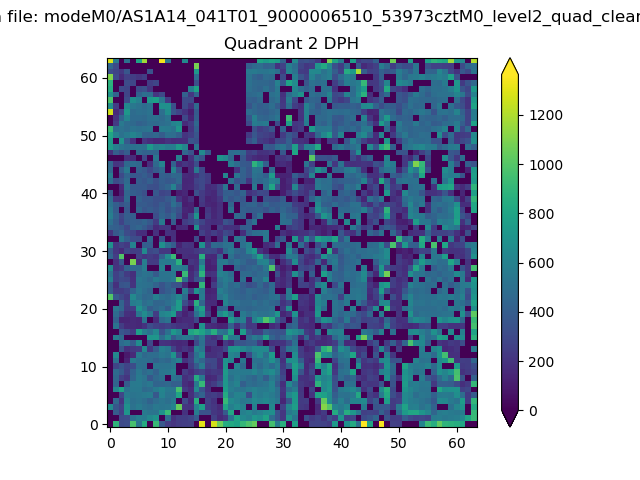
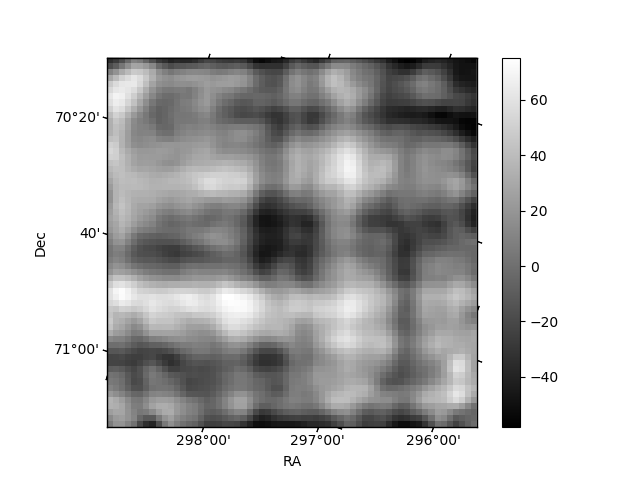
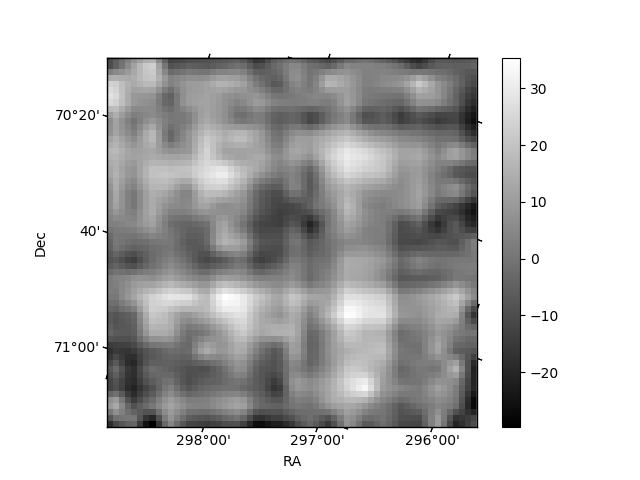
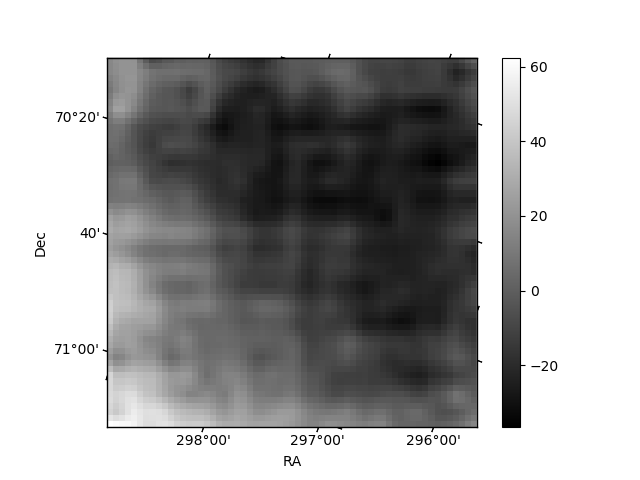
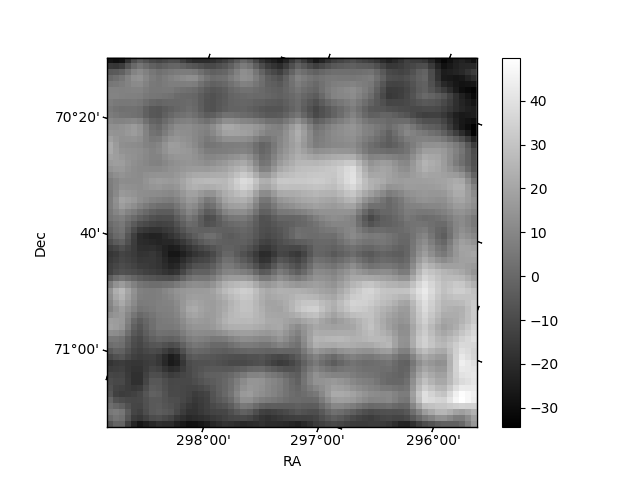
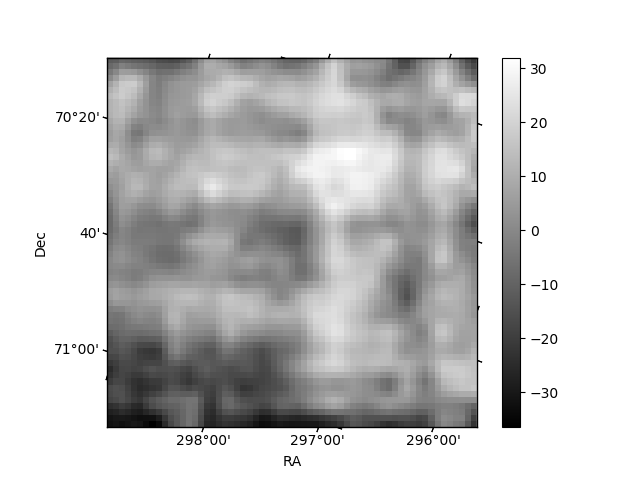
Histogram calculated using DETX and DETY for each event in the final _common_clean file
| Quadrant A | 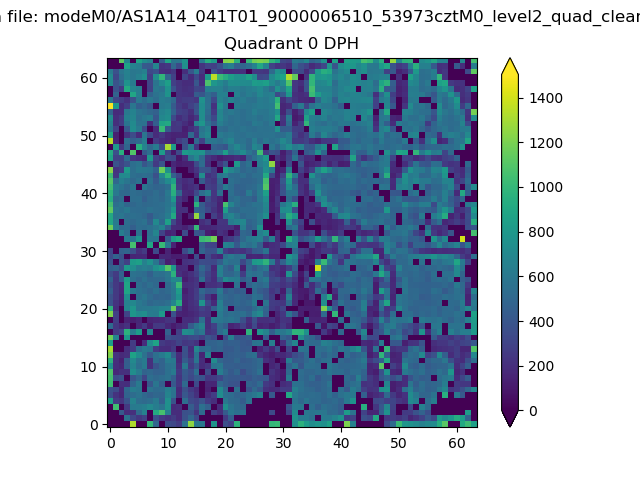 |
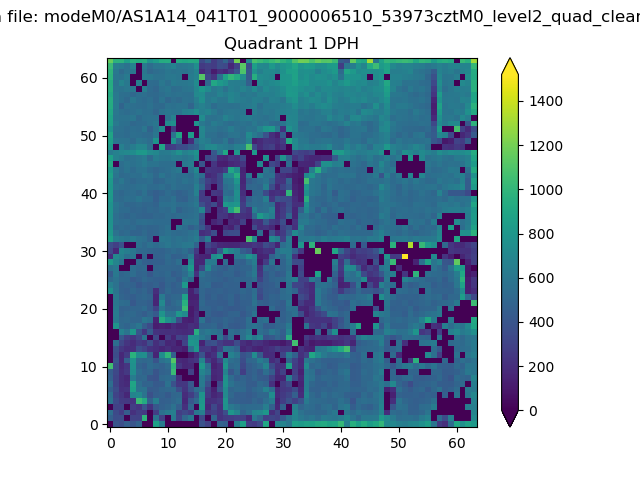 |
Quadrant B |
|---|---|---|---|
| Quadrant D | 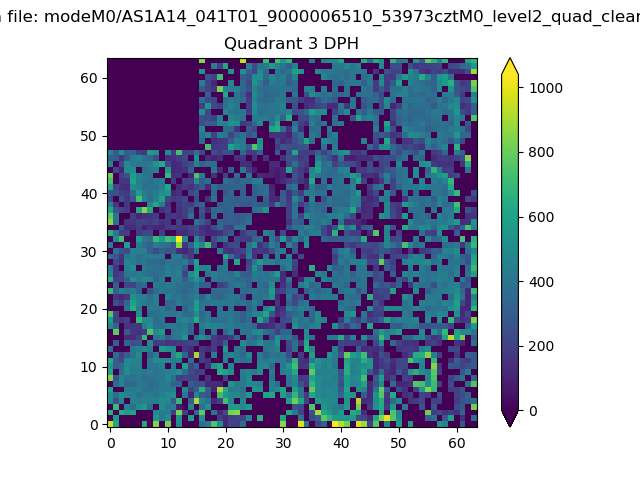 |
 |
Quadrant C |
| Plot type | Count rate plots | Images |
|---|---|---|
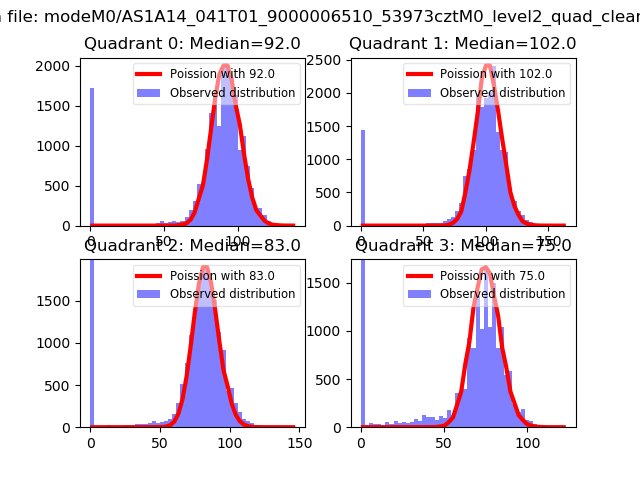
| Comparison with Poisson distribution Blue bars denote a histogram of data divided into 1 sec bins. Red curve is a Poisson curve with rate = median count rate of data. |
 |
 |
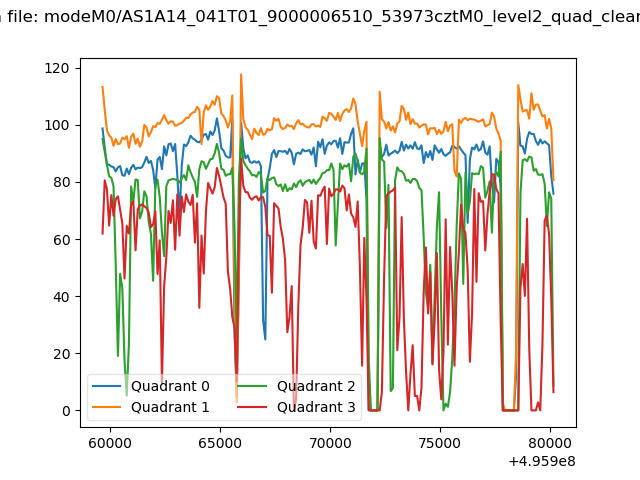
| Quadrant-wise count rates Data is divided into 100 sec bins |
 |
|
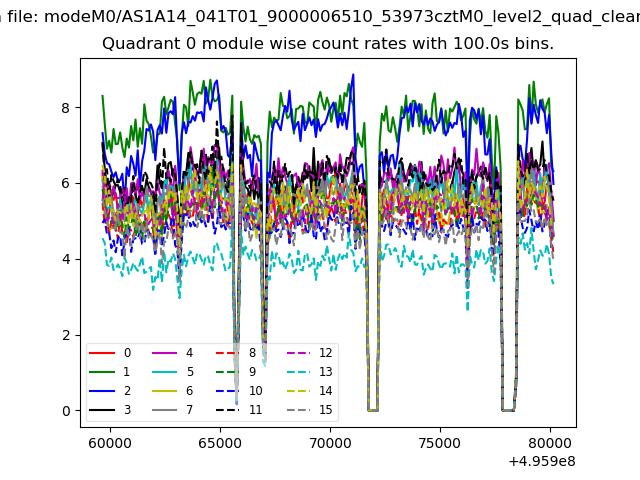
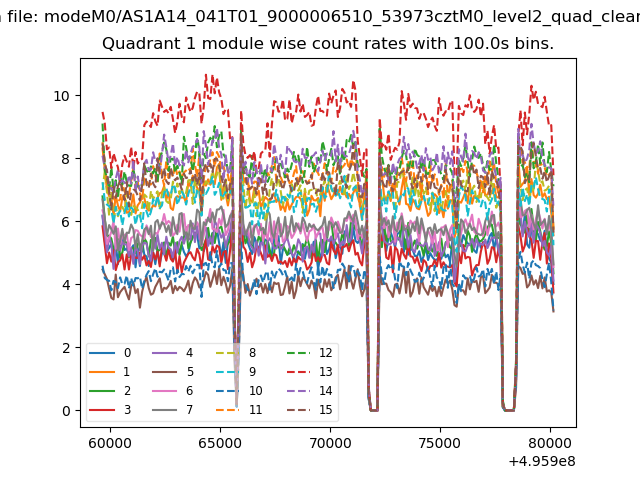
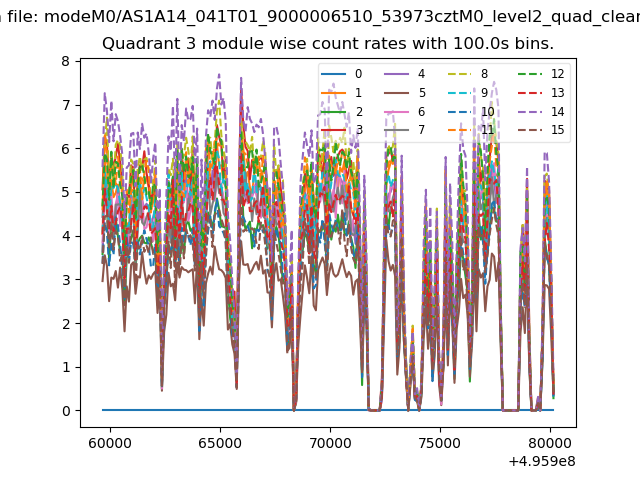
| Module-wise count rates for Quadrant A Data is divided into 100 sec bins |
 |
 |
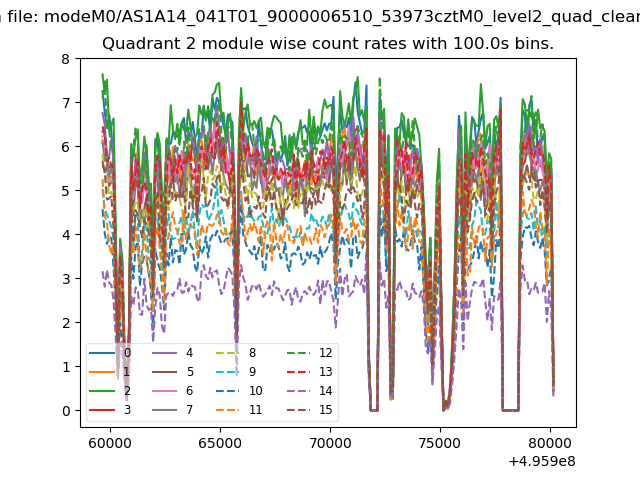
| Module-wise count rates for Quadrant B Data is divided into 100 sec bins |
 |
 |
| Module-wise count rates for Quadrant C Data is divided into 100 sec bins |
 |
 |
| Module-wise count rates for Quadrant D Data is divided into 100 sec bins |
 |
 |
| Parameter | Plot |
|---|---|
| CZT HV Monitor | 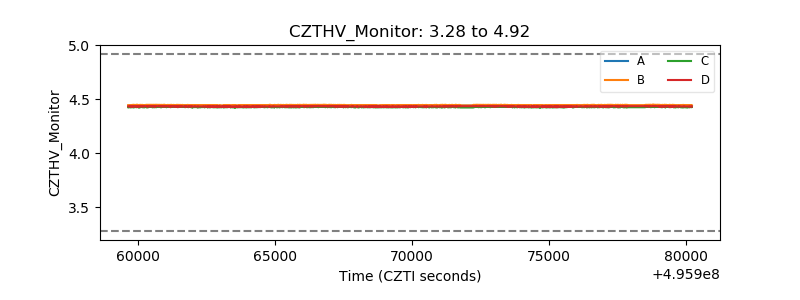 |
| D_VDD | 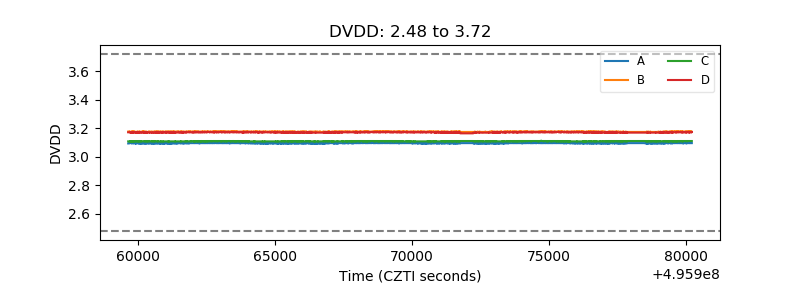 |
| Temperature 1 | 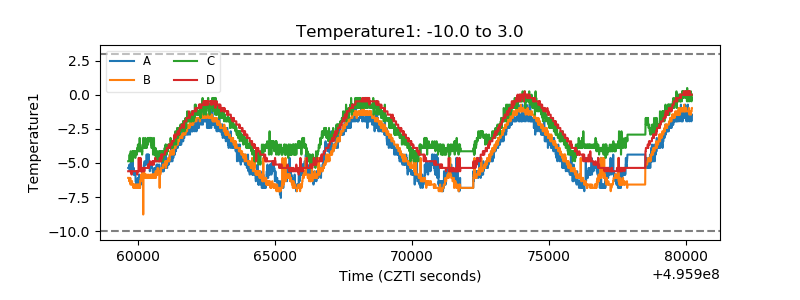 |
| Veto HV Monitor |  |
| Veto LLD | 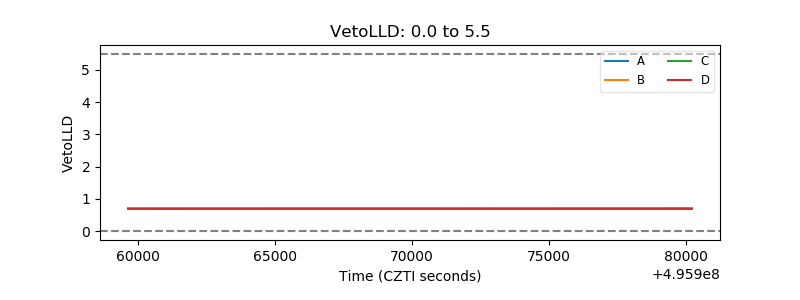 |
| Alpha Counter | 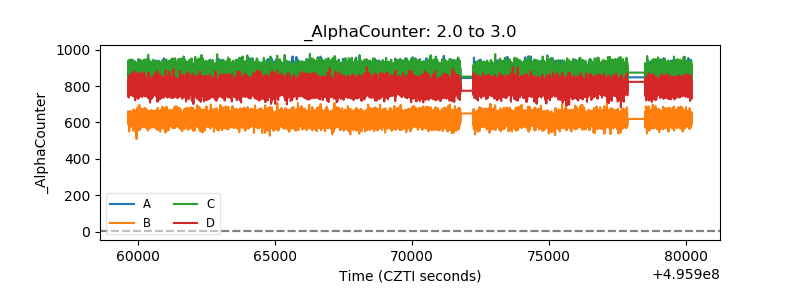 |
| _CPM_Rate | 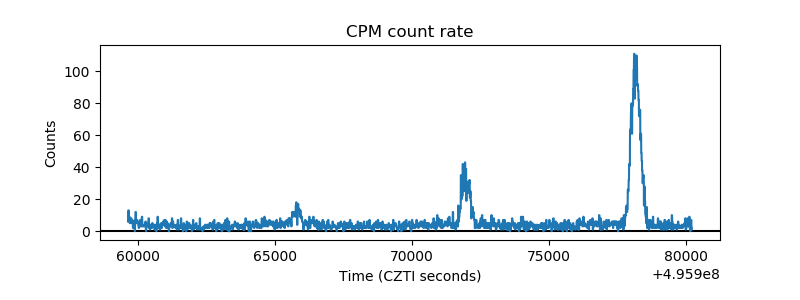 |
| CZT Counter | 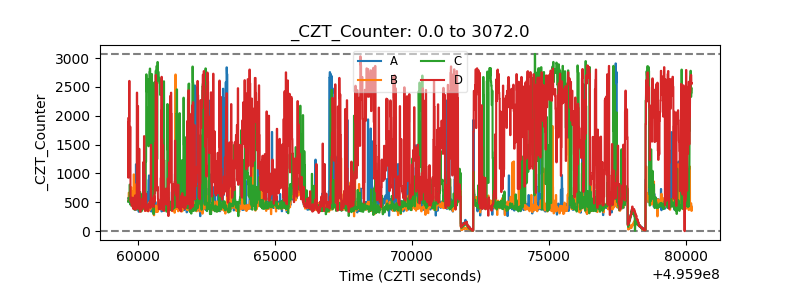 |
| +2.5 Volts monitor |  |
| +5 Volts monitor |  |
| _ROLL_ROT | 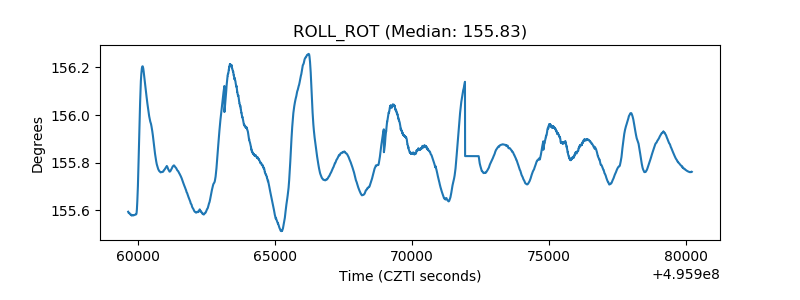 |
| _Roll_DEC | 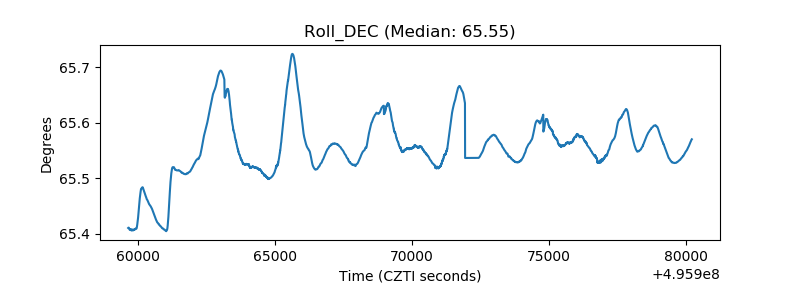 |
| _Roll_RA | 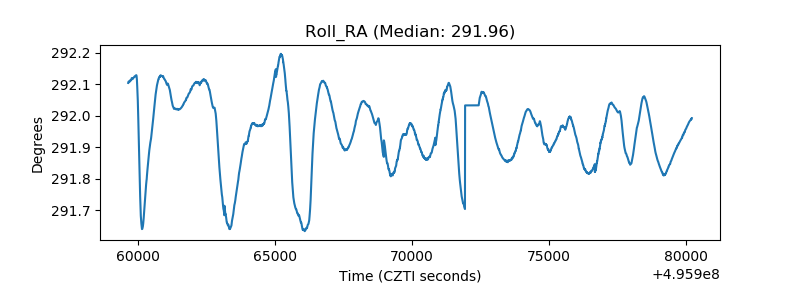 |
| Veto Counter | 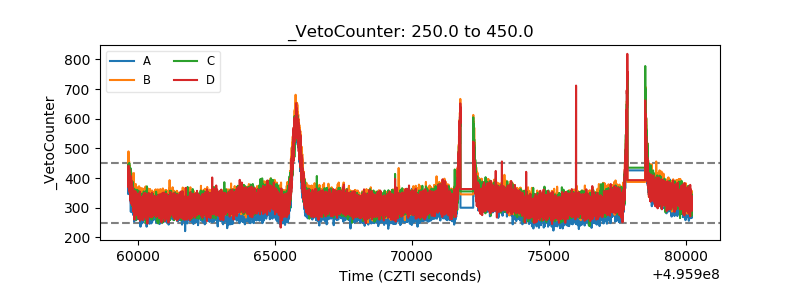 |