| Param | Original file | Final file |
|---|---|---|
| Filename | modeM0/AS1A14_041T01_9000006510_53974cztM0_level2.fits | modeM0/AS1A14_041T01_9000006510_53974cztM0_level2_quad_clean.evt |
| Size (bytes) | 788,584,320 | 72,771,840 |
| Size | 752.1 MB | 69.4 MB |
| Events in quadrant A | 3,287,156 | 595,711 |
| Events in quadrant B | 4,475,702 | 615,543 |
| Events in quadrant C | 8,943,685 | 318,842 |
| Events in quadrant D | 11,998,648 | 236,385 |
| Mode M9 | |||
|---|---|---|---|
| Quadrant | BADHDUFLAG | Total packets | Discarded packets |
| A | 0 | 9 | 0 |
| B | 0 | 9 | 0 |
| C | 0 | 9 | 0 |
| D | 0 | 9 | 0 |
| Mode SS | |||
|---|---|---|---|
| Quadrant | BADHDUFLAG | Total packets | Discarded packets |
| A | 0 | 126 | 0 |
| B | 0 | 126 | 0 |
| C | 0 | 126 | 0 |
| D | 0 | 126 | 0 |
| Mode M0 | |||
|---|---|---|---|
| Quadrant | BADHDUFLAG | Total packets | Discarded packets |
| A | 0 | 14467 | 1 |
| B | 0 | 17710 | 1 |
| C | 0 | 31104 | 9 |
| D | 0 | 39955 | 1 |
| Quadrant | Total seconds | Saturated seconds | Saturation percentage |
|---|---|---|---|
| A | 6258 | 129 | 2.061361% |
| B | 6258 | 409 | 6.535634% |
| C | 6258 | 2743 | 43.831895% |
| D | 6259 | 3775 | 60.313149% |
Noise dominated data is calculated using 1-second bins in cleaned event files. If a bin has >2000 counts, and if more than 50% of those come from <1% of pixels, then it is considered to be noise-dominated and hence unusable.
| Quadrant | # 1 sec bins | Bins with >0 counts | Bins with >2000 counts | High rate bins dominated by noise | Noise dominated (total time) | Noise dominated (detector-on time) | Marked lightcurve |
|---|---|---|---|---|---|---|---|
| A | 7138 | 6259 | 53 | 53 | 0.74% | 0.85% | 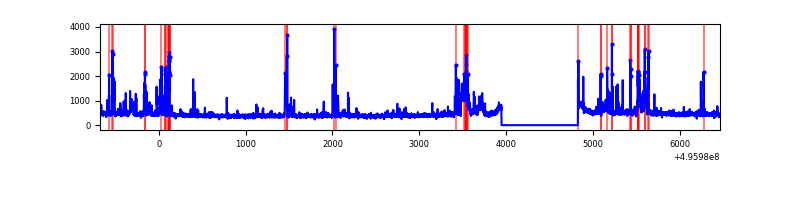 |
| B | 7138 | 6259 | 335 | 335 | 4.69% | 5.35% | 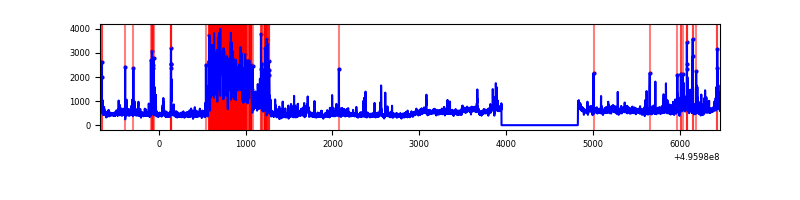 |
| C | 7139 | 6258 | 2630 | 2630 | 36.84% | 42.03% | 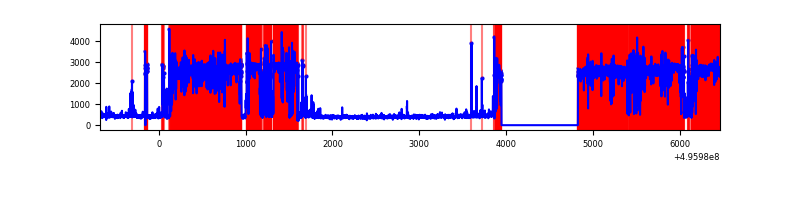 |
| D | 7138 | 6259 | 3107 | 3107 | 43.53% | 49.64% | 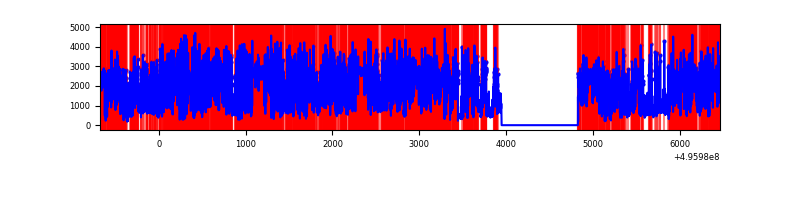 |
Top three noisy pixels from each quadrant. If the there are fewer than three noisy pixels in the level2.evt file, extra rows are filled as -1
| Pixel properties | Quadrant properties | ||||||
|---|---|---|---|---|---|---|---|
| Quadrant | DetID | PixID | Counts | Sigma | Mean | Median | Sigma |
| A | 15 | 174 | 391096 | 2394.4 | 659 | 643 | 163.1 |
| A | 7 | 14 | 140541 | 857.91 | 659 | 643 | 163.1 |
| A | 0 | 8 | 84078 | 511.65 | 659 | 643 | 163.1 |
| B | 0 | 155 | 1125039 | 8152.51 | 642 | 621 | 137.9 |
| B | 5 | 250 | 405887 | 2938.35 | 642 | 621 | 137.9 |
| B | 0 | 213 | 126129 | 909.99 | 642 | 621 | 137.9 |
| C | 1 | 241 | 6918915 | 52931.73 | 473 | 467 | 130.7 |
| C | 12 | 2 | 27646 | 207.94 | 473 | 467 | 130.7 |
| C | 12 | 249 | 17138 | 127.55 | 473 | 467 | 130.7 |
| D | 8 | 176 | 8712695 | 73148.72 | 411 | 393 | 119.1 |
| D | 6 | 239 | 527936 | 4429.26 | 411 | 393 | 119.1 |
| D | 3 | 12 | 266741 | 2236.26 | 411 | 393 | 119.1 |
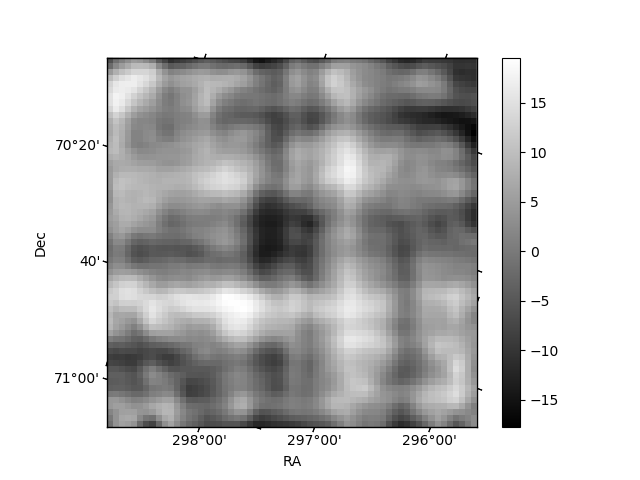
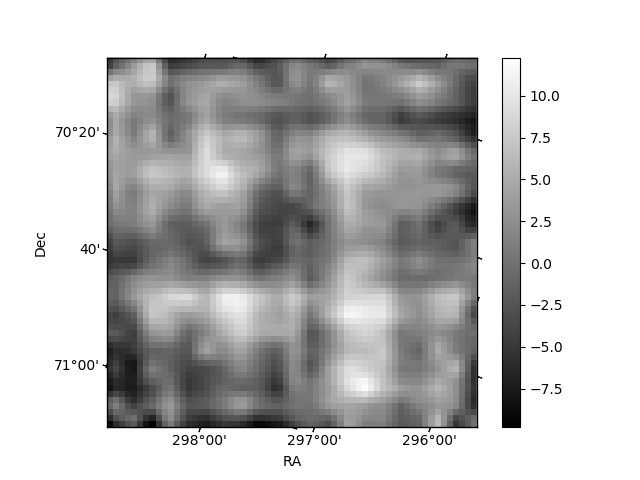
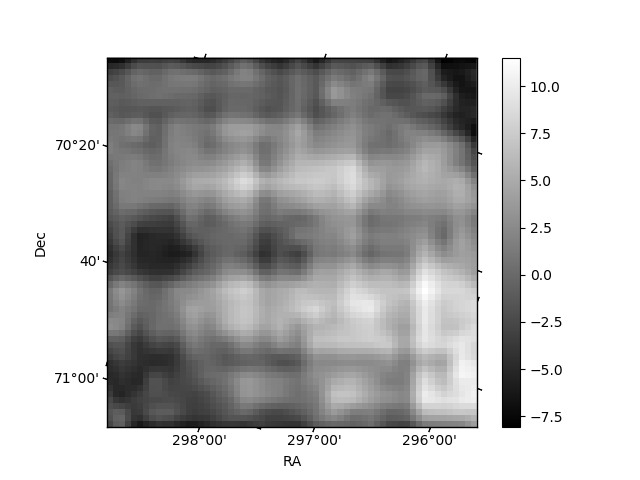
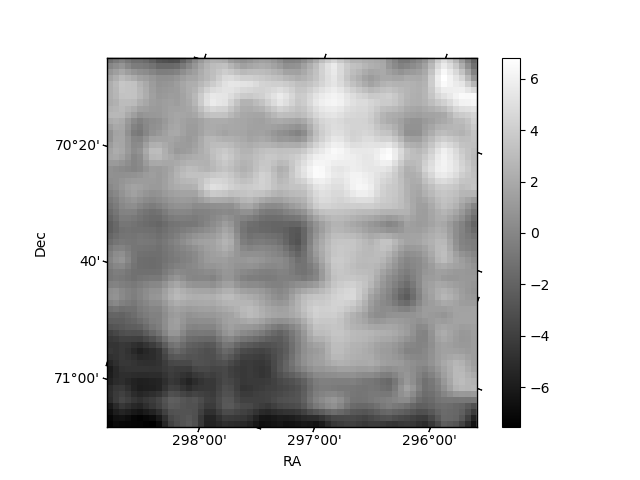
Histogram calculated using DETX and DETY for each event in the final _common_clean file
| Quadrant A | 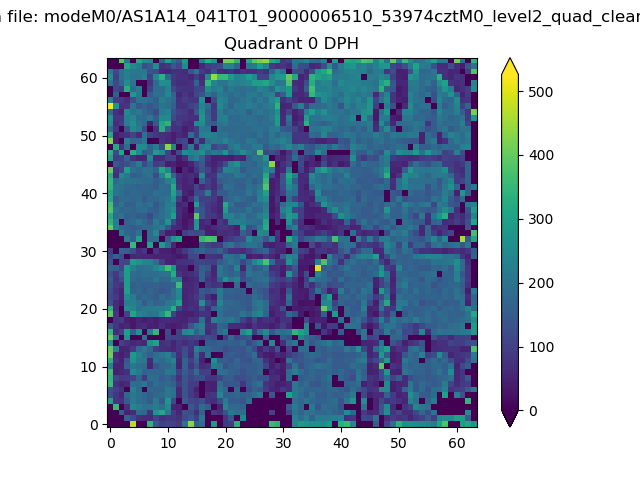 |
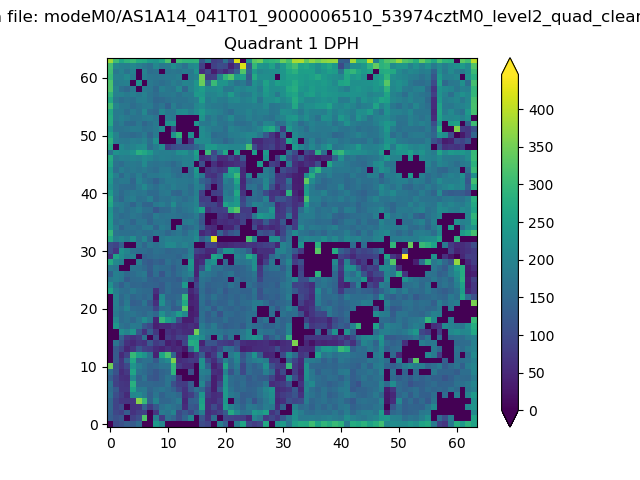 |
Quadrant B |
|---|---|---|---|
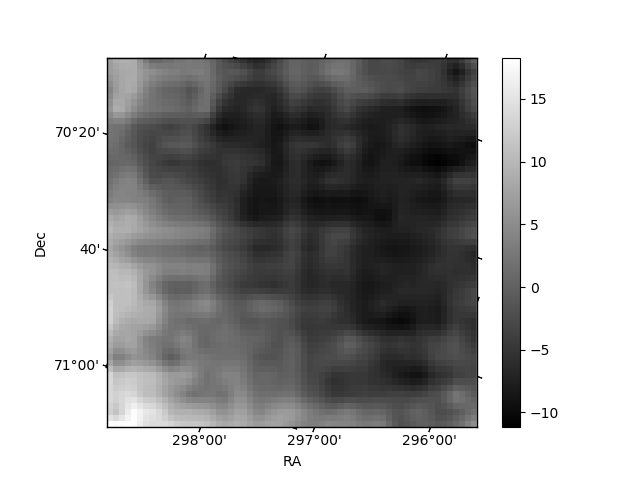
| Quadrant D | 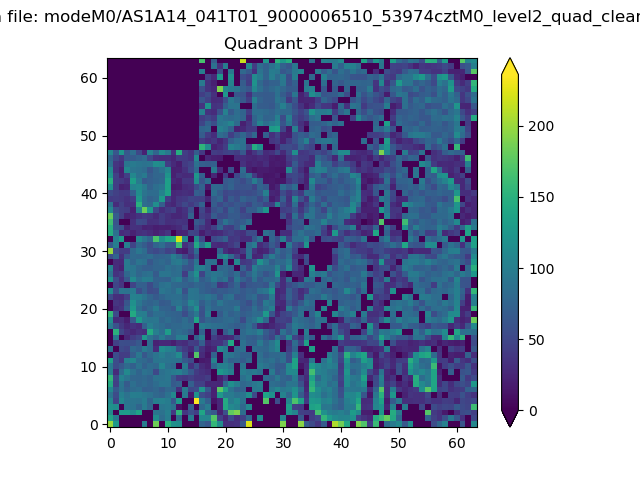 |
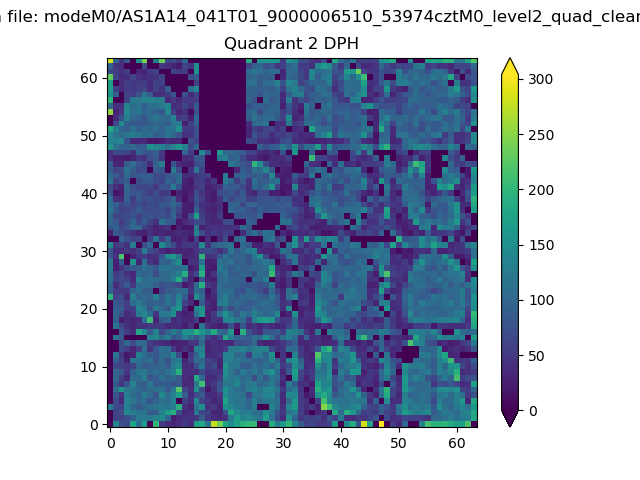 |
Quadrant C |
| Plot type | Count rate plots | Images |
|---|---|---|
| Comparison with Poisson distribution Blue bars denote a histogram of data divided into 1 sec bins. Red curve is a Poisson curve with rate = median count rate of data. |
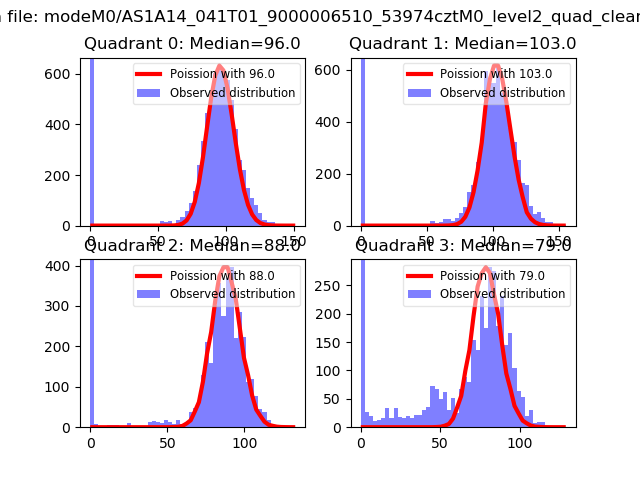 |
 |
| Quadrant-wise count rates Data is divided into 100 sec bins |
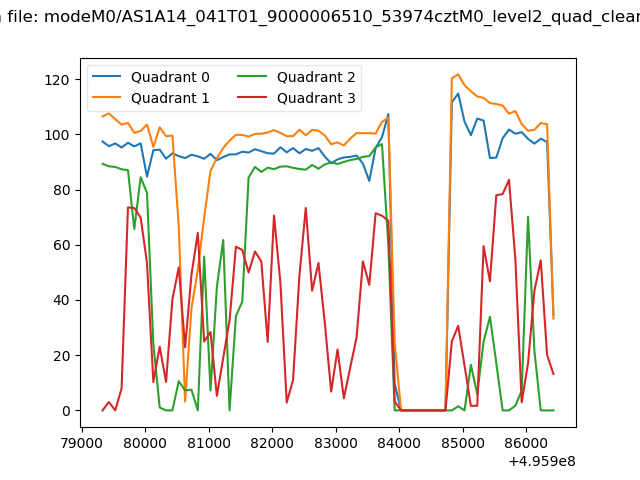 |
|
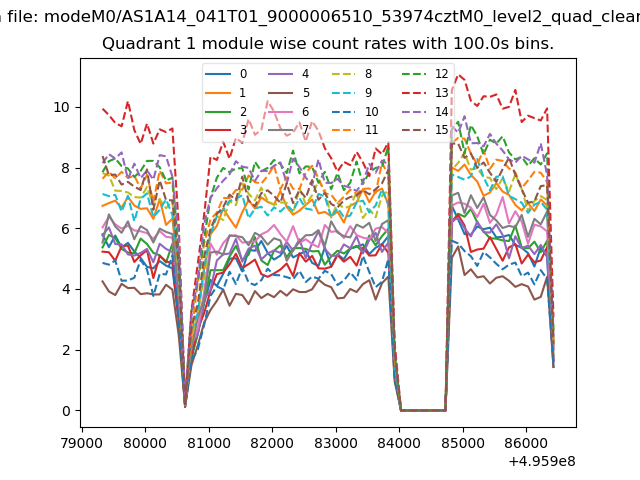
| Module-wise count rates for Quadrant A Data is divided into 100 sec bins |
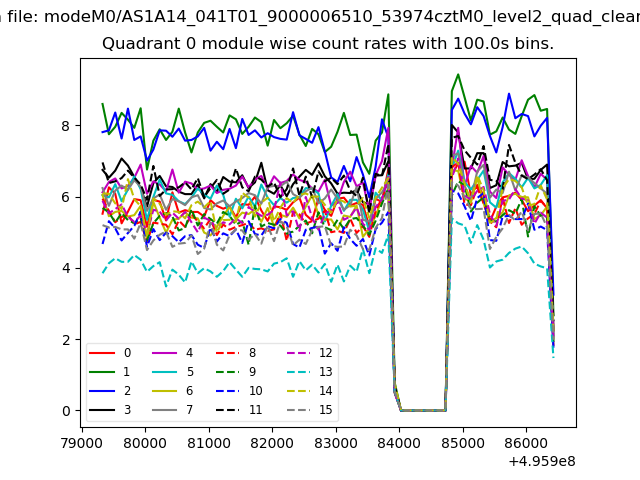 |
 |
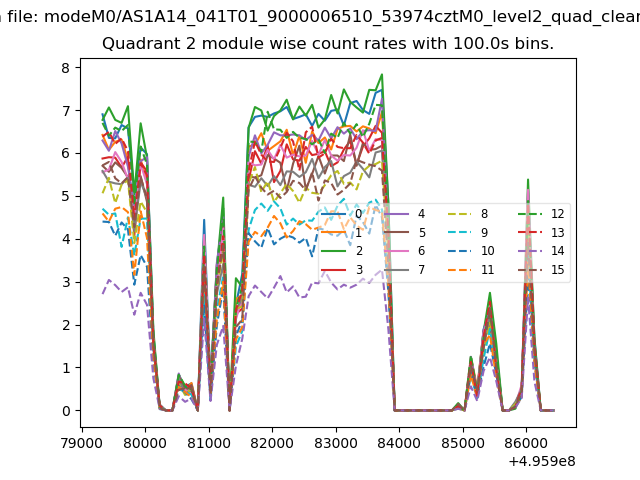
| Module-wise count rates for Quadrant B Data is divided into 100 sec bins |
 |
 |
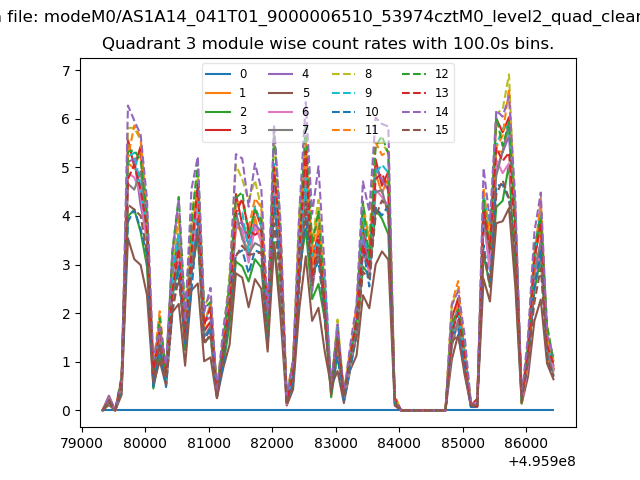
| Module-wise count rates for Quadrant C Data is divided into 100 sec bins |
 |
 |
| Module-wise count rates for Quadrant D Data is divided into 100 sec bins |
 |
 |
| Parameter | Plot |
|---|---|
| CZT HV Monitor | 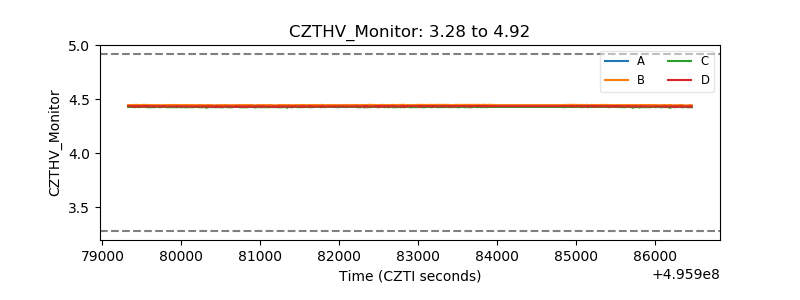 |
| D_VDD | 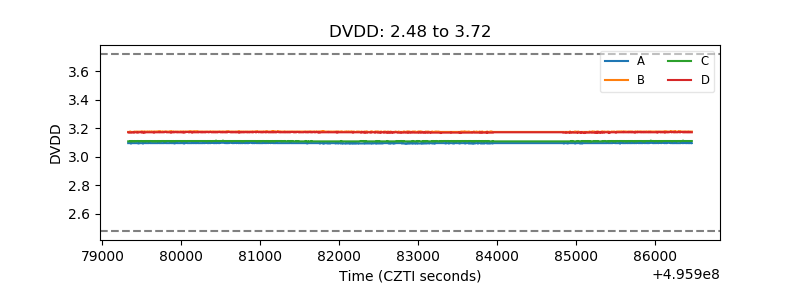 |
| Temperature 1 | 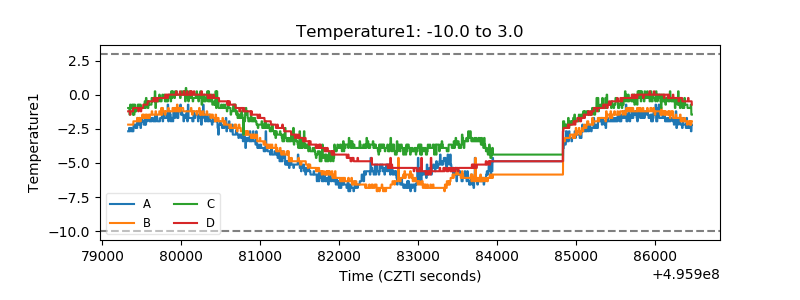 |
| Veto HV Monitor | 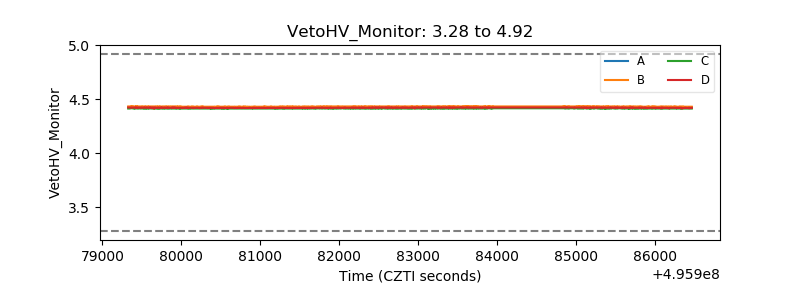 |
| Veto LLD | 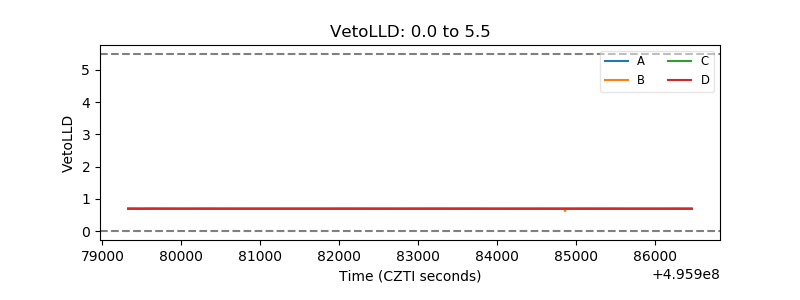 |
| Alpha Counter | 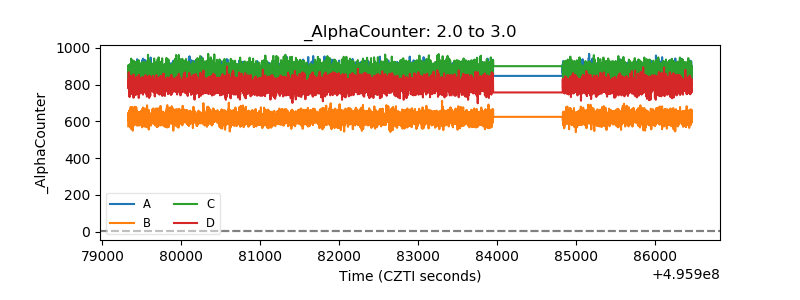 |
| _CPM_Rate | 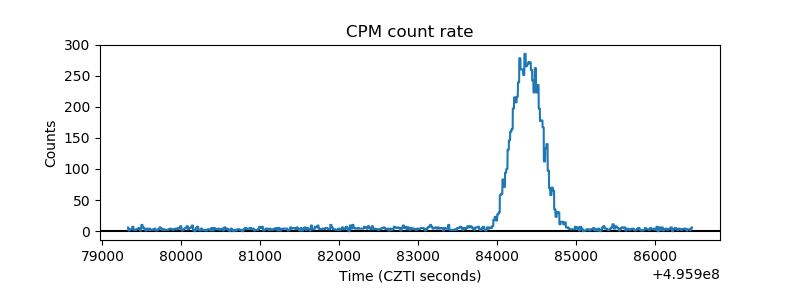 |
| CZT Counter | 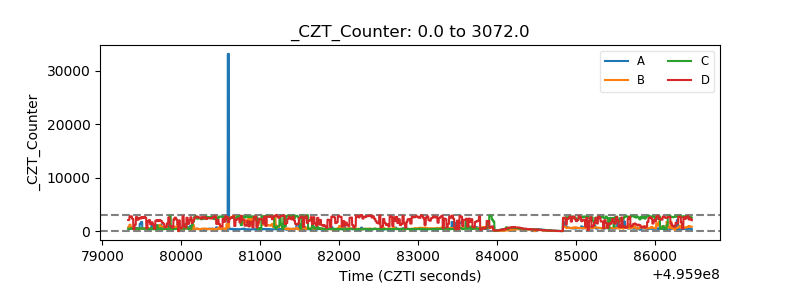 |
| +2.5 Volts monitor |  |
| +5 Volts monitor |  |
| _ROLL_ROT | 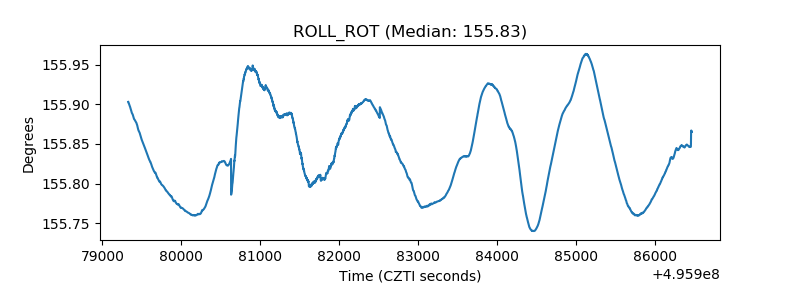 |
| _Roll_DEC | 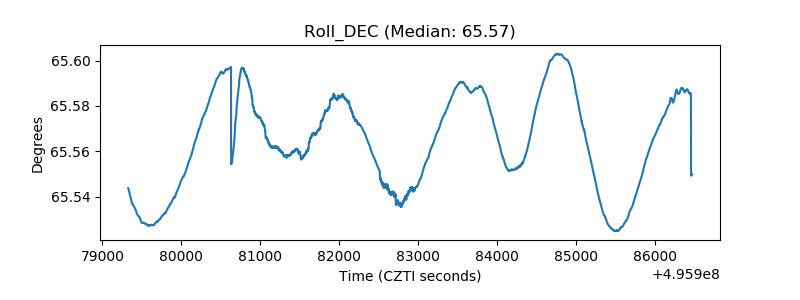 |
| _Roll_RA | 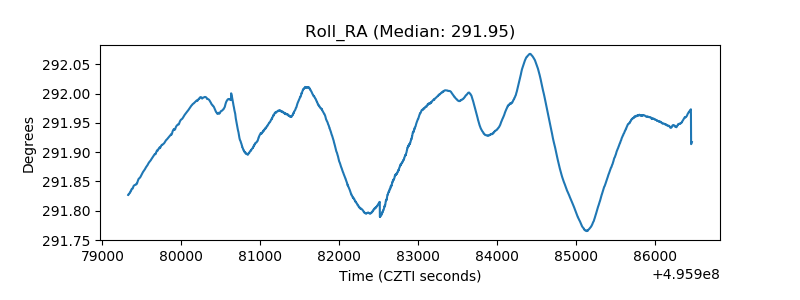 |
| Veto Counter | 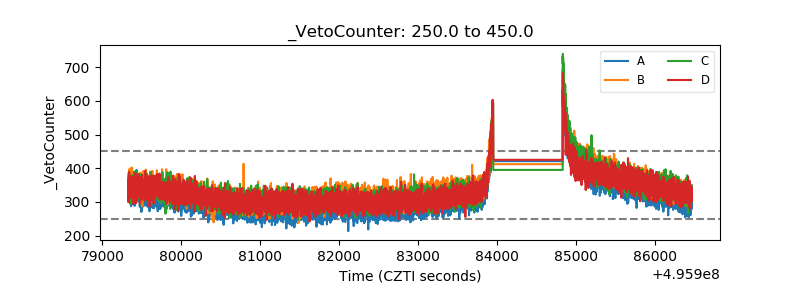 |