| Param | Original file | Final file |
|---|---|---|
| Filename | modeM0/AS1A14_041T01_9000006510_53976cztM0_level2.fits | modeM0/AS1A14_041T01_9000006510_53976cztM0_level2_quad_clean.evt |
| Size (bytes) | 977,376,960 | 64,143,360 |
| Size | 932.1 MB | 61.2 MB |
| Events in quadrant A | 3,186,108 | 607,136 |
| Events in quadrant B | 4,561,844 | 642,768 |
| Events in quadrant C | 14,444,352 | 130,029 |
| Events in quadrant D | 13,502,249 | 124,821 |
| Mode M9 | |||
|---|---|---|---|
| Quadrant | BADHDUFLAG | Total packets | Discarded packets |
| A | 0 | 11 | 0 |
| B | 0 | 11 | 0 |
| C | 0 | 11 | 0 |
| D | 0 | 11 | 0 |
| Mode SS | |||
|---|---|---|---|
| Quadrant | BADHDUFLAG | Total packets | Discarded packets |
| A | 0 | 126 | 0 |
| B | 0 | 126 | 0 |
| C | 0 | 126 | 0 |
| D | 0 | 126 | 0 |
| Mode M0 | |||
|---|---|---|---|
| Quadrant | BADHDUFLAG | Total packets | Discarded packets |
| A | 0 | 14067 | 1 |
| B | 0 | 17985 | 1 |
| C | 0 | 47129 | 1 |
| D | 0 | 44452 | 1 |
| Quadrant | Total seconds | Saturated seconds | Saturation percentage |
|---|---|---|---|
| A | 6267 | 128 | 2.042445% |
| B | 6267 | 320 | 5.106111% |
| C | 6267 | 5000 | 79.782990% |
| D | 6267 | 4968 | 79.272379% |
Noise dominated data is calculated using 1-second bins in cleaned event files. If a bin has >2000 counts, and if more than 50% of those come from <1% of pixels, then it is considered to be noise-dominated and hence unusable.
| Quadrant | # 1 sec bins | Bins with >0 counts | Bins with >2000 counts | High rate bins dominated by noise | Noise dominated (total time) | Noise dominated (detector-on time) | Marked lightcurve |
|---|---|---|---|---|---|---|---|
| A | 7302 | 6268 | 74 | 74 | 1.01% | 1.18% | 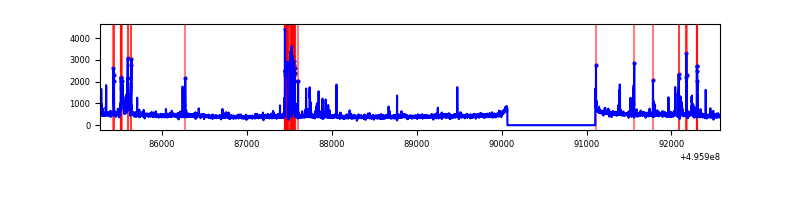 |
| B | 7302 | 6268 | 237 | 237 | 3.25% | 3.78% | 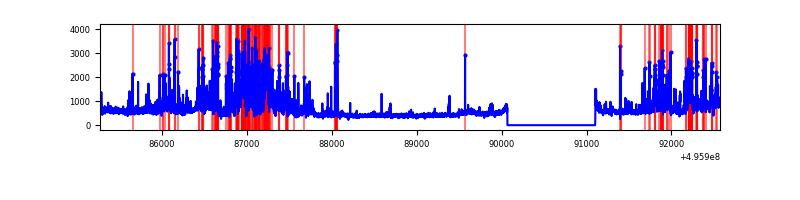 |
| C | 7302 | 6267 | 4870 | 4870 | 66.69% | 77.71% | 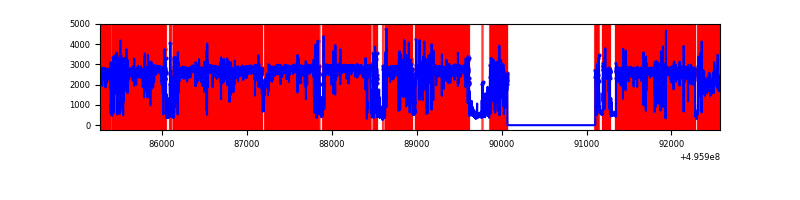 |
| D | 7302 | 6267 | 4193 | 4193 | 57.42% | 66.91% | 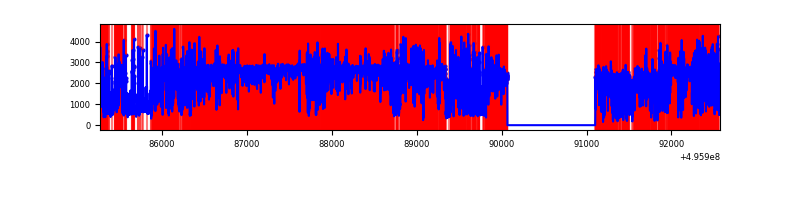 |
Top three noisy pixels from each quadrant. If the there are fewer than three noisy pixels in the level2.evt file, extra rows are filled as -1
| Pixel properties | Quadrant properties | ||||||
|---|---|---|---|---|---|---|---|
| Quadrant | DetID | PixID | Counts | Sigma | Mean | Median | Sigma |
| A | 15 | 174 | 291296 | 1770.89 | 662 | 645 | 164.1 |
| A | 7 | 14 | 94356 | 570.97 | 662 | 645 | 164.1 |
| A | 4 | 254 | 41209 | 247.15 | 662 | 645 | 164.1 |
| B | 0 | 155 | 923255 | 6566.79 | 654 | 630 | 140.5 |
| B | 5 | 250 | 382881 | 2720.67 | 654 | 630 | 140.5 |
| B | 0 | 213 | 359320 | 2552.98 | 654 | 630 | 140.5 |
| C | 1 | 241 | 12594686 | 128064.2 | 353 | 350 | 98.3 |
| C | 15 | 209 | 250764 | 2546.31 | 353 | 350 | 98.3 |
| C | 12 | 252 | 70854 | 716.91 | 353 | 350 | 98.3 |
| D | 8 | 176 | 9881515 | 122304.18 | 281 | 268 | 80.8 |
| D | 10 | 172 | 1021689 | 12642.54 | 281 | 268 | 80.8 |
| D | 12 | 2 | 980332 | 12130.65 | 281 | 268 | 80.8 |
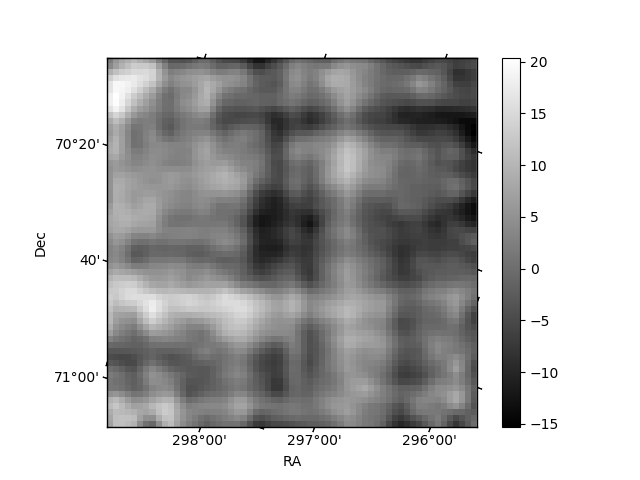
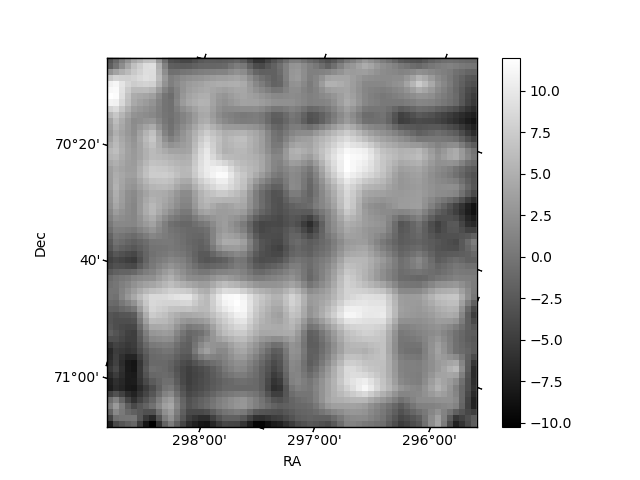
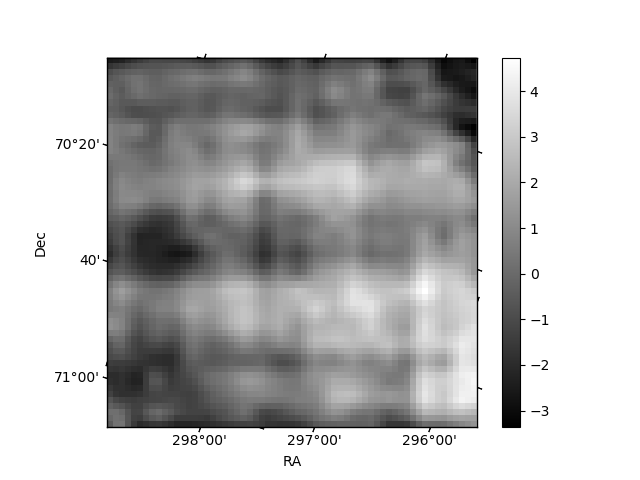
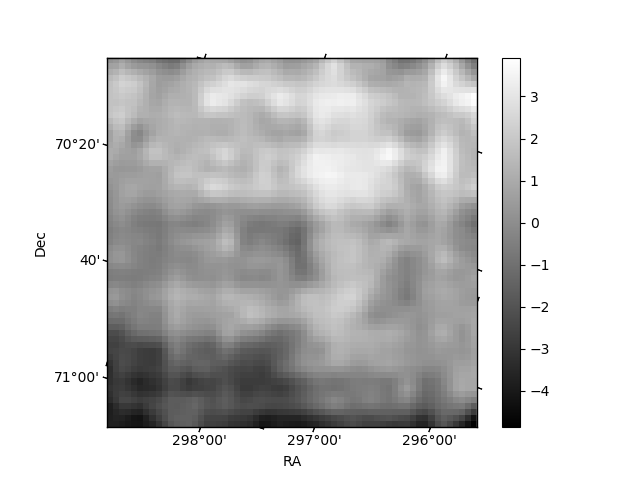
Histogram calculated using DETX and DETY for each event in the final _common_clean file
| Quadrant A | 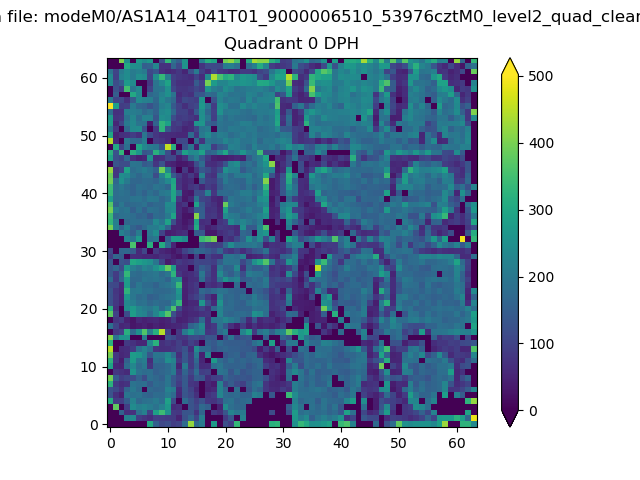 |
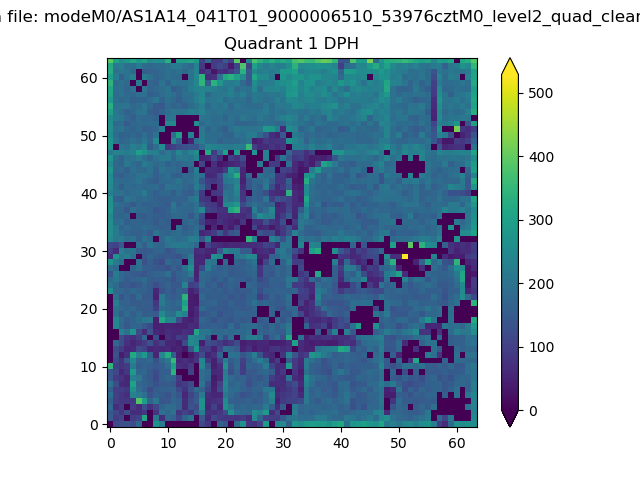 |
Quadrant B |
|---|---|---|---|
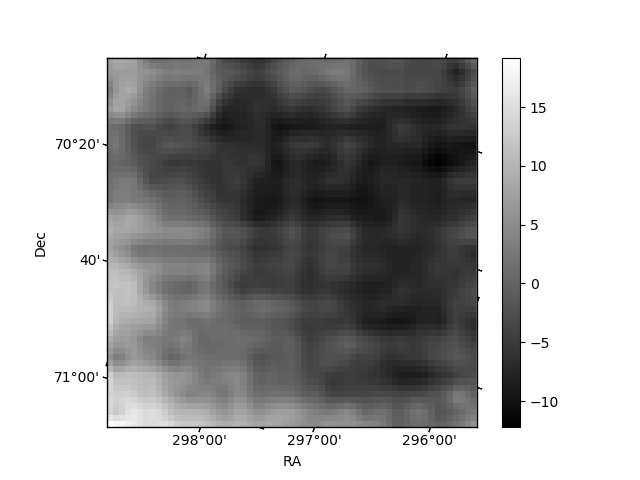
| Quadrant D | 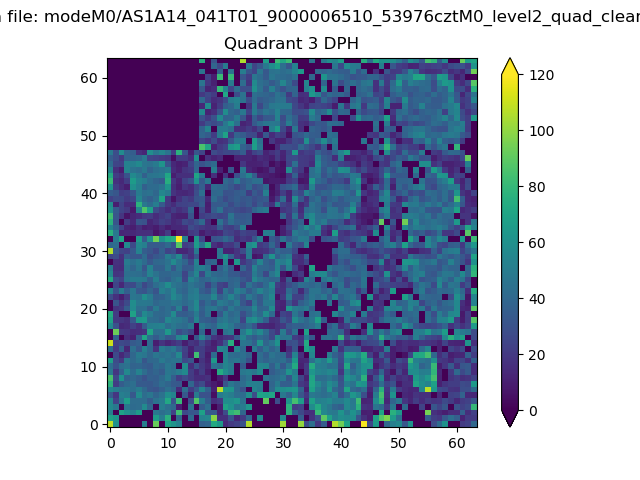 |
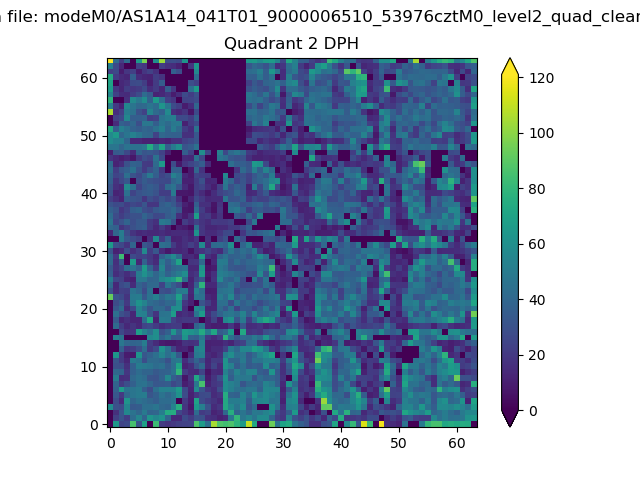 |
Quadrant C |
| Plot type | Count rate plots | Images |
|---|---|---|
| Comparison with Poisson distribution Blue bars denote a histogram of data divided into 1 sec bins. Red curve is a Poisson curve with rate = median count rate of data. |
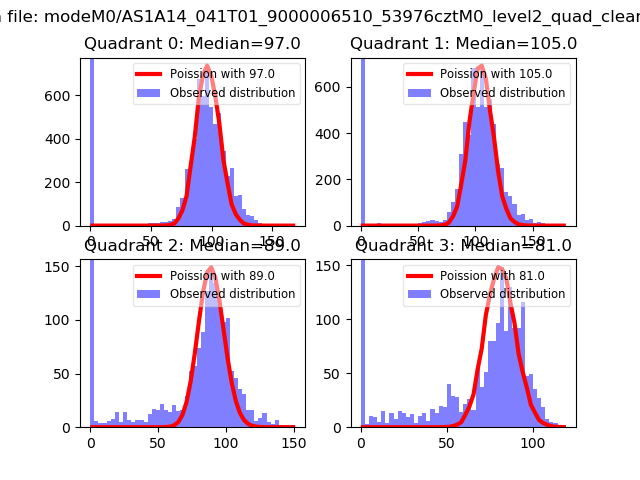 |
 |
| Quadrant-wise count rates Data is divided into 100 sec bins |
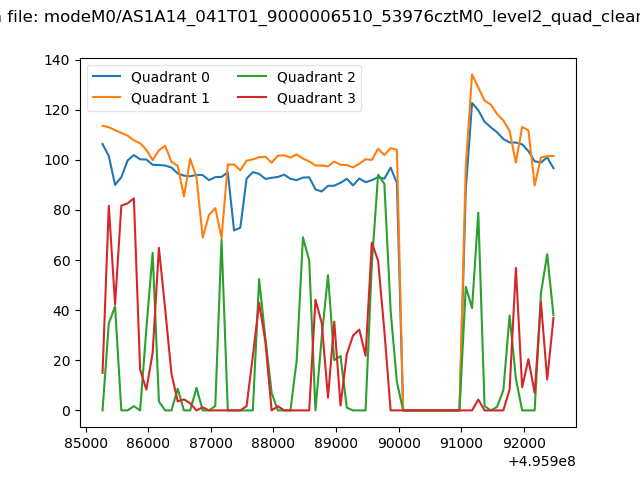 |
|
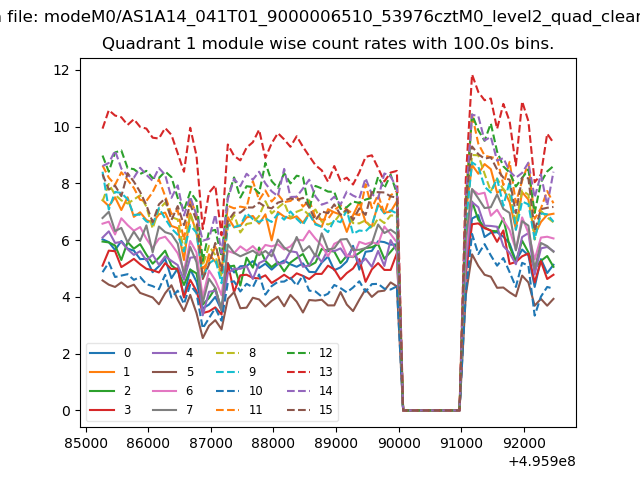
| Module-wise count rates for Quadrant A Data is divided into 100 sec bins |
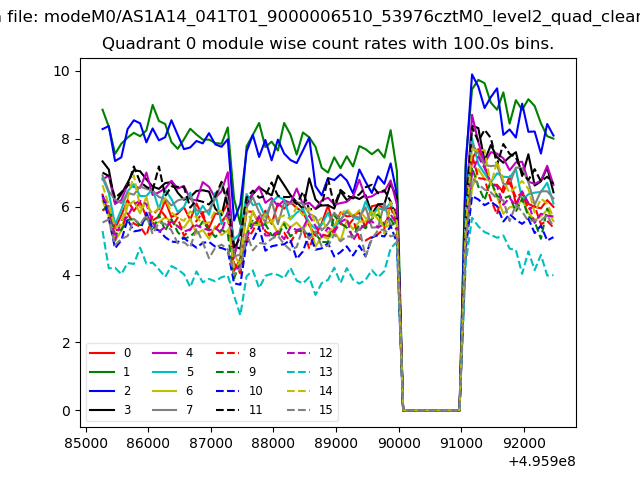 |
 |
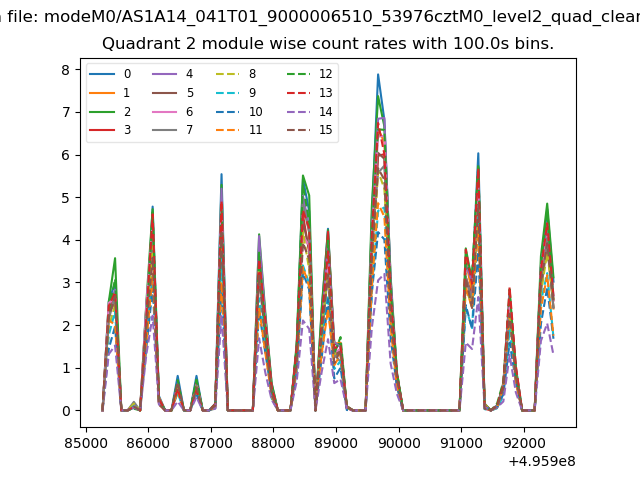
| Module-wise count rates for Quadrant B Data is divided into 100 sec bins |
 |
 |
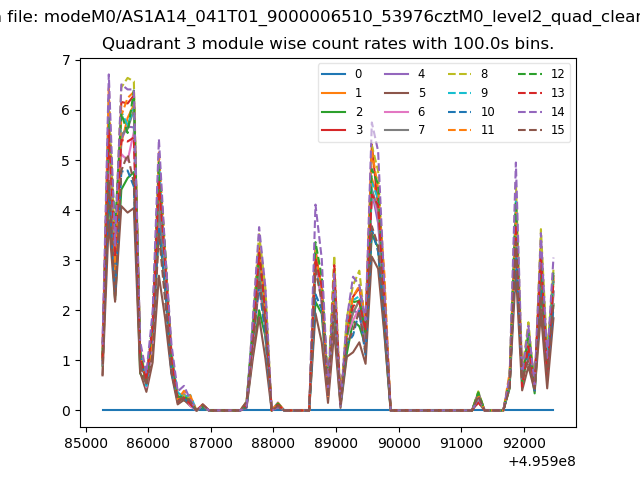
| Module-wise count rates for Quadrant C Data is divided into 100 sec bins |
 |
 |
| Module-wise count rates for Quadrant D Data is divided into 100 sec bins |
 |
 |
| Parameter | Plot |
|---|---|
| CZT HV Monitor | 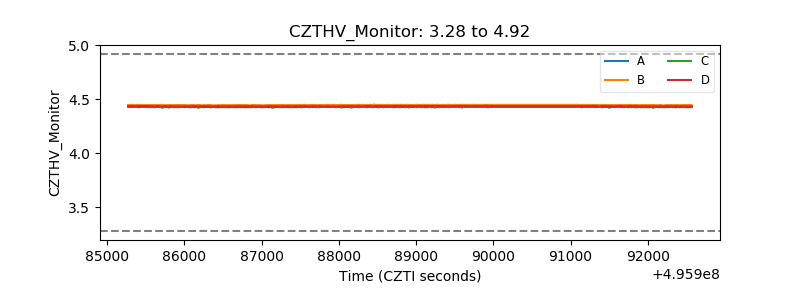 |
| D_VDD | 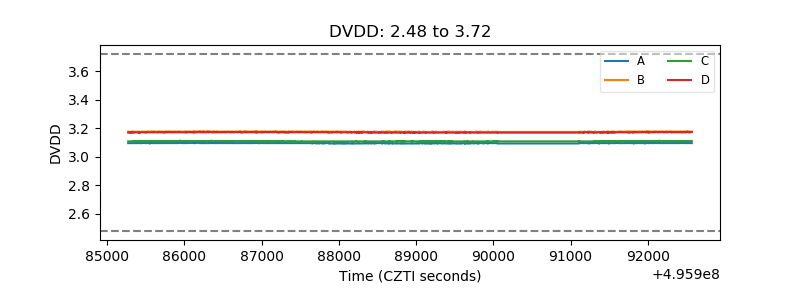 |
| Temperature 1 | 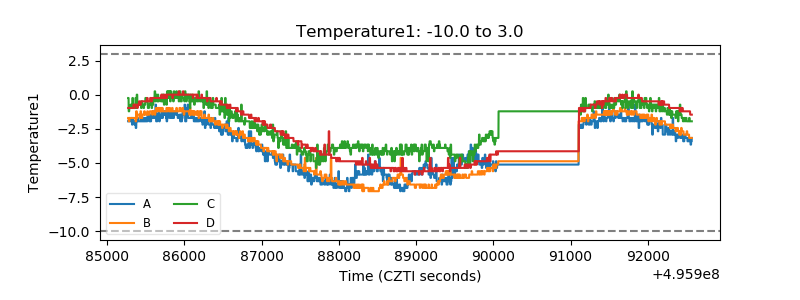 |
| Veto HV Monitor | 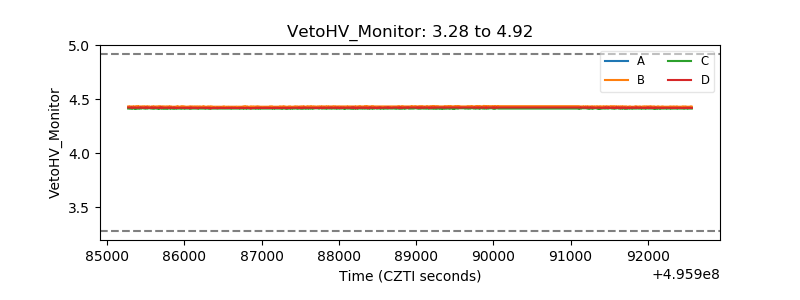 |
| Veto LLD | 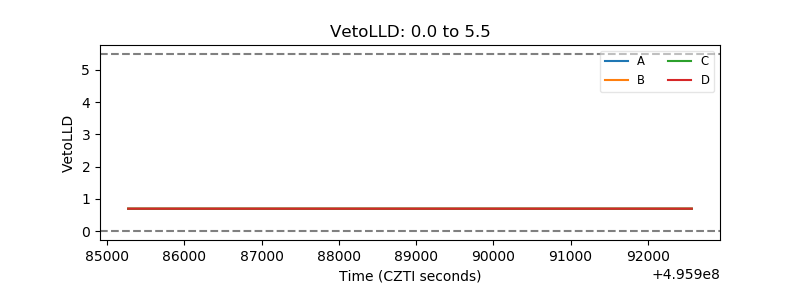 |
| Alpha Counter | 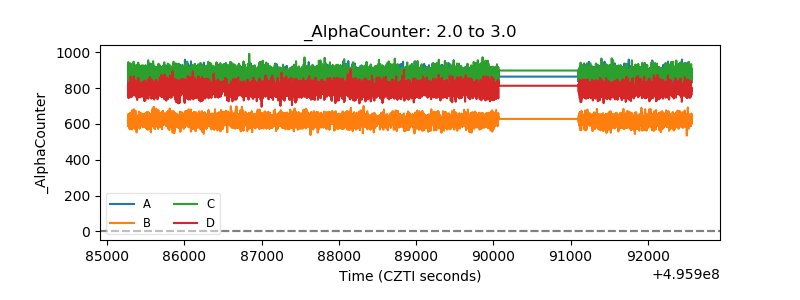 |
| _CPM_Rate | 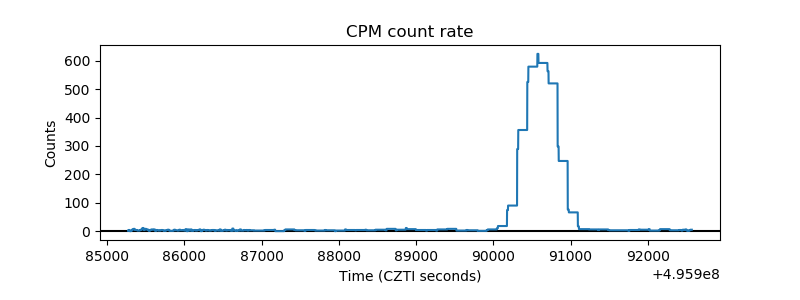 |
| CZT Counter | 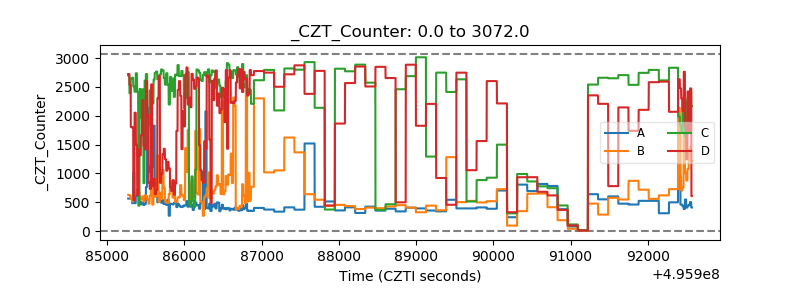 |
| +2.5 Volts monitor |  |
| +5 Volts monitor | 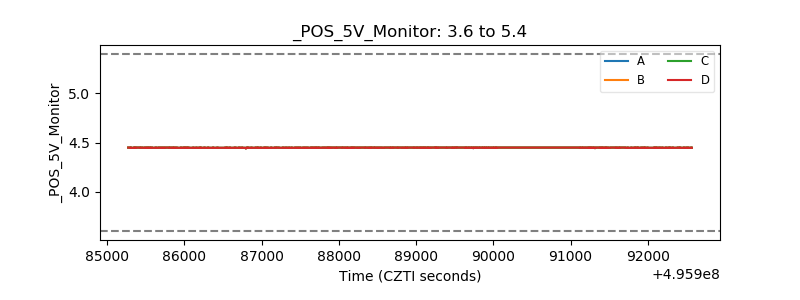 |
| _ROLL_ROT | 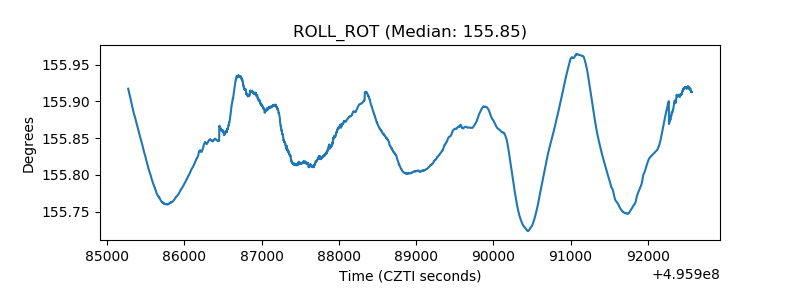 |
| _Roll_DEC | 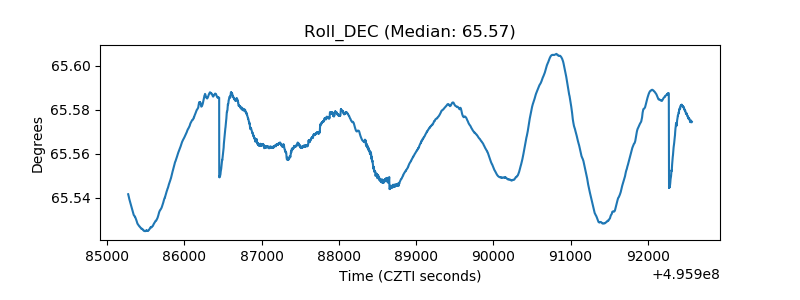 |
| _Roll_RA | 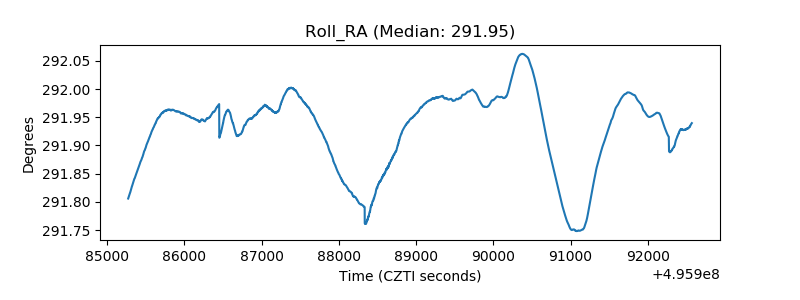 |
| Veto Counter | 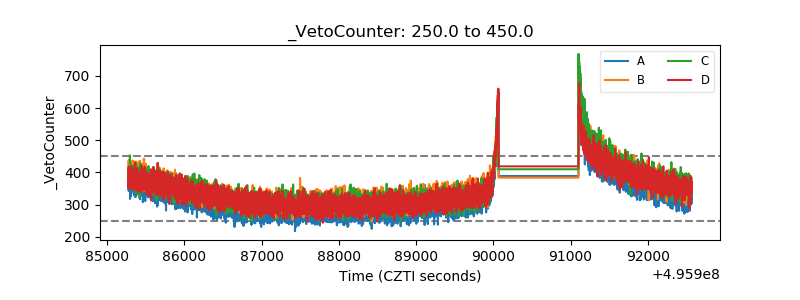 |