| Param | Original file | Final file |
|---|---|---|
| Filename | modeM0/AS1A14_041T01_9000006510_53977cztM0_level2.fits | modeM0/AS1A14_041T01_9000006510_53977cztM0_level2_quad_clean.evt |
| Size (bytes) | 761,731,200 | 73,624,320 |
| Size | 726.4 MB | 70.2 MB |
| Events in quadrant A | 2,932,665 | 601,643 |
| Events in quadrant B | 4,526,368 | 626,579 |
| Events in quadrant C | 8,200,379 | 387,736 |
| Events in quadrant D | 12,069,931 | 192,138 |
| Mode M9 | |||
|---|---|---|---|
| Quadrant | BADHDUFLAG | Total packets | Discarded packets |
| A | 0 | 11 | 0 |
| B | 0 | 11 | 0 |
| C | 0 | 11 | 0 |
| D | 0 | 11 | 0 |
| Mode SS | |||
|---|---|---|---|
| Quadrant | BADHDUFLAG | Total packets | Discarded packets |
| A | 0 | 122 | 0 |
| B | 0 | 122 | 0 |
| C | 0 | 122 | 0 |
| D | 0 | 122 | 0 |
| Mode M0 | |||
|---|---|---|---|
| Quadrant | BADHDUFLAG | Total packets | Discarded packets |
| A | 0 | 13127 | 1 |
| B | 0 | 17821 | 1 |
| C | 0 | 28573 | 1 |
| D | 0 | 40055 | 1 |
| Quadrant | Total seconds | Saturated seconds | Saturation percentage |
|---|---|---|---|
| A | 6029 | 64 | 1.061536% |
| B | 6029 | 366 | 6.070658% |
| C | 6030 | 2108 | 34.958541% |
| D | 6030 | 4075 | 67.578773% |
Noise dominated data is calculated using 1-second bins in cleaned event files. If a bin has >2000 counts, and if more than 50% of those come from <1% of pixels, then it is considered to be noise-dominated and hence unusable.
| Quadrant | # 1 sec bins | Bins with >0 counts | Bins with >2000 counts | High rate bins dominated by noise | Noise dominated (total time) | Noise dominated (detector-on time) | Marked lightcurve |
|---|---|---|---|---|---|---|---|
| A | 7149 | 6030 | 36 | 36 | 0.50% | 0.60% | 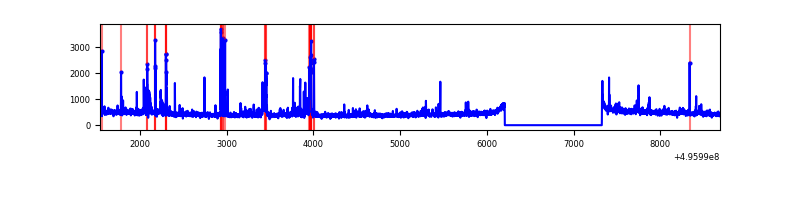 |
| B | 7149 | 6030 | 265 | 265 | 3.71% | 4.39% | 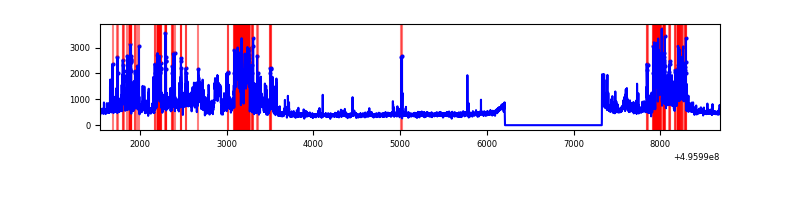 |
| C | 7150 | 6031 | 2015 | 2015 | 28.18% | 33.41% | 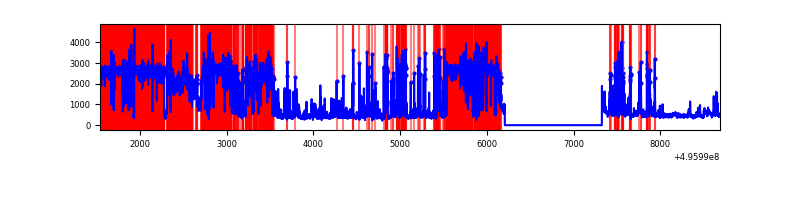 |
| D | 7150 | 6030 | 3578 | 3578 | 50.04% | 59.34% | 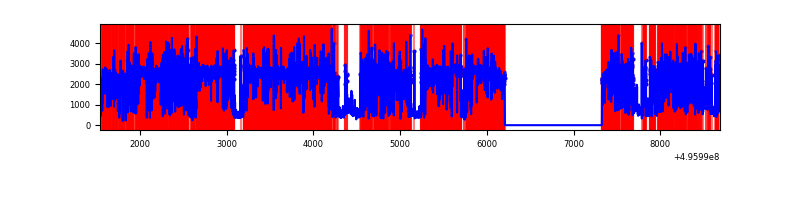 |
Top three noisy pixels from each quadrant. If the there are fewer than three noisy pixels in the level2.evt file, extra rows are filled as -1
| Pixel properties | Quadrant properties | ||||||
|---|---|---|---|---|---|---|---|
| Quadrant | DetID | PixID | Counts | Sigma | Mean | Median | Sigma |
| A | 15 | 174 | 173908 | 1080.59 | 644 | 627 | 160.4 |
| A | 3 | 78 | 91094 | 564.16 | 644 | 627 | 160.4 |
| A | 12 | 17 | 39265 | 240.95 | 644 | 627 | 160.4 |
| B | 0 | 155 | 826489 | 6136.45 | 633 | 613 | 134.6 |
| B | 5 | 250 | 671509 | 4984.92 | 633 | 613 | 134.6 |
| B | 0 | 213 | 361338 | 2680.27 | 633 | 613 | 134.6 |
| C | 1 | 241 | 5411924 | 36579.38 | 527 | 521 | 147.9 |
| C | 12 | 252 | 275612 | 1859.53 | 527 | 521 | 147.9 |
| C | 15 | 209 | 186855 | 1259.56 | 527 | 521 | 147.9 |
| D | 8 | 176 | 10139079 | 102225.57 | 348 | 332 | 99.2 |
| D | 6 | 239 | 188923 | 1901.5 | 348 | 332 | 99.2 |
| D | 13 | 46 | 50230 | 503.1 | 348 | 332 | 99.2 |
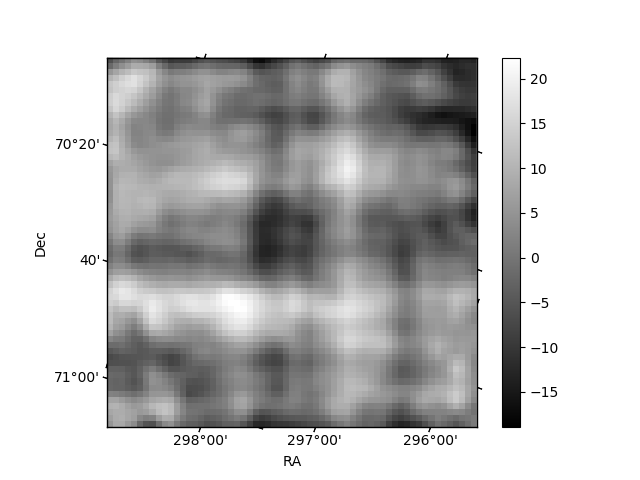
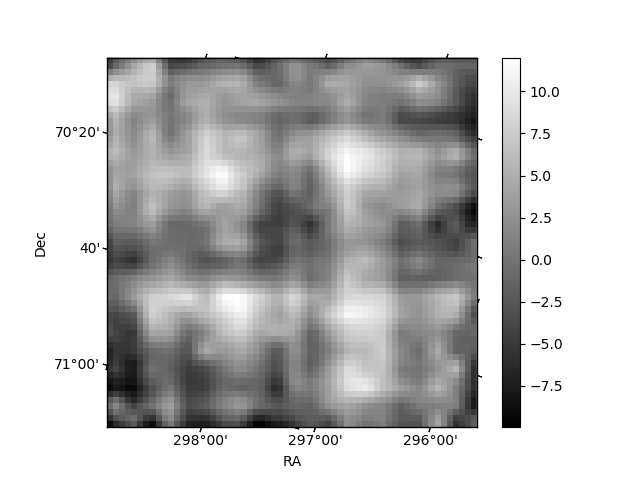
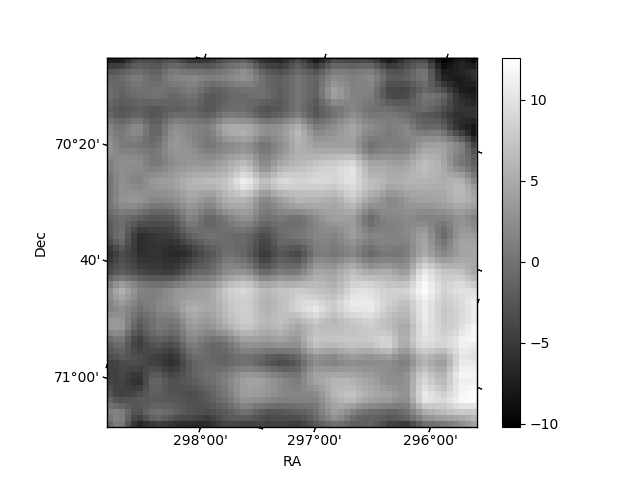
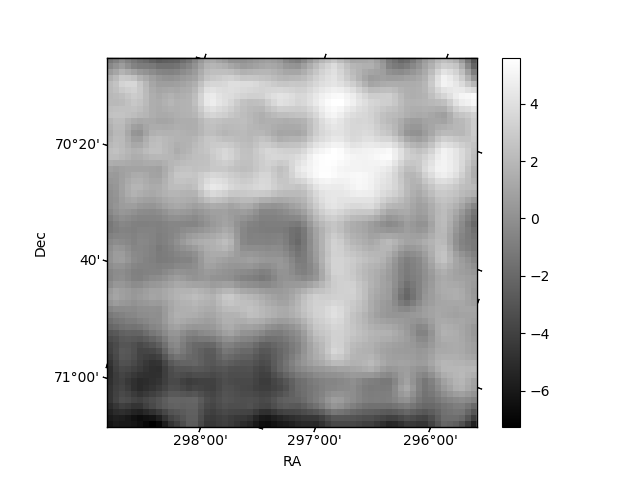
Histogram calculated using DETX and DETY for each event in the final _common_clean file
| Quadrant A | 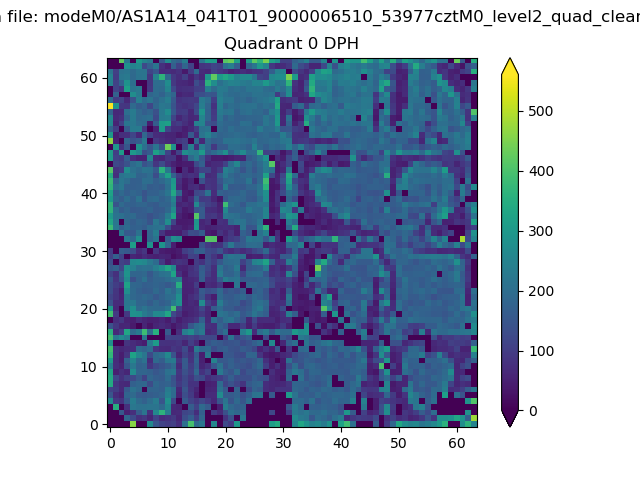 |
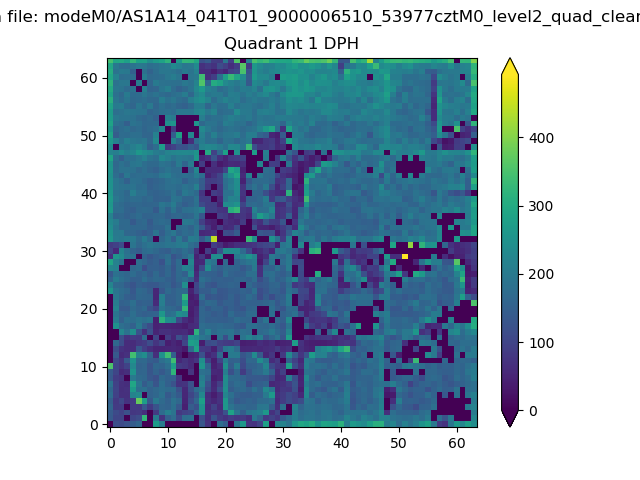 |
Quadrant B |
|---|---|---|---|
| Quadrant D | 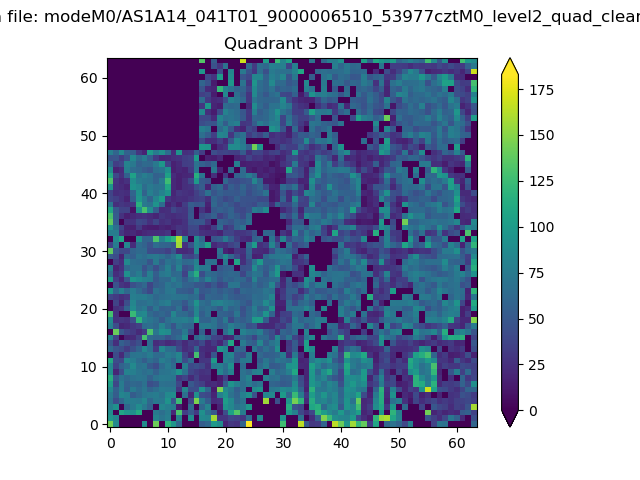 |
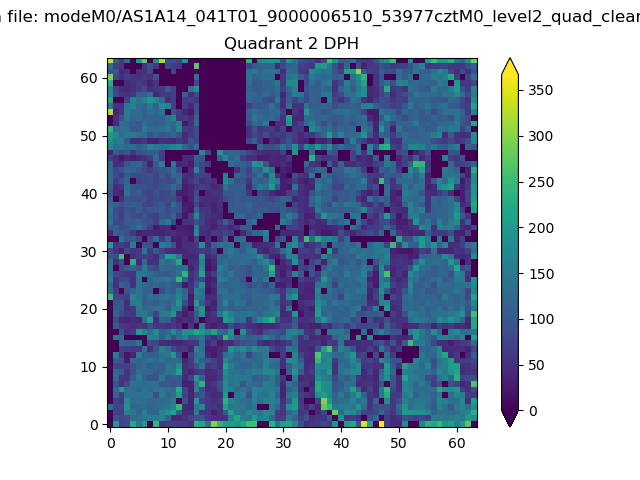 |
Quadrant C |
| Plot type | Count rate plots | Images |
|---|---|---|
| Comparison with Poisson distribution Blue bars denote a histogram of data divided into 1 sec bins. Red curve is a Poisson curve with rate = median count rate of data. |
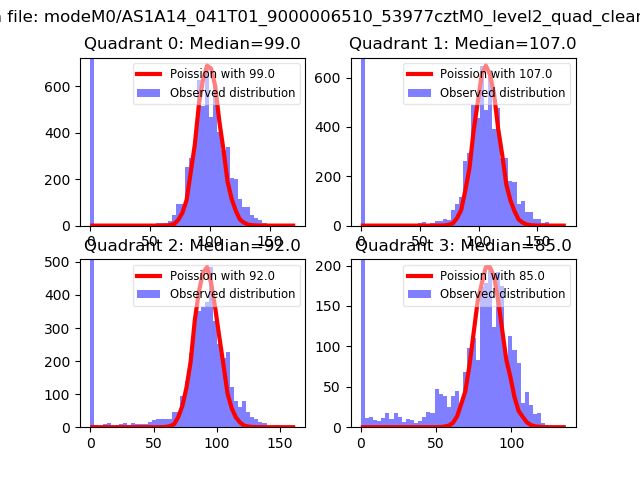 |
 |
| Quadrant-wise count rates Data is divided into 100 sec bins |
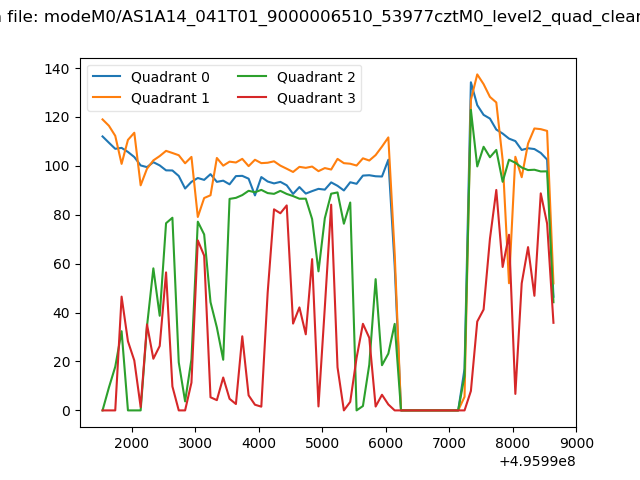 |
|
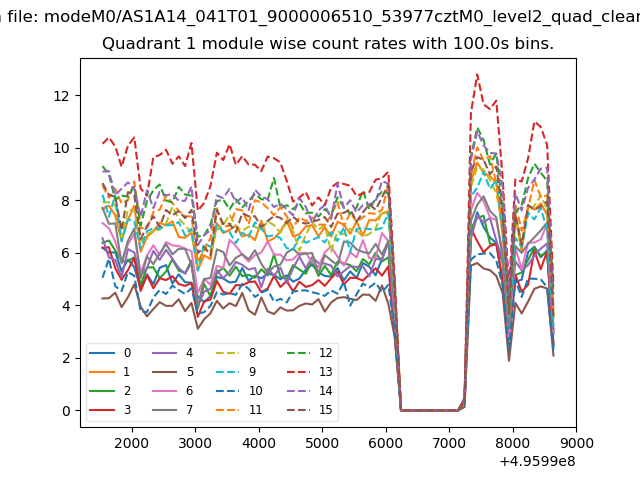
| Module-wise count rates for Quadrant A Data is divided into 100 sec bins |
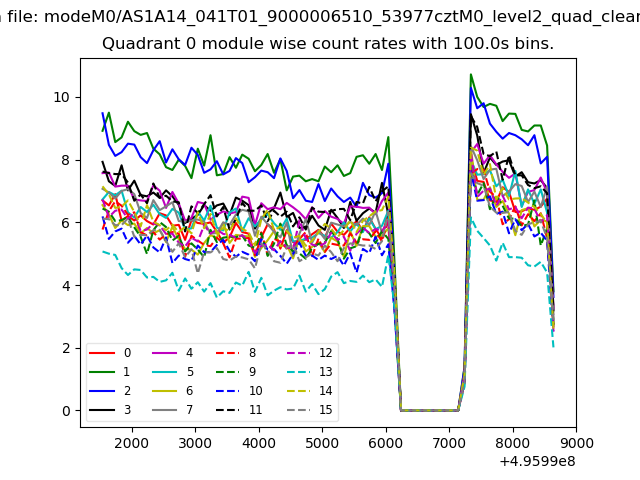 |
 |
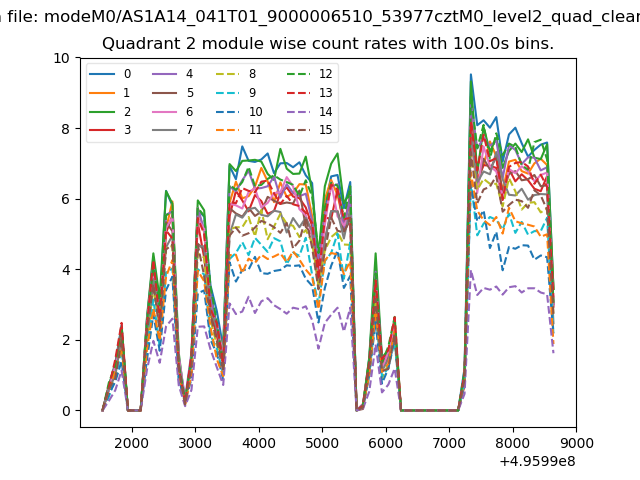
| Module-wise count rates for Quadrant B Data is divided into 100 sec bins |
 |
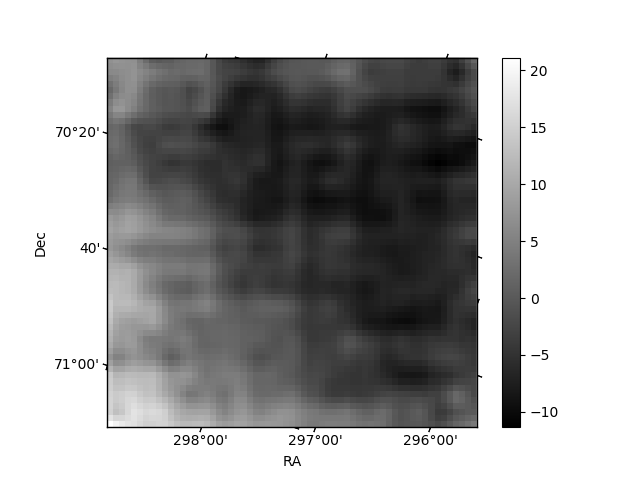 |
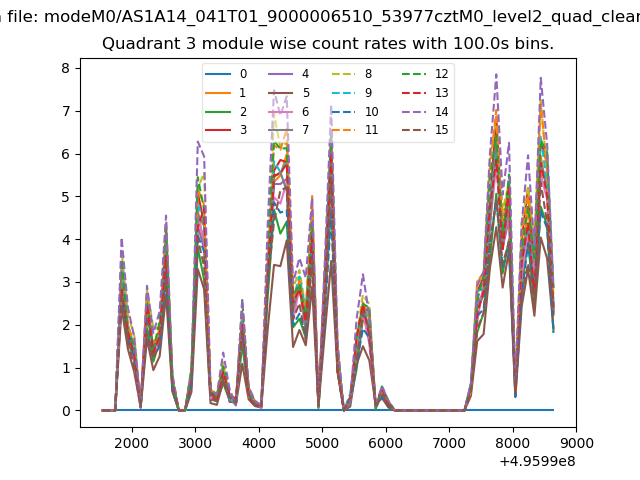
| Module-wise count rates for Quadrant C Data is divided into 100 sec bins |
 |
 |
| Module-wise count rates for Quadrant D Data is divided into 100 sec bins |
 |
 |
| Parameter | Plot |
|---|---|
| CZT HV Monitor | 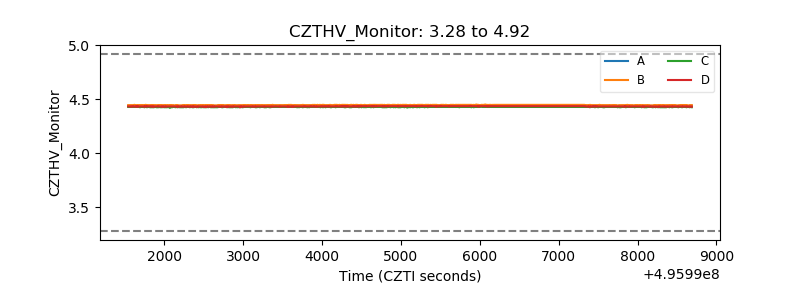 |
| D_VDD | 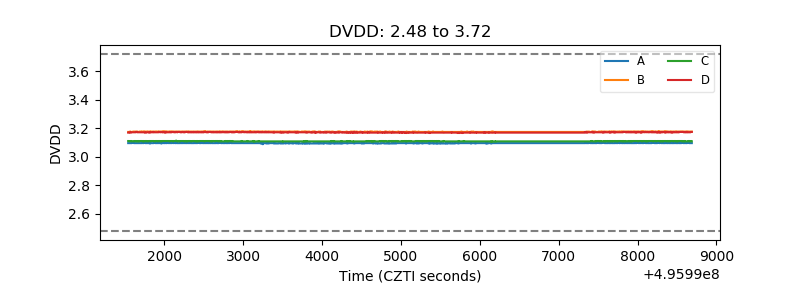 |
| Temperature 1 | 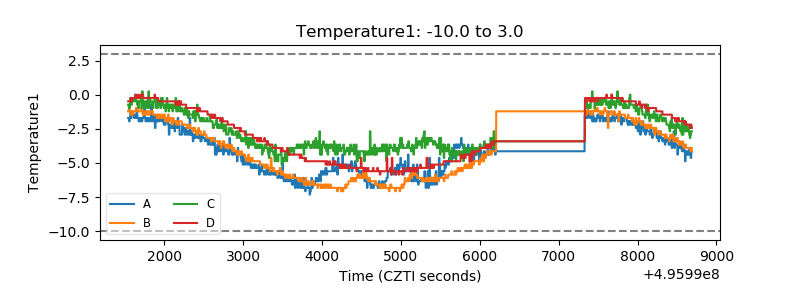 |
| Veto HV Monitor | 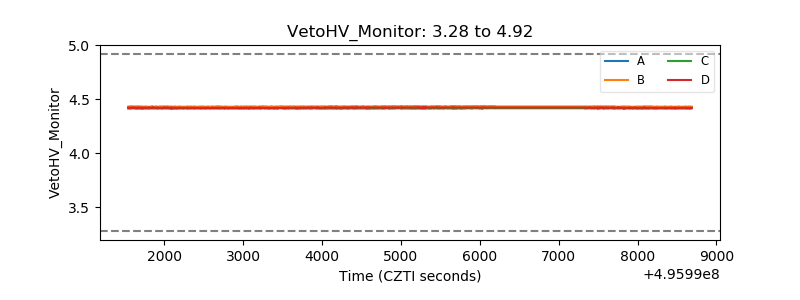 |
| Veto LLD | 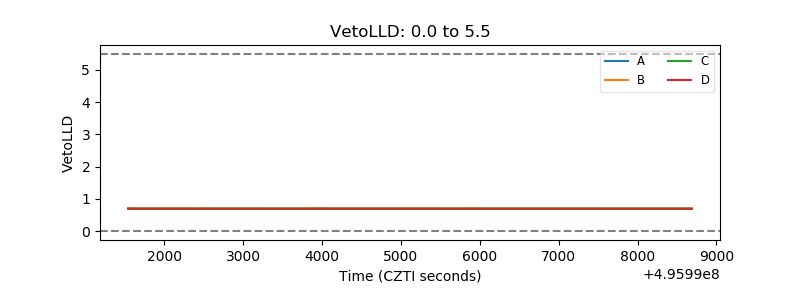 |
| Alpha Counter | 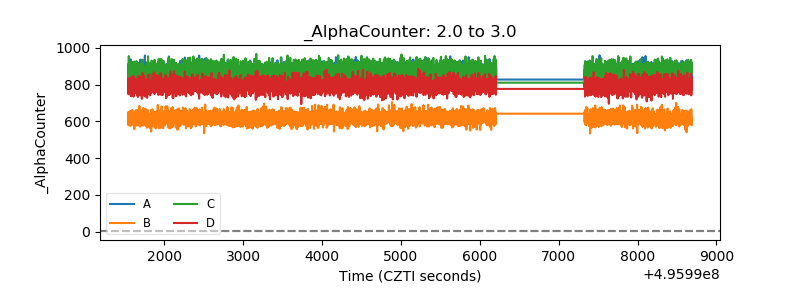 |
| _CPM_Rate | 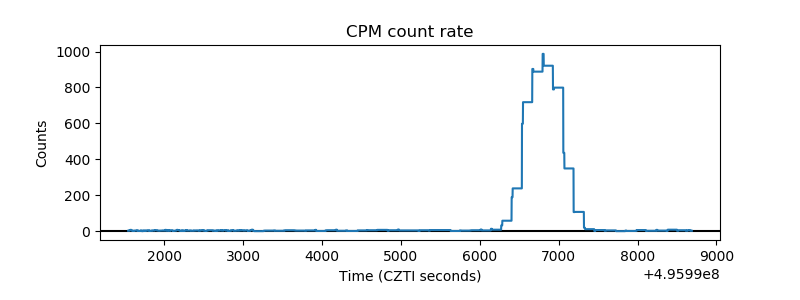 |
| CZT Counter | 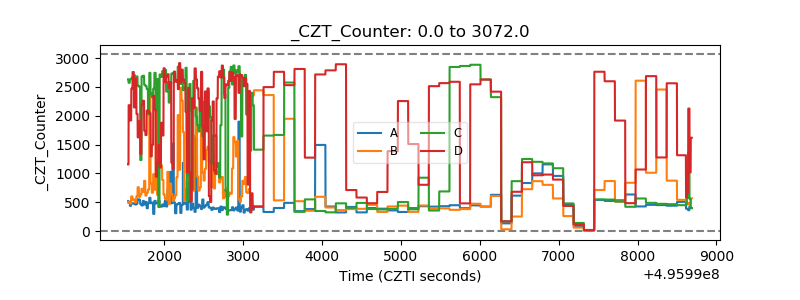 |
| +2.5 Volts monitor |  |
| +5 Volts monitor |  |
| _ROLL_ROT | 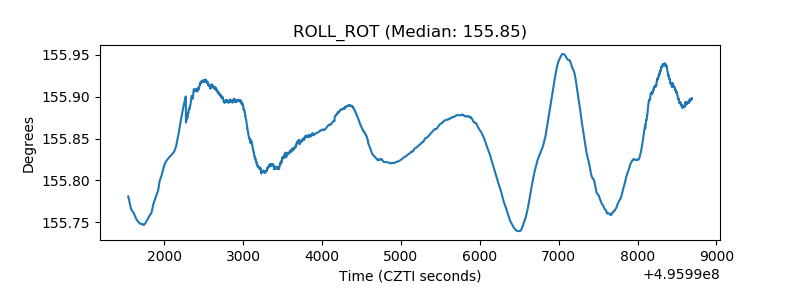 |
| _Roll_DEC | 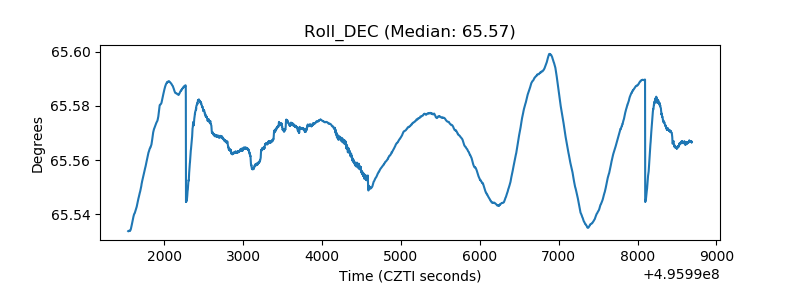 |
| _Roll_RA | 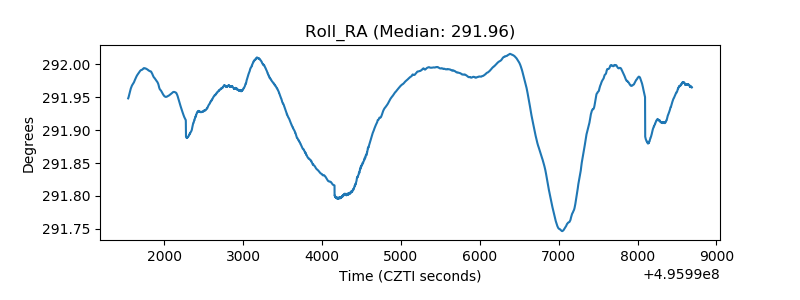 |
| Veto Counter | 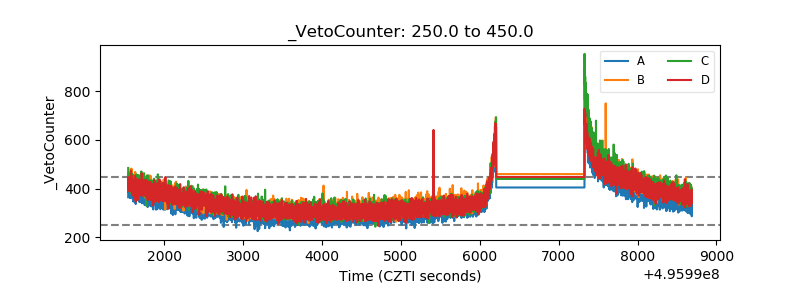 |