| Param | Original file | Final file |
|---|---|---|
| Filename | modeM0/AS1A14_041T01_9000006510_53978cztM0_level2.fits | modeM0/AS1A14_041T01_9000006510_53978cztM0_level2_quad_clean.evt |
| Size (bytes) | 632,678,400 | 85,651,200 |
| Size | 603.4 MB | 81.7 MB |
| Events in quadrant A | 3,129,570 | 627,648 |
| Events in quadrant B | 4,573,516 | 652,642 |
| Events in quadrant C | 3,834,957 | 602,588 |
| Events in quadrant D | 11,397,724 | 275,597 |
| Mode M9 | |||
|---|---|---|---|
| Quadrant | BADHDUFLAG | Total packets | Discarded packets |
| A | 0 | 12 | 0 |
| B | 0 | 12 | 0 |
| C | 0 | 12 | 0 |
| D | 0 | 12 | 0 |
| Mode SS | |||
|---|---|---|---|
| Quadrant | BADHDUFLAG | Total packets | Discarded packets |
| A | 0 | 126 | 0 |
| B | 0 | 126 | 0 |
| C | 0 | 126 | 0 |
| D | 0 | 126 | 0 |
| Mode M0 | |||
|---|---|---|---|
| Quadrant | BADHDUFLAG | Total packets | Discarded packets |
| A | 0 | 13879 | 1 |
| B | 0 | 18102 | 3 |
| C | 0 | 15672 | 1 |
| D | 0 | 38203 | 1 |
| Quadrant | Total seconds | Saturated seconds | Saturation percentage |
|---|---|---|---|
| A | 6235 | 104 | 1.668003% |
| B | 6235 | 454 | 7.281476% |
| C | 6235 | 138 | 2.213312% |
| D | 6235 | 3354 | 53.793103% |
Noise dominated data is calculated using 1-second bins in cleaned event files. If a bin has >2000 counts, and if more than 50% of those come from <1% of pixels, then it is considered to be noise-dominated and hence unusable.
| Quadrant | # 1 sec bins | Bins with >0 counts | Bins with >2000 counts | High rate bins dominated by noise | Noise dominated (total time) | Noise dominated (detector-on time) | Marked lightcurve |
|---|---|---|---|---|---|---|---|
| A | 7435 | 6236 | 63 | 63 | 0.85% | 1.01% | 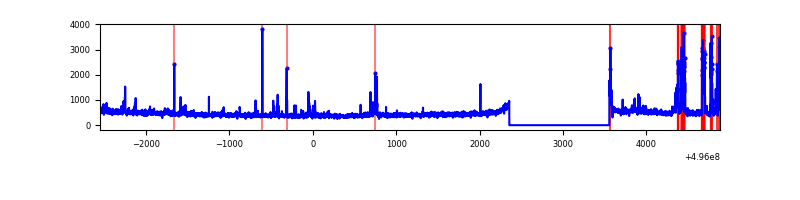 |
| B | 7435 | 6236 | 278 | 278 | 3.74% | 4.46% | 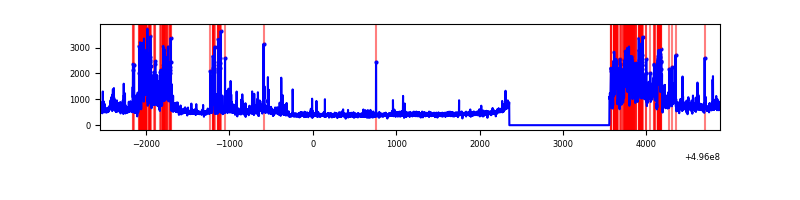 |
| C | 7435 | 6236 | 97 | 97 | 1.30% | 1.56% | 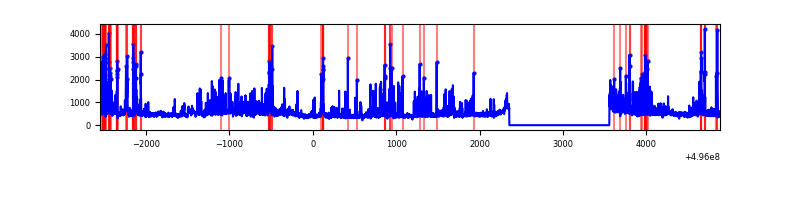 |
| D | 7434 | 6235 | 3094 | 3094 | 41.62% | 49.62% | 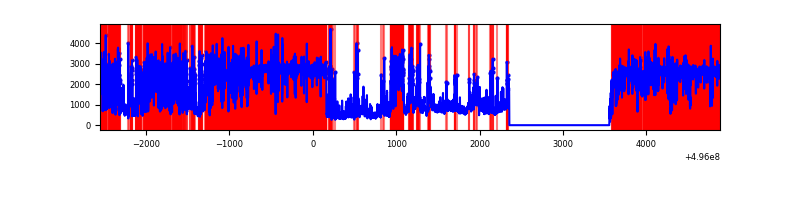 |
Top three noisy pixels from each quadrant. If the there are fewer than three noisy pixels in the level2.evt file, extra rows are filled as -1
| Pixel properties | Quadrant properties | ||||||
|---|---|---|---|---|---|---|---|
| Quadrant | DetID | PixID | Counts | Sigma | Mean | Median | Sigma |
| A | 15 | 174 | 310954 | 1848.66 | 672 | 655 | 167.9 |
| A | 4 | 249 | 37125 | 217.28 | 672 | 655 | 167.9 |
| A | 3 | 78 | 31130 | 181.56 | 672 | 655 | 167.9 |
| B | 0 | 155 | 1164588 | 8316.88 | 662 | 639 | 140.0 |
| B | 5 | 250 | 483946 | 3453.42 | 662 | 639 | 140.0 |
| B | 0 | 213 | 182941 | 1302.62 | 662 | 639 | 140.0 |
| C | 9 | 53 | 430843 | 2347.28 | 663 | 659 | 183.3 |
| C | 1 | 241 | 247459 | 1346.65 | 663 | 659 | 183.3 |
| C | 12 | 249 | 134706 | 731.42 | 663 | 659 | 183.3 |
| D | 8 | 176 | 6595073 | 49968.1 | 461 | 440 | 132.0 |
| D | 5 | 113 | 1534310 | 11622.26 | 461 | 440 | 132.0 |
| D | 13 | 46 | 586177 | 4438.18 | 461 | 440 | 132.0 |
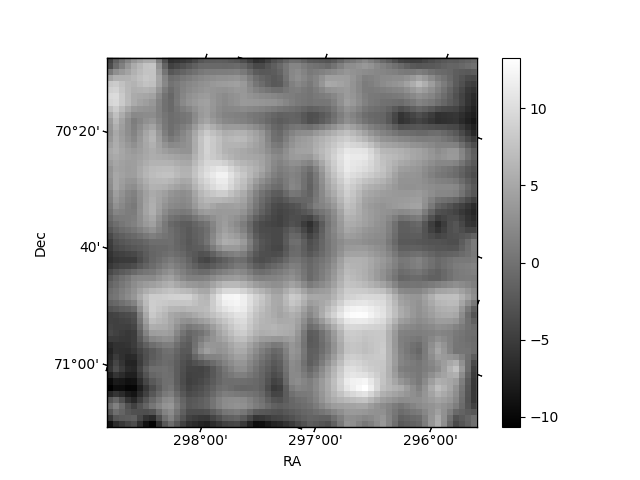
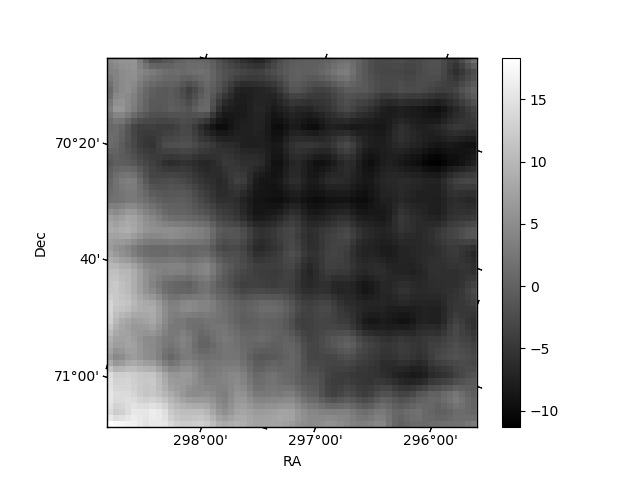
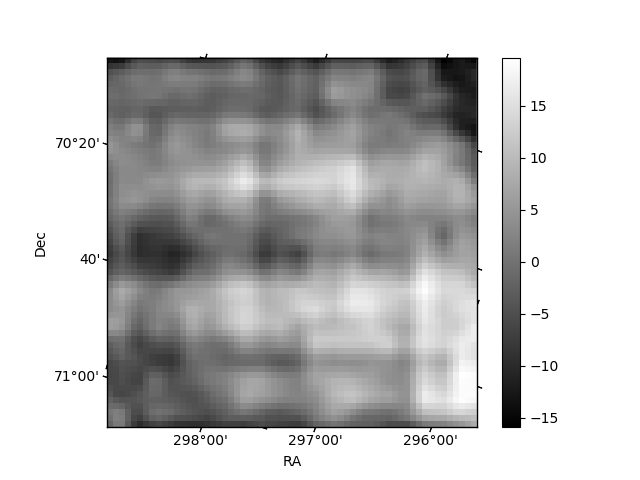
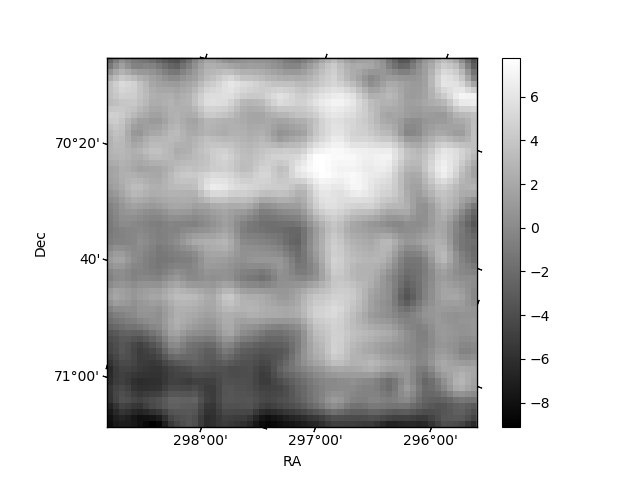
Histogram calculated using DETX and DETY for each event in the final _common_clean file
| Quadrant A | 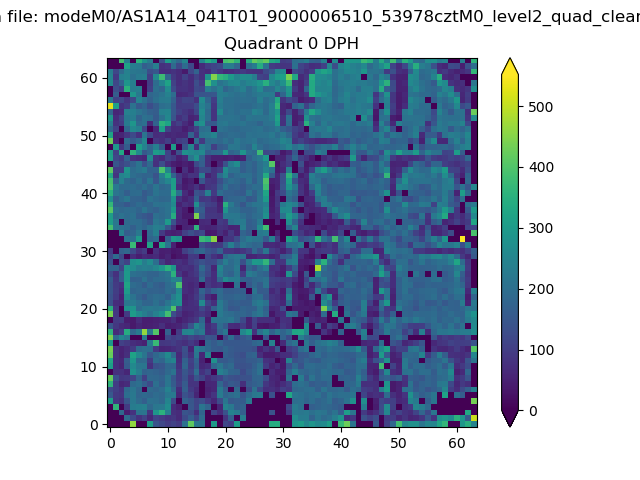 |
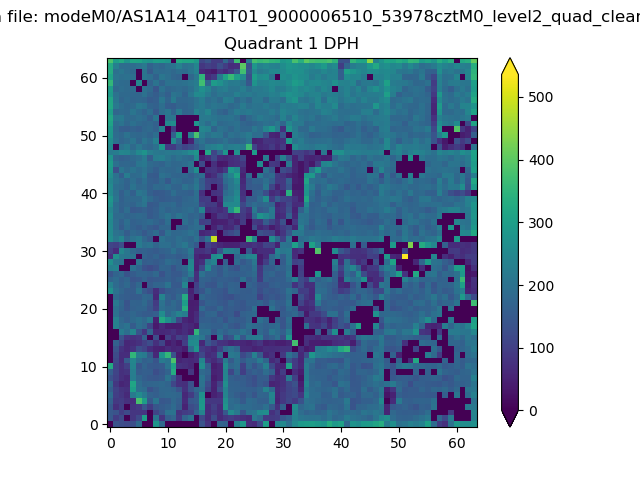 |
Quadrant B |
|---|---|---|---|
| Quadrant D | 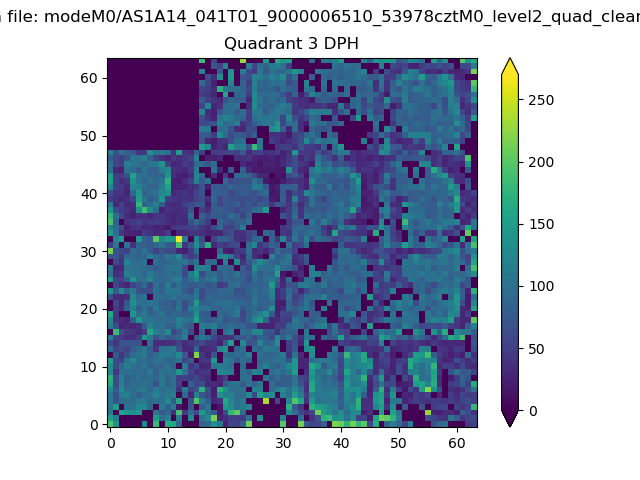 |
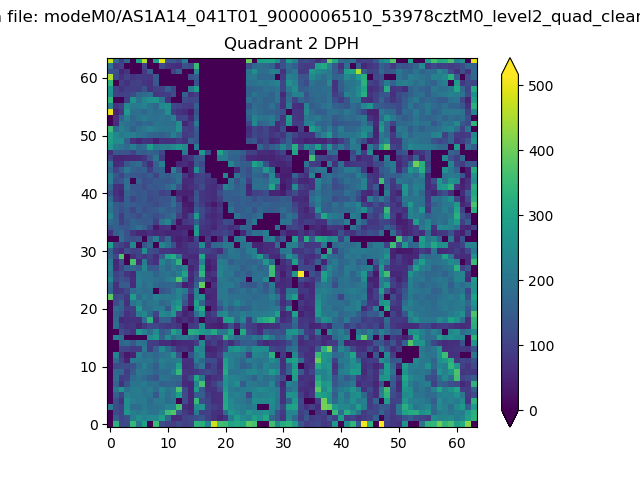 |
Quadrant C |
| Plot type | Count rate plots | Images |
|---|---|---|
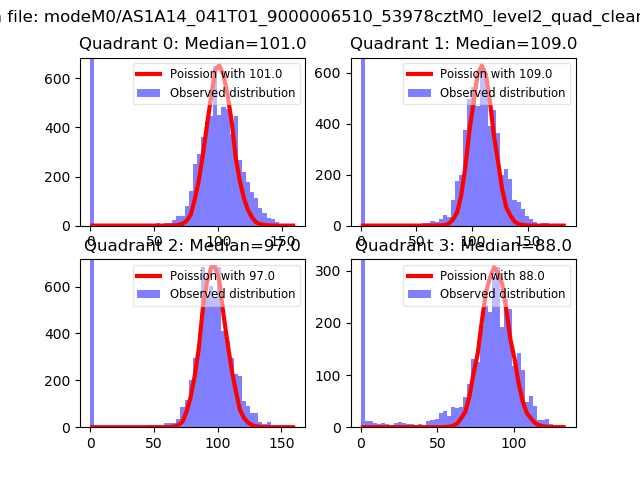
| Comparison with Poisson distribution Blue bars denote a histogram of data divided into 1 sec bins. Red curve is a Poisson curve with rate = median count rate of data. |
 |
 |
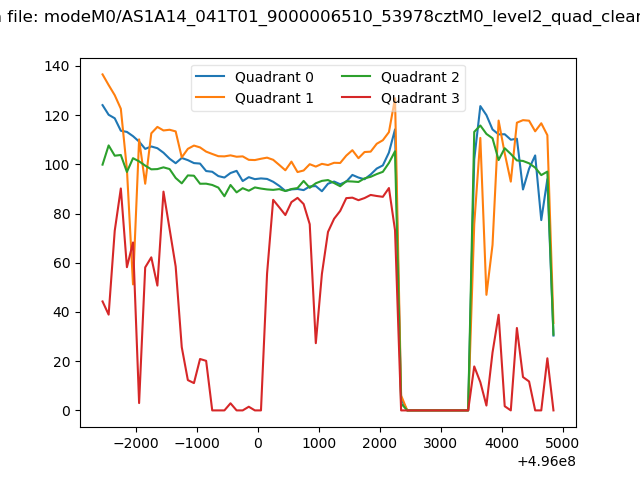
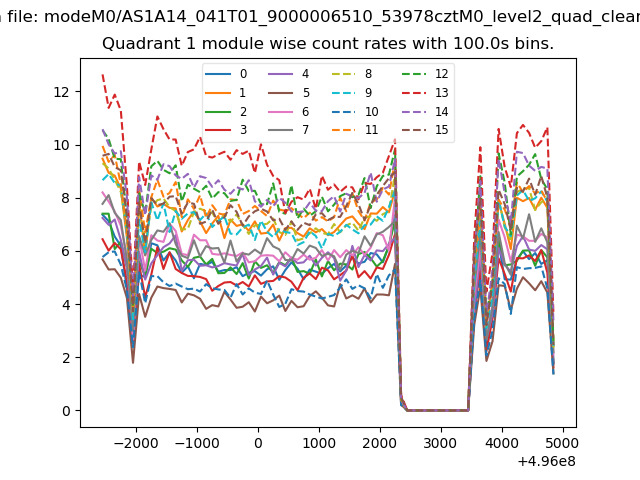
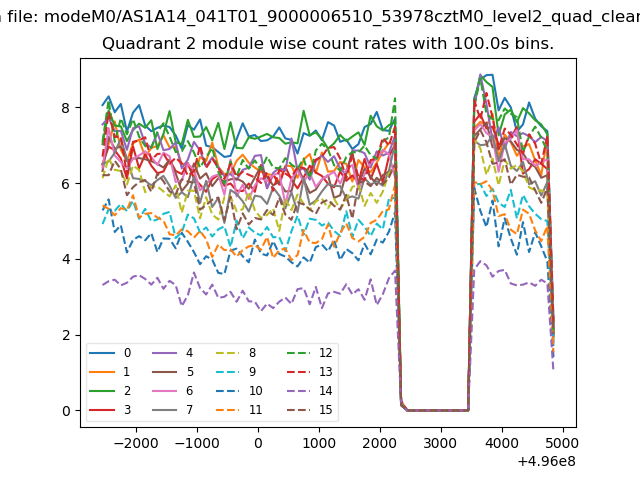
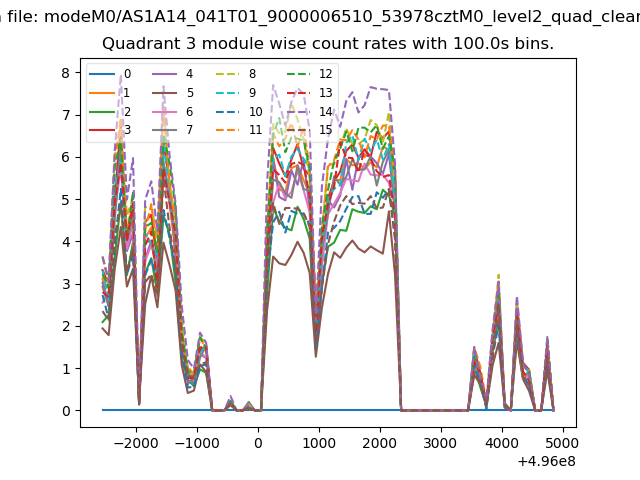
| Quadrant-wise count rates Data is divided into 100 sec bins |
 |
|
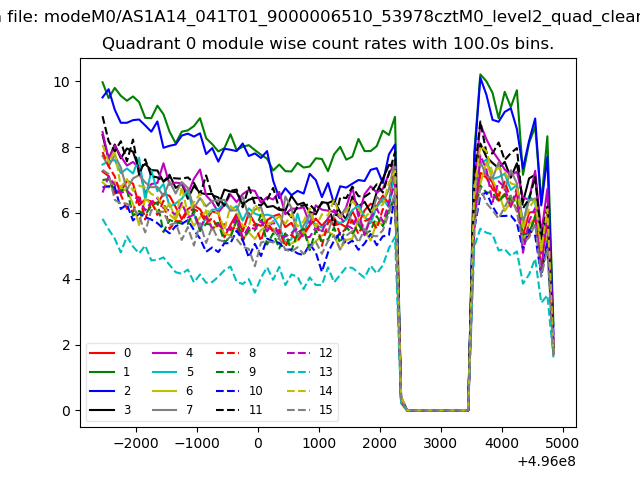
| Module-wise count rates for Quadrant A Data is divided into 100 sec bins |
 |
 |
| Module-wise count rates for Quadrant B Data is divided into 100 sec bins |
 |
 |
| Module-wise count rates for Quadrant C Data is divided into 100 sec bins |
 |
 |
| Module-wise count rates for Quadrant D Data is divided into 100 sec bins |
 |
 |
| Parameter | Plot |
|---|---|
| CZT HV Monitor | 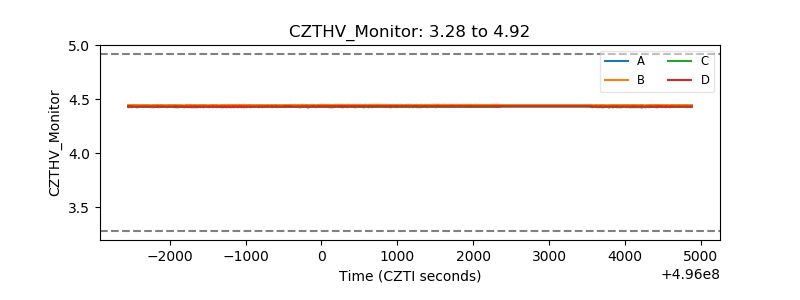 |
| D_VDD | 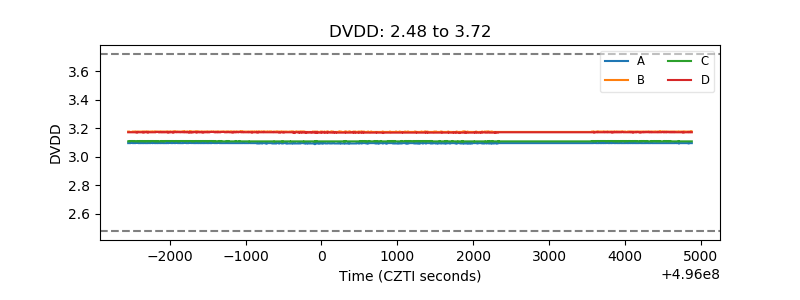 |
| Temperature 1 | 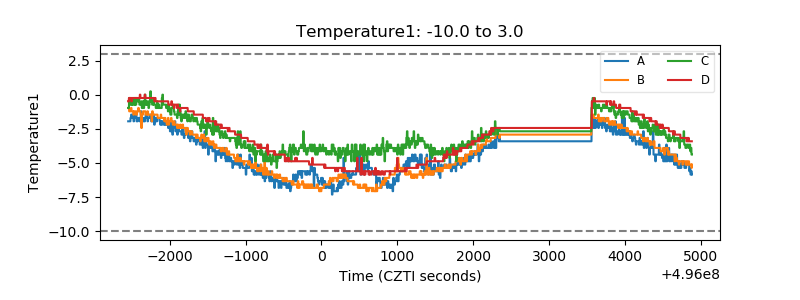 |
| Veto HV Monitor | 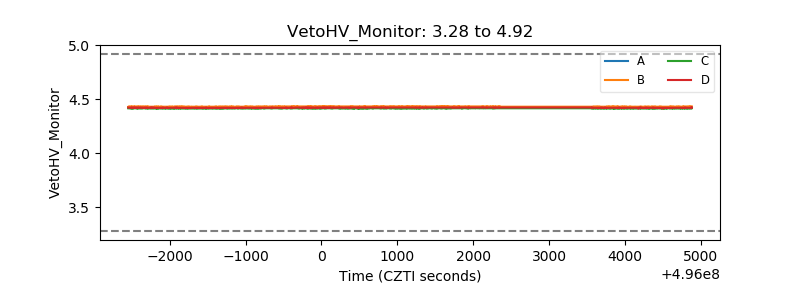 |
| Veto LLD | 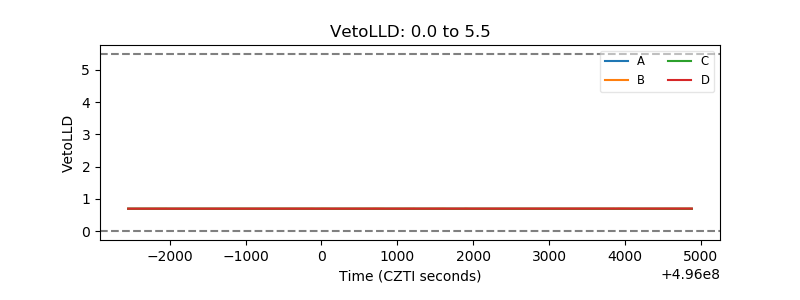 |
| Alpha Counter | 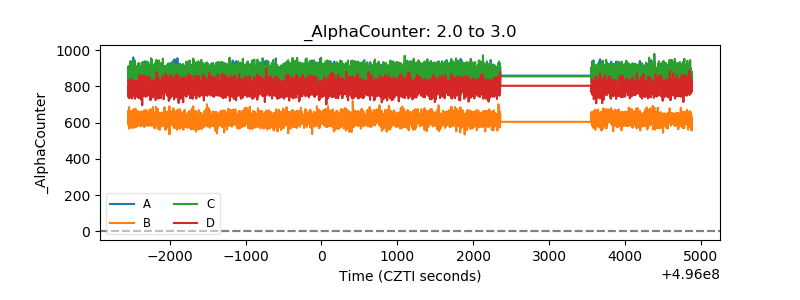 |
| _CPM_Rate | 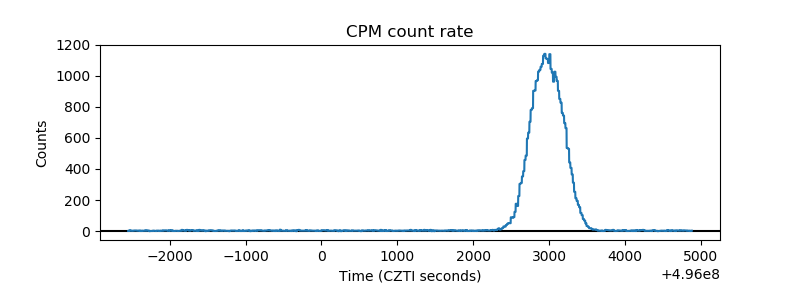 |
| CZT Counter | 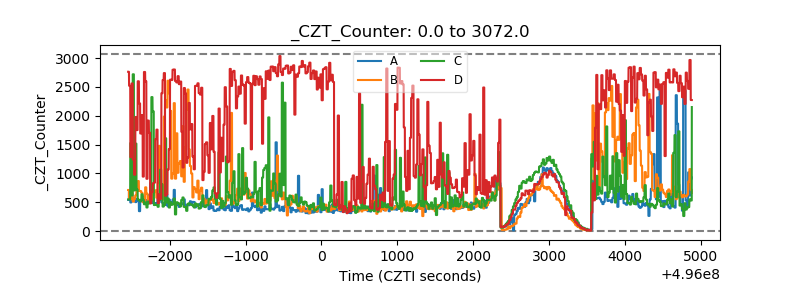 |
| +2.5 Volts monitor |  |
| +5 Volts monitor |  |
| _ROLL_ROT | 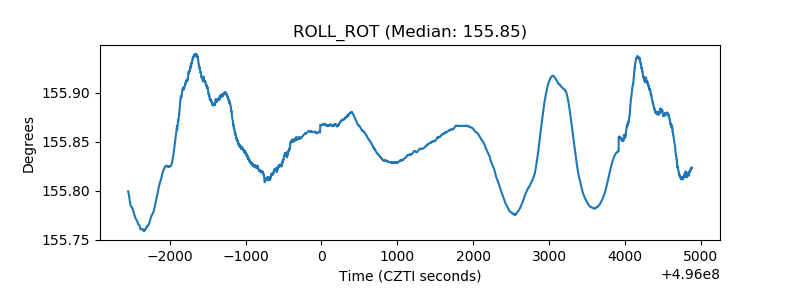 |
| _Roll_DEC | 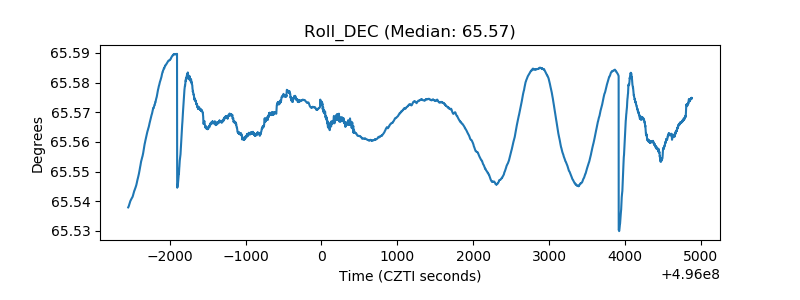 |
| _Roll_RA | 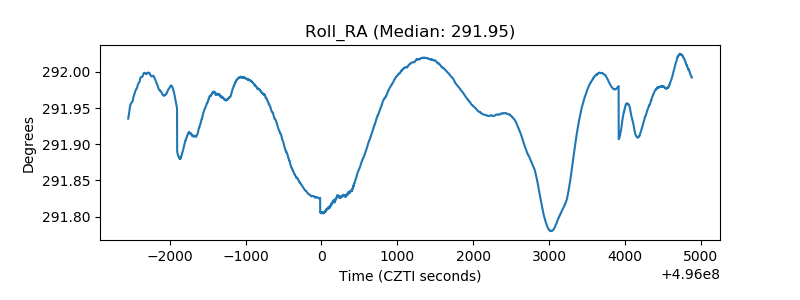 |
| Veto Counter | 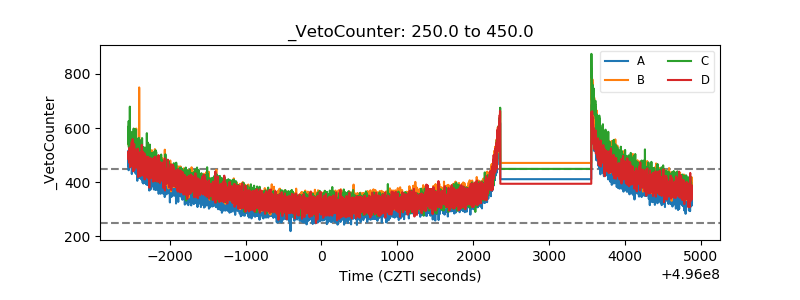 |