| Param | Original file | Final file |
|---|---|---|
| Filename | modeM0/AS1A14_041T01_9000006510_53979cztM0_level2.fits | modeM0/AS1A14_041T01_9000006510_53979cztM0_level2_quad_clean.evt |
| Size (bytes) | 828,504,000 | 79,911,360 |
| Size | 790.1 MB | 76.2 MB |
| Events in quadrant A | 3,416,144 | 644,075 |
| Events in quadrant B | 4,642,956 | 686,256 |
| Events in quadrant C | 9,107,338 | 416,288 |
| Events in quadrant D | 13,003,319 | 223,727 |
| Mode M9 | |||
|---|---|---|---|
| Quadrant | BADHDUFLAG | Total packets | Discarded packets |
| A | 0 | 18 | 0 |
| B | 0 | 18 | 0 |
| C | 0 | 19 | 0 |
| D | 0 | 19 | 0 |
| Mode SS | |||
|---|---|---|---|
| Quadrant | BADHDUFLAG | Total packets | Discarded packets |
| A | 0 | 132 | 0 |
| B | 0 | 132 | 0 |
| C | 0 | 132 | 0 |
| D | 0 | 132 | 0 |
| Mode M0 | |||
|---|---|---|---|
| Quadrant | BADHDUFLAG | Total packets | Discarded packets |
| A | 0 | 14899 | 2 |
| B | 0 | 18367 | 2 |
| C | 0 | 31436 | 2 |
| D | 0 | 43061 | 3 |
| Quadrant | Total seconds | Saturated seconds | Saturation percentage |
|---|---|---|---|
| A | 6435 | 134 | 2.082362% |
| B | 6435 | 363 | 5.641026% |
| C | 6435 | 2488 | 38.663559% |
| D | 6434 | 4132 | 64.221324% |
Noise dominated data is calculated using 1-second bins in cleaned event files. If a bin has >2000 counts, and if more than 50% of those come from <1% of pixels, then it is considered to be noise-dominated and hence unusable.
| Quadrant | # 1 sec bins | Bins with >0 counts | Bins with >2000 counts | High rate bins dominated by noise | Noise dominated (total time) | Noise dominated (detector-on time) | Marked lightcurve |
|---|---|---|---|---|---|---|---|
| A | 7650 | 6436 | 79 | 79 | 1.03% | 1.23% | 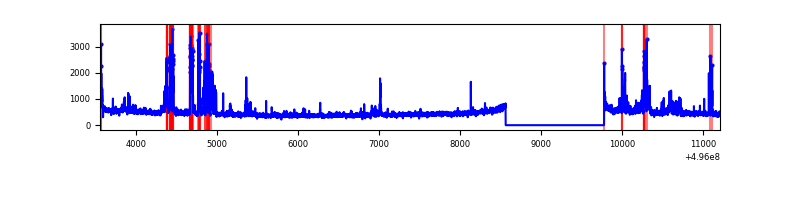 |
| B | 7650 | 6436 | 199 | 199 | 2.60% | 3.09% | 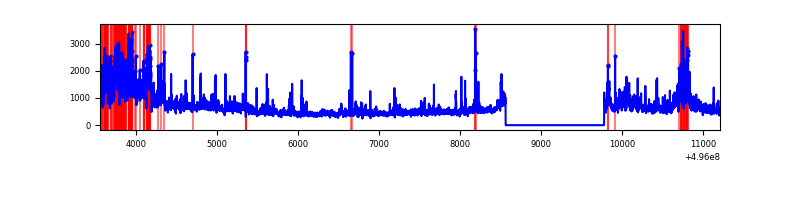 |
| C | 7650 | 6436 | 2279 | 2279 | 29.79% | 35.41% | 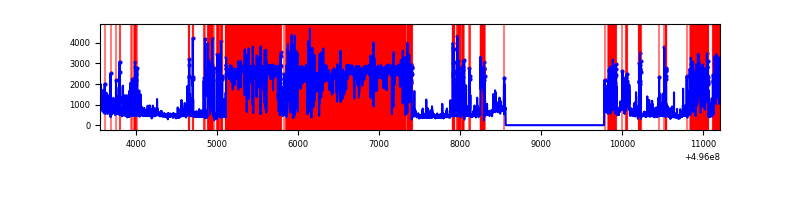 |
| D | 7648 | 6433 | 3850 | 3850 | 50.34% | 59.85% | 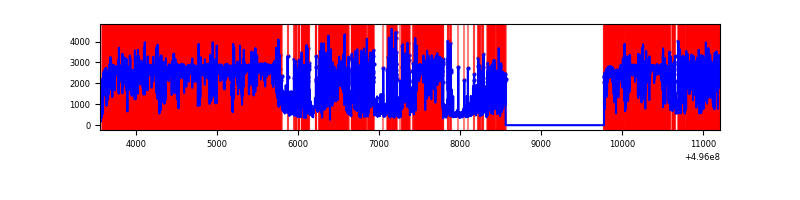 |
Top three noisy pixels from each quadrant. If the there are fewer than three noisy pixels in the level2.evt file, extra rows are filled as -1
| Pixel properties | Quadrant properties | ||||||
|---|---|---|---|---|---|---|---|
| Quadrant | DetID | PixID | Counts | Sigma | Mean | Median | Sigma |
| A | 15 | 174 | 426311 | 2487.01 | 688 | 672 | 171.1 |
| A | 3 | 78 | 53464 | 308.46 | 688 | 672 | 171.1 |
| A | 7 | 14 | 45652 | 262.82 | 688 | 672 | 171.1 |
| B | 5 | 250 | 685940 | 4757.97 | 684 | 662 | 144.0 |
| B | 0 | 155 | 679431 | 4712.78 | 684 | 662 | 144.0 |
| B | 0 | 213 | 263209 | 1822.9 | 684 | 662 | 144.0 |
| C | 12 | 249 | 4131113 | 27720.32 | 537 | 532 | 149.0 |
| C | 1 | 241 | 2095108 | 14056.69 | 537 | 532 | 149.0 |
| C | 12 | 252 | 200324 | 1340.8 | 537 | 532 | 149.0 |
| D | 8 | 176 | 10080132 | 83630.87 | 416 | 398 | 120.5 |
| D | 6 | 239 | 309419 | 2563.93 | 416 | 398 | 120.5 |
| D | 2 | 172 | 265741 | 2201.53 | 416 | 398 | 120.5 |
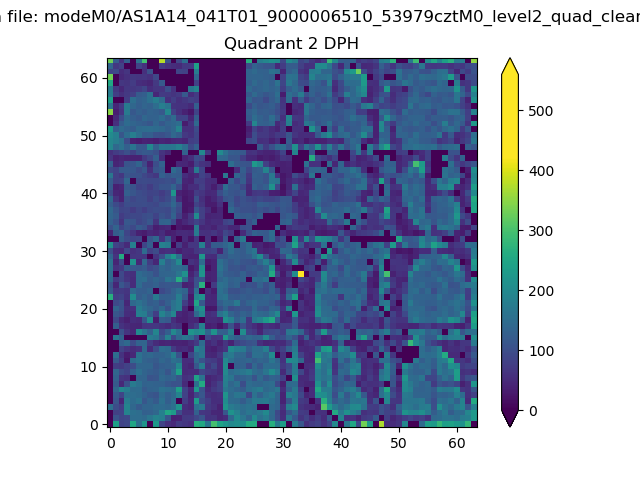
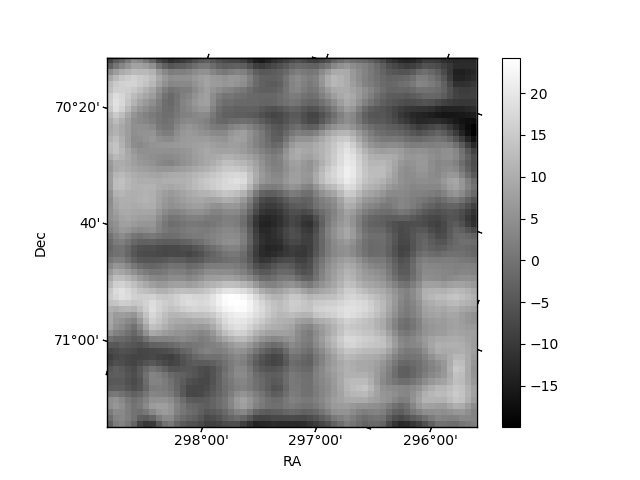
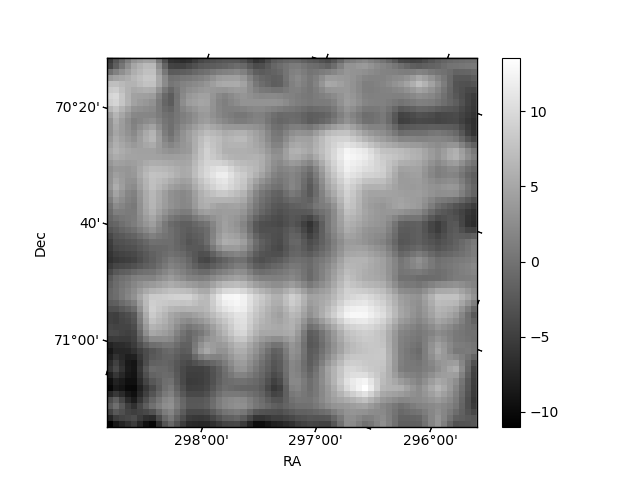
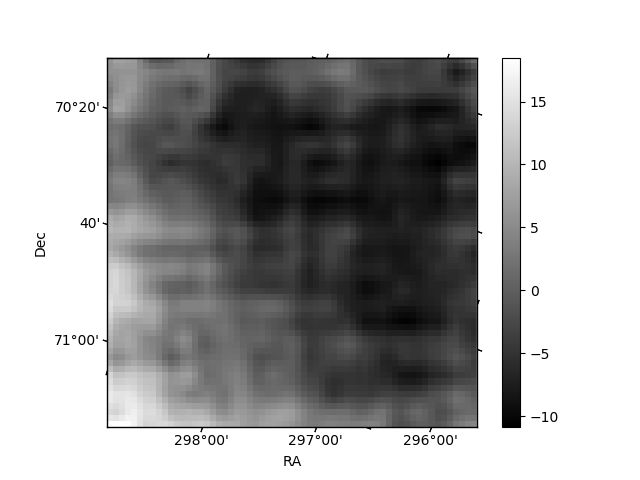
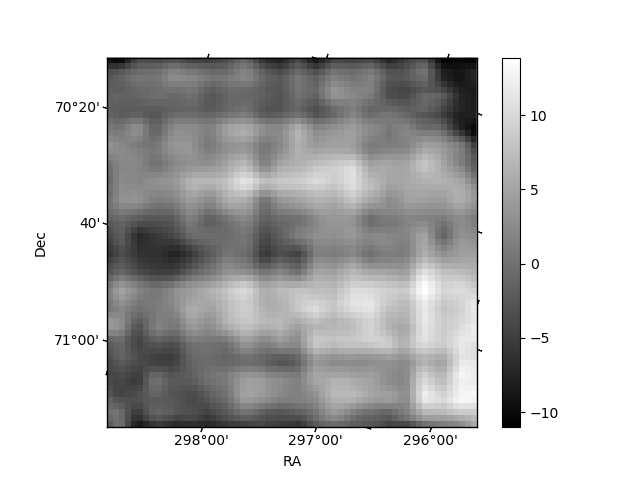
Histogram calculated using DETX and DETY for each event in the final _common_clean file
| Quadrant A | 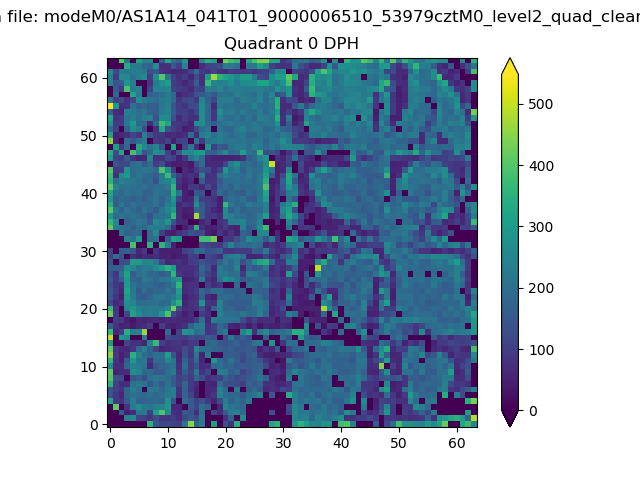 |
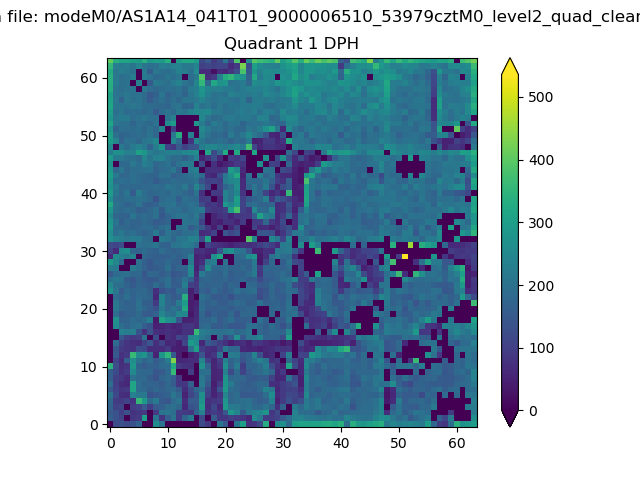 |
Quadrant B |
|---|---|---|---|
| Quadrant D | 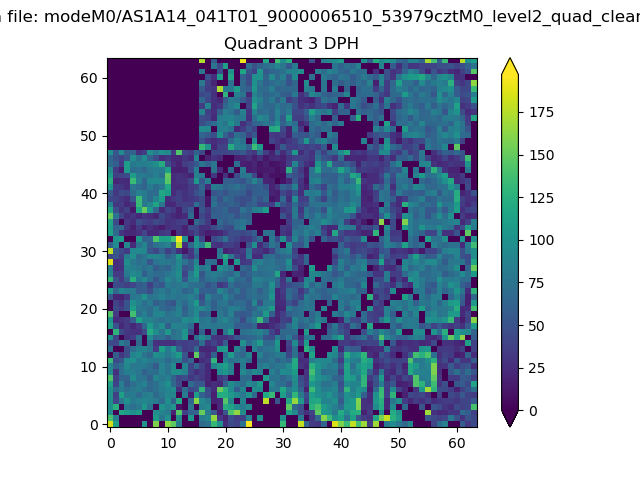 |
 |
Quadrant C |
| Plot type | Count rate plots | Images |
|---|---|---|
| Comparison with Poisson distribution Blue bars denote a histogram of data divided into 1 sec bins. Red curve is a Poisson curve with rate = median count rate of data. |
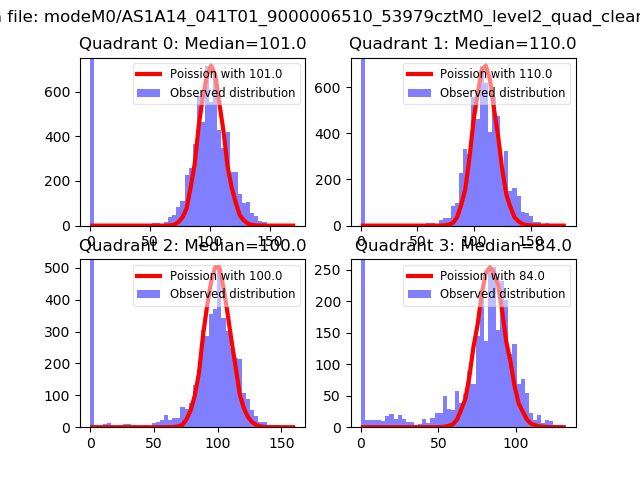 |
 |
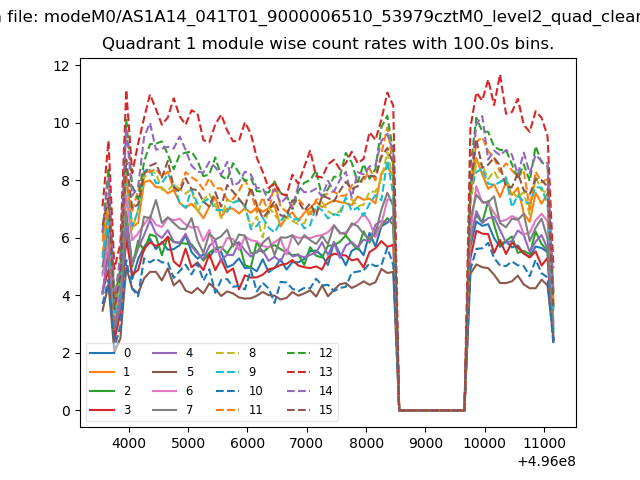
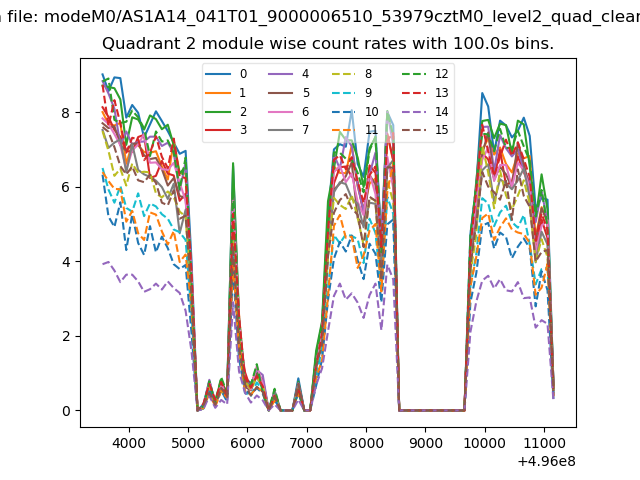
| Quadrant-wise count rates Data is divided into 100 sec bins |
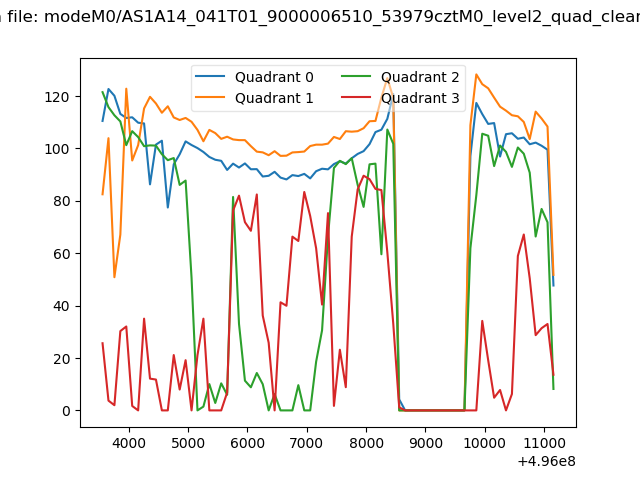 |
|
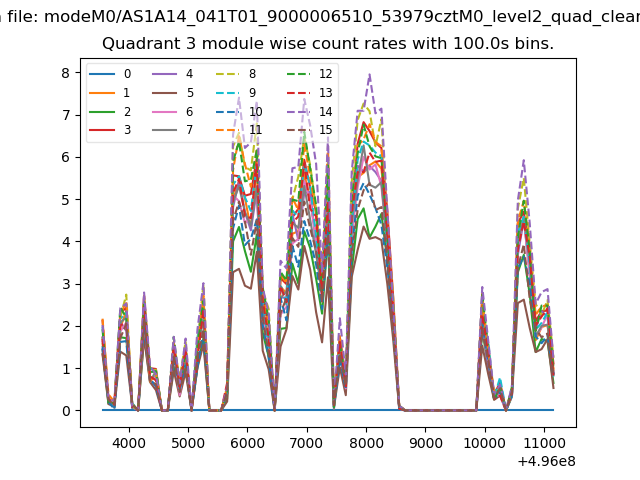
| Module-wise count rates for Quadrant A Data is divided into 100 sec bins |
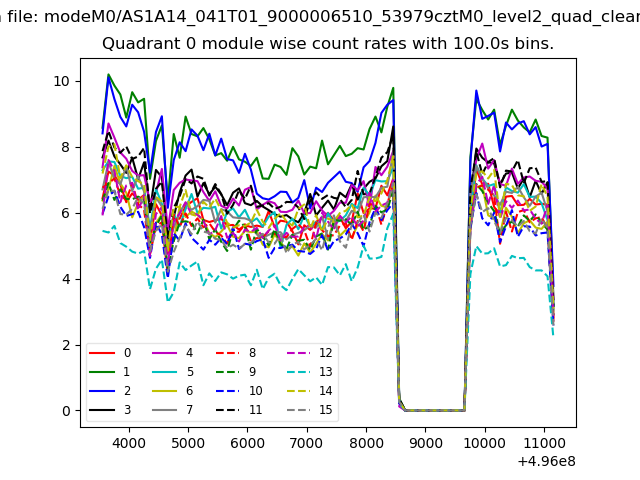 |
 |
| Module-wise count rates for Quadrant B Data is divided into 100 sec bins |
 |
 |
| Module-wise count rates for Quadrant C Data is divided into 100 sec bins |
 |
 |
| Module-wise count rates for Quadrant D Data is divided into 100 sec bins |
 |
 |
| Parameter | Plot |
|---|---|
| CZT HV Monitor | 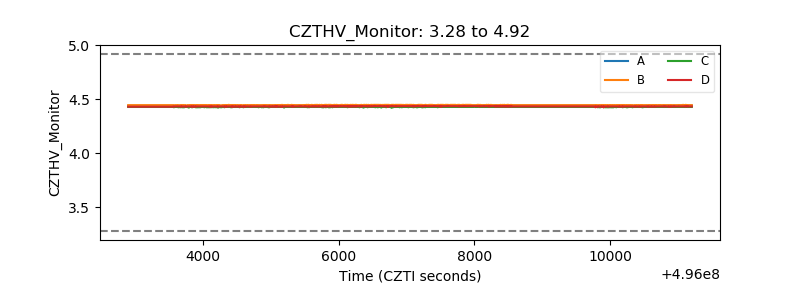 |
| D_VDD | 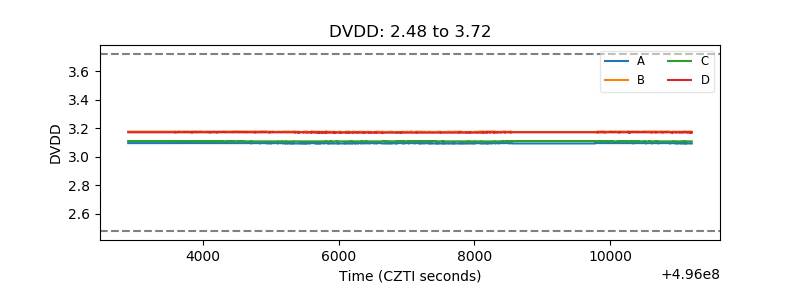 |
| Temperature 1 | 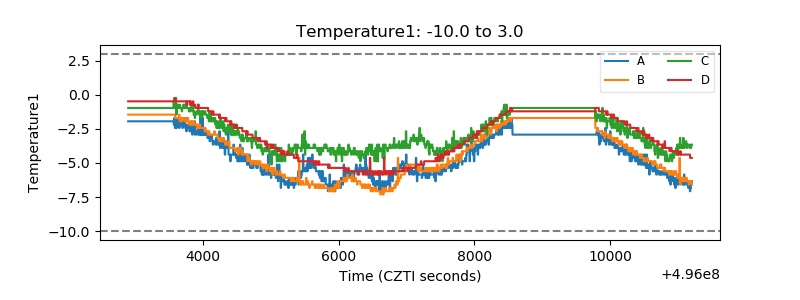 |
| Veto HV Monitor | 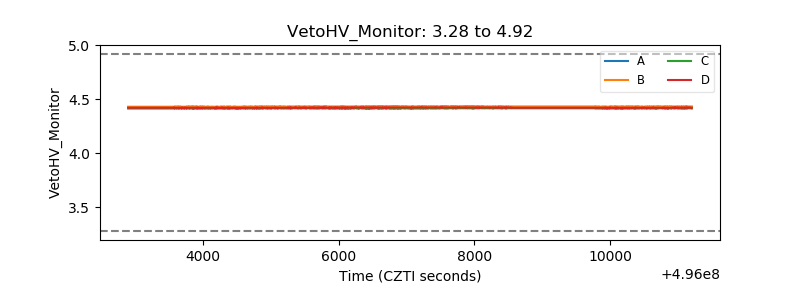 |
| Veto LLD | 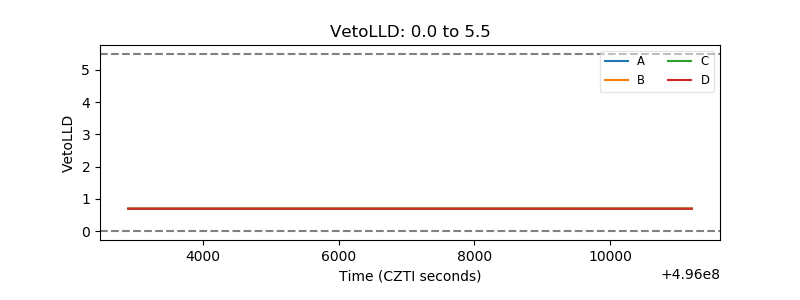 |
| Alpha Counter | 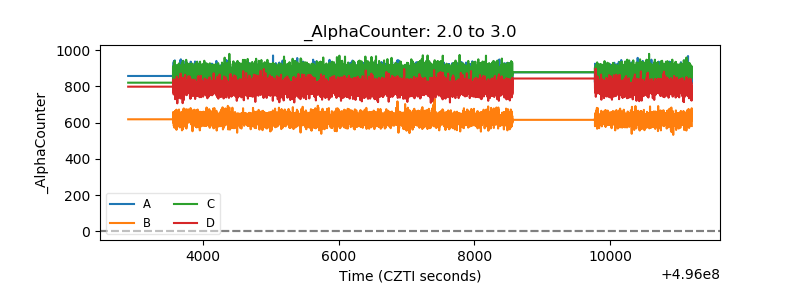 |
| _CPM_Rate | 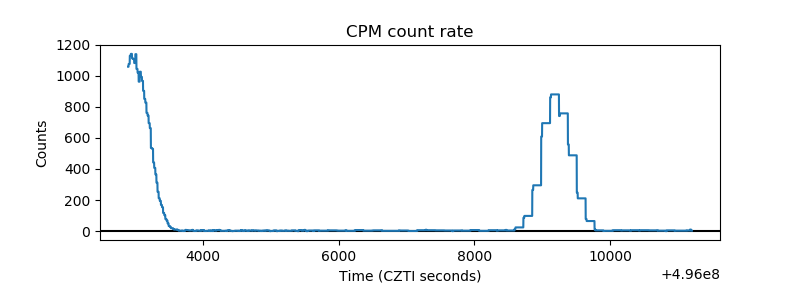 |
| CZT Counter | 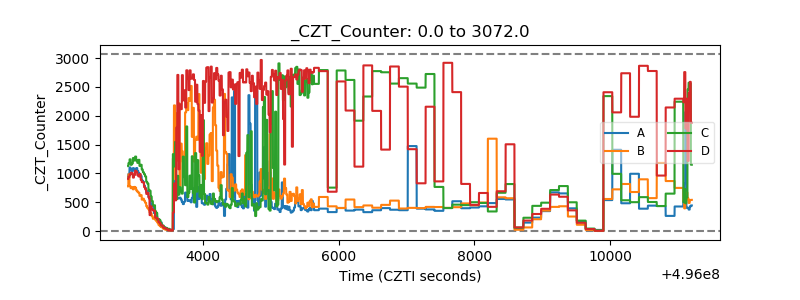 |
| +2.5 Volts monitor |  |
| +5 Volts monitor |  |
| _ROLL_ROT | 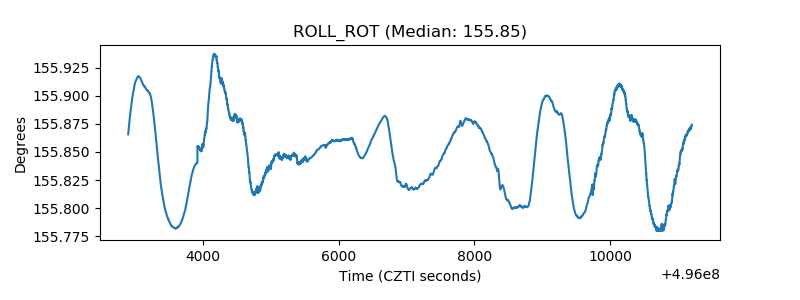 |
| _Roll_DEC | 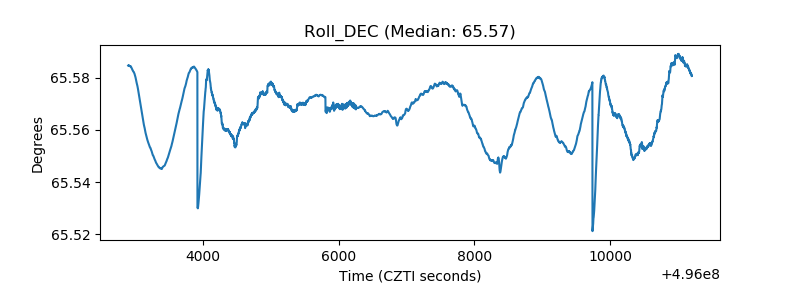 |
| _Roll_RA | 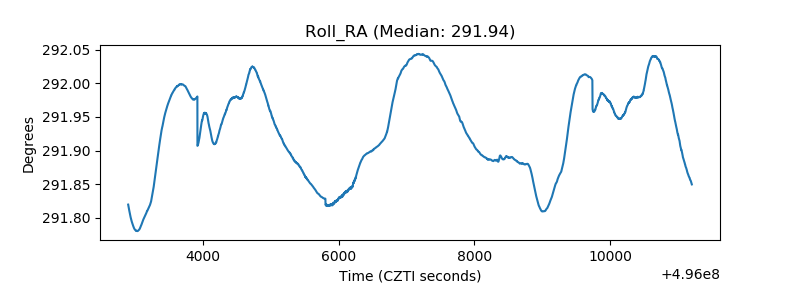 |
| Veto Counter | 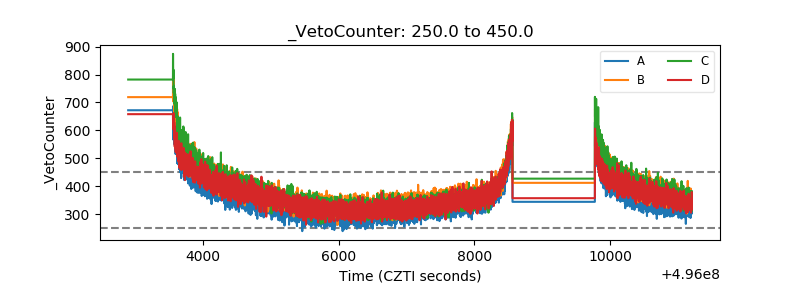 |