| Param | Original file | Final file |
|---|---|---|
| Filename | modeM0/AS1A14_041T01_9000006510_53980cztM0_level2.fits | modeM0/AS1A14_041T01_9000006510_53980cztM0_level2_quad_clean.evt |
| Size (bytes) | 624,225,600 | 85,700,160 |
| Size | 595.3 MB | 81.7 MB |
| Events in quadrant A | 3,319,048 | 608,440 |
| Events in quadrant B | 3,795,469 | 664,675 |
| Events in quadrant C | 5,602,016 | 534,999 |
| Events in quadrant D | 9,901,263 | 346,618 |
| Mode M9 | |||
|---|---|---|---|
| Quadrant | BADHDUFLAG | Total packets | Discarded packets |
| A | 0 | 11 | 0 |
| B | 0 | 11 | 0 |
| C | 0 | 11 | 0 |
| D | 0 | 11 | 0 |
| Mode SS | |||
|---|---|---|---|
| Quadrant | BADHDUFLAG | Total packets | Discarded packets |
| A | 0 | 130 | 0 |
| B | 0 | 130 | 0 |
| C | 0 | 130 | 0 |
| D | 0 | 130 | 0 |
| Mode M0 | |||
|---|---|---|---|
| Quadrant | BADHDUFLAG | Total packets | Discarded packets |
| A | 0 | 14548 | 1 |
| B | 0 | 15688 | 1 |
| C | 0 | 21113 | 1 |
| D | 0 | 33858 | 1 |
| Quadrant | Total seconds | Saturated seconds | Saturation percentage |
|---|---|---|---|
| A | 6300 | 130 | 2.063492% |
| B | 6300 | 183 | 2.904762% |
| C | 6300 | 791 | 12.555556% |
| D | 6300 | 2484 | 39.428571% |
Noise dominated data is calculated using 1-second bins in cleaned event files. If a bin has >2000 counts, and if more than 50% of those come from <1% of pixels, then it is considered to be noise-dominated and hence unusable.
| Quadrant | # 1 sec bins | Bins with >0 counts | Bins with >2000 counts | High rate bins dominated by noise | Noise dominated (total time) | Noise dominated (detector-on time) | Marked lightcurve |
|---|---|---|---|---|---|---|---|
| A | 7440 | 6301 | 85 | 85 | 1.14% | 1.35% | 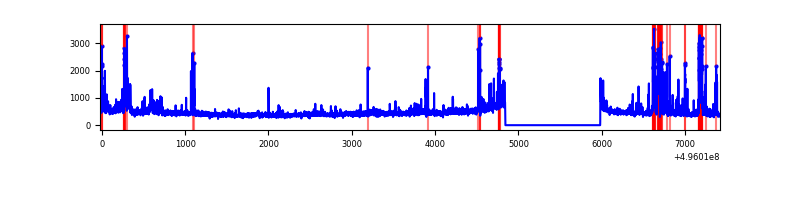 |
| B | 7440 | 6301 | 109 | 109 | 1.47% | 1.73% | 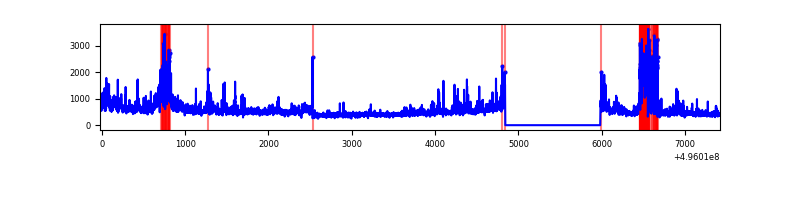 |
| C | 7440 | 6301 | 747 | 747 | 10.04% | 11.86% | 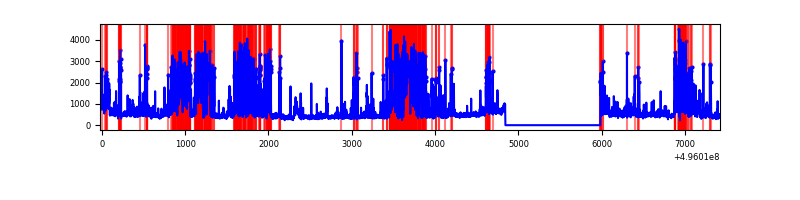 |
| D | 7440 | 6300 | 2364 | 2364 | 31.77% | 37.52% | 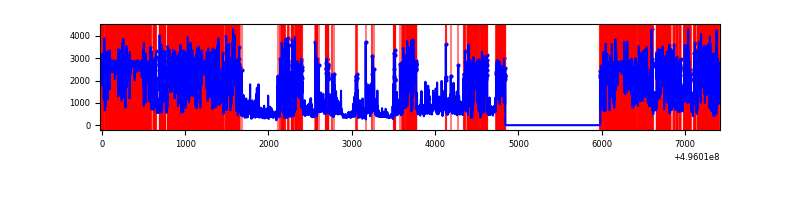 |
Top three noisy pixels from each quadrant. If the there are fewer than three noisy pixels in the level2.evt file, extra rows are filled as -1
| Pixel properties | Quadrant properties | ||||||
|---|---|---|---|---|---|---|---|
| Quadrant | DetID | PixID | Counts | Sigma | Mean | Median | Sigma |
| A | 15 | 174 | 465705 | 2889.61 | 649 | 634 | 160.9 |
| A | 10 | 253 | 62087 | 381.82 | 649 | 634 | 160.9 |
| A | 7 | 14 | 48148 | 295.22 | 649 | 634 | 160.9 |
| B | 5 | 185 | 406268 | 2940.36 | 654 | 633 | 138.0 |
| B | 5 | 250 | 334583 | 2420.73 | 654 | 633 | 138.0 |
| B | 0 | 213 | 128285 | 925.32 | 654 | 633 | 138.0 |
| C | 1 | 241 | 2214999 | 13049.43 | 616 | 610 | 169.7 |
| C | 12 | 249 | 445112 | 2619.46 | 616 | 610 | 169.7 |
| C | 12 | 2 | 163782 | 961.58 | 616 | 610 | 169.7 |
| D | 8 | 176 | 6870143 | 46756.26 | 502 | 478 | 146.9 |
| D | 2 | 172 | 463355 | 3150.43 | 502 | 478 | 146.9 |
| D | 6 | 239 | 346796 | 2357.1 | 502 | 478 | 146.9 |
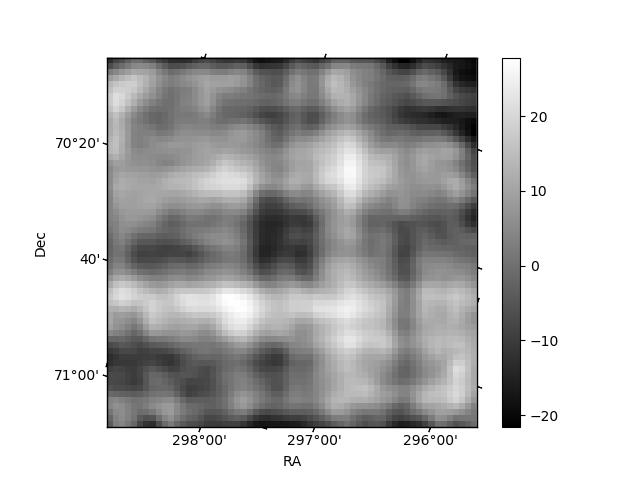
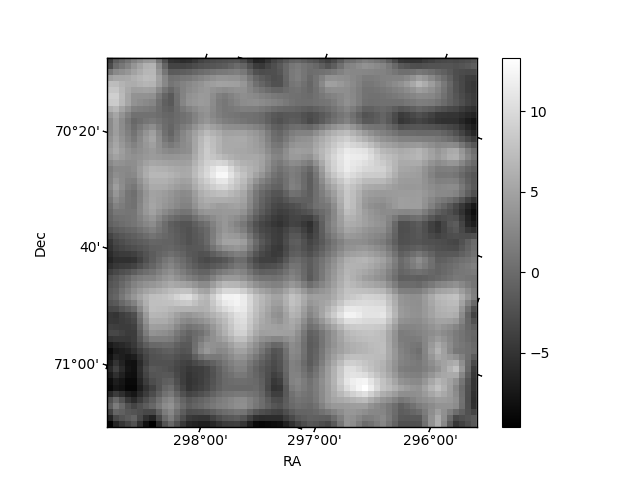
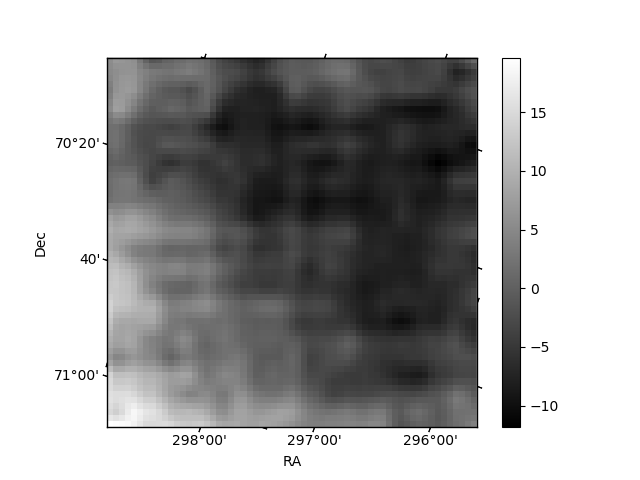
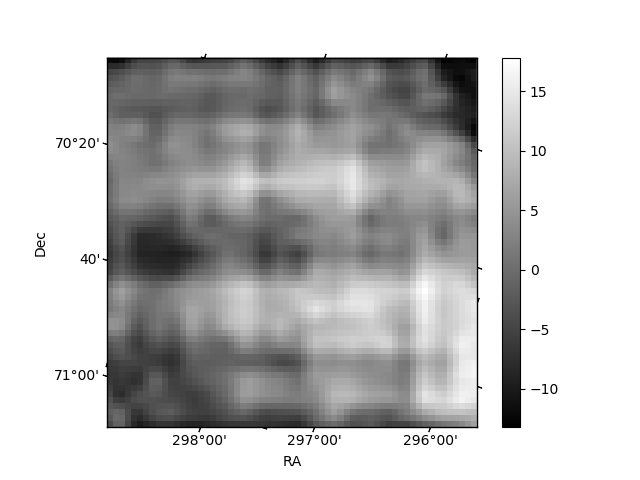
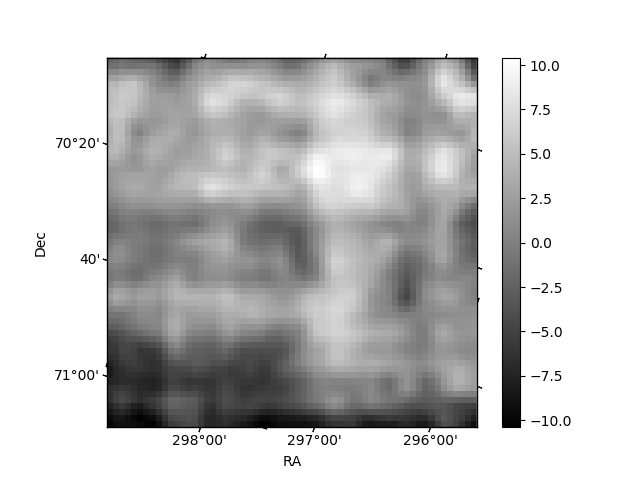
Histogram calculated using DETX and DETY for each event in the final _common_clean file
| Quadrant A | 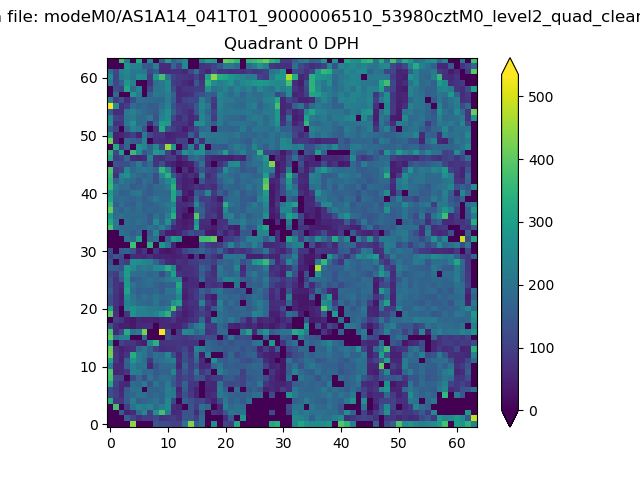 |
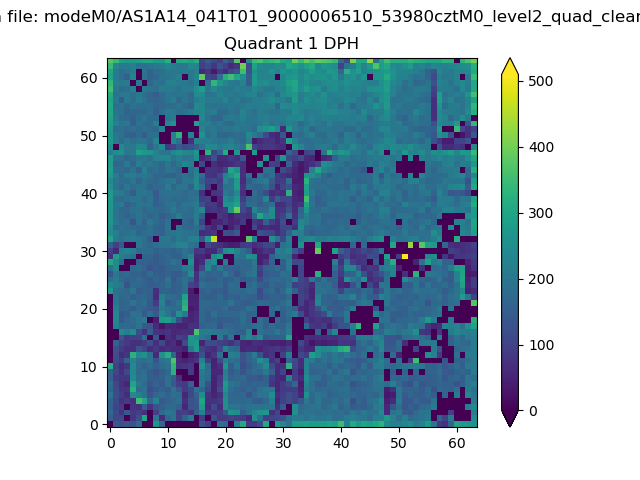 |
Quadrant B |
|---|---|---|---|
| Quadrant D | 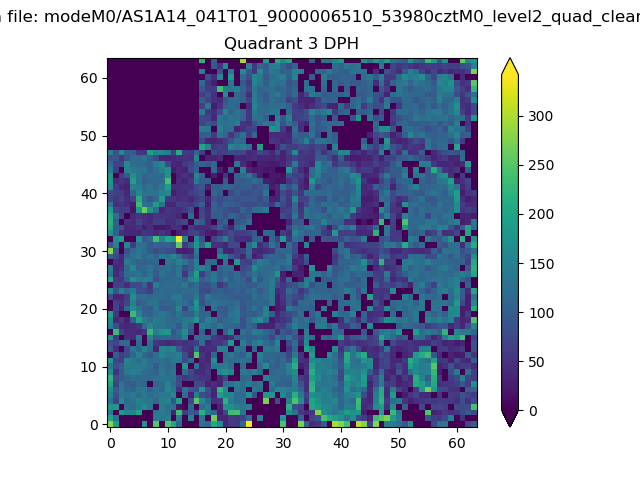 |
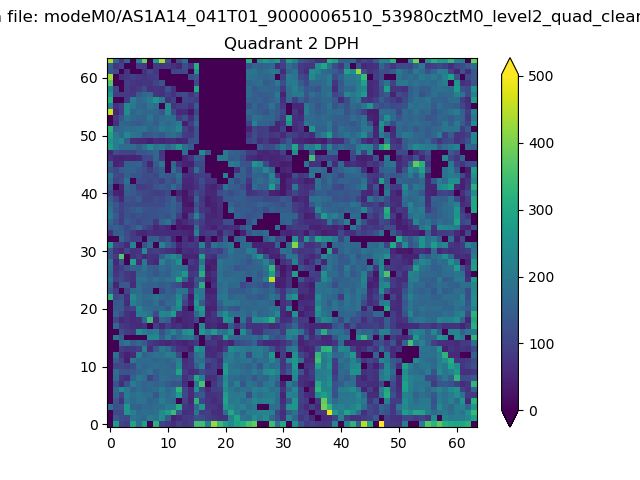 |
Quadrant C |
| Plot type | Count rate plots | Images |
|---|---|---|
| Comparison with Poisson distribution Blue bars denote a histogram of data divided into 1 sec bins. Red curve is a Poisson curve with rate = median count rate of data. |
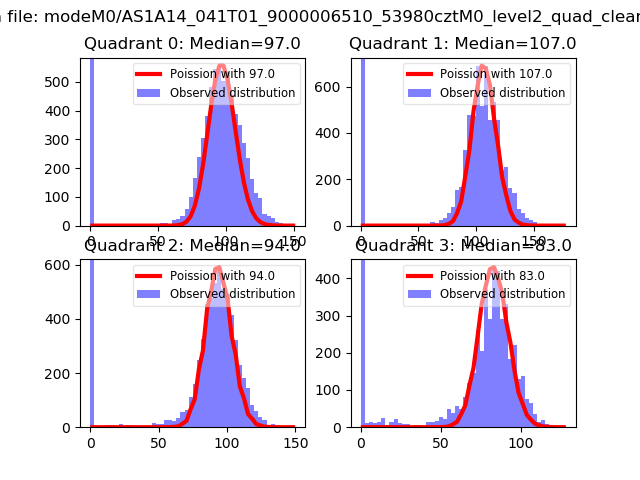 |
 |
| Quadrant-wise count rates Data is divided into 100 sec bins |
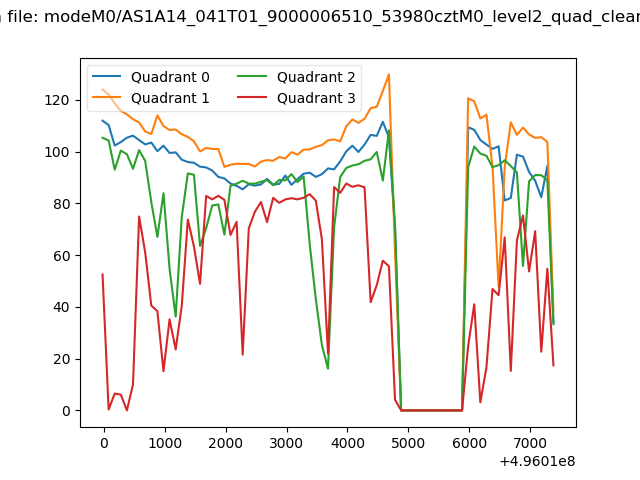 |
|
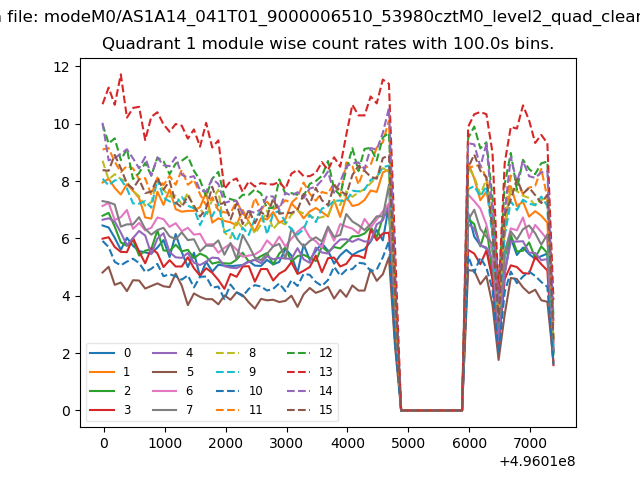
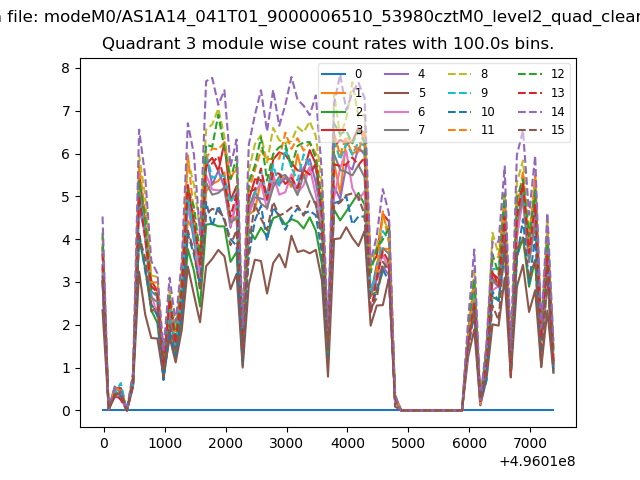
| Module-wise count rates for Quadrant A Data is divided into 100 sec bins |
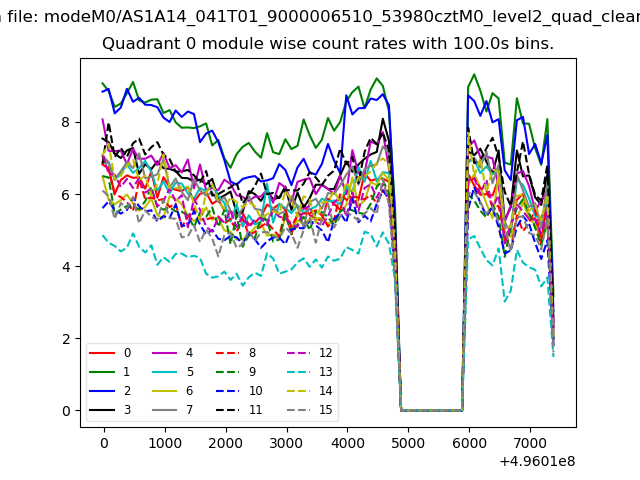 |
 |
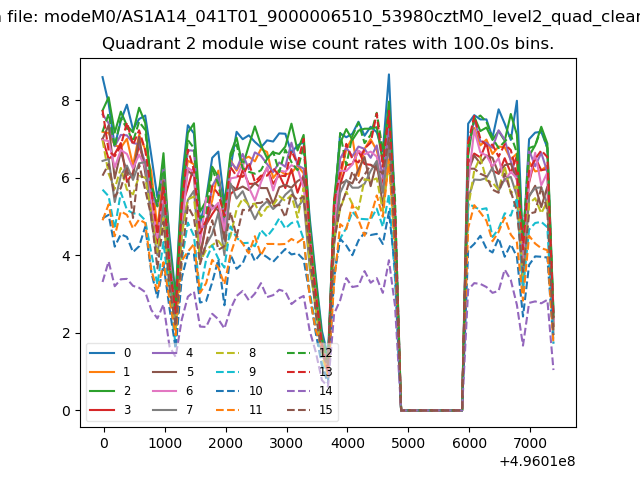
| Module-wise count rates for Quadrant B Data is divided into 100 sec bins |
 |
 |
| Module-wise count rates for Quadrant C Data is divided into 100 sec bins |
 |
 |
| Module-wise count rates for Quadrant D Data is divided into 100 sec bins |
 |
 |
| Parameter | Plot |
|---|---|
| CZT HV Monitor | 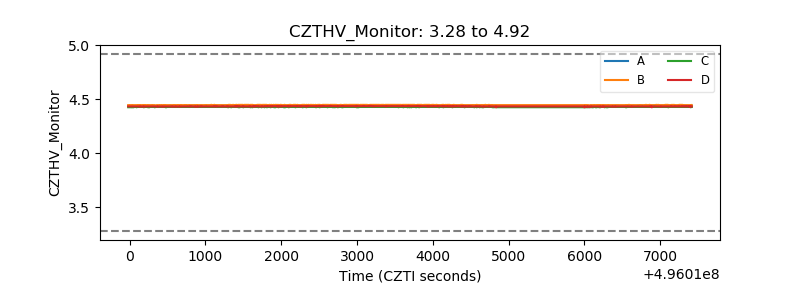 |
| D_VDD | 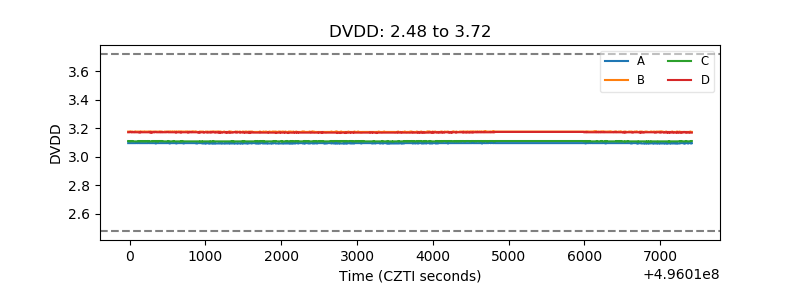 |
| Temperature 1 | 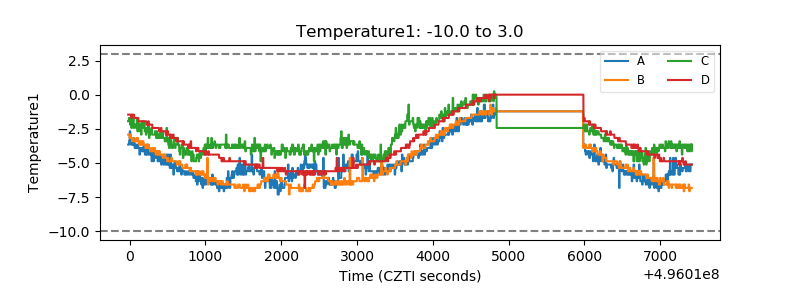 |
| Veto HV Monitor | 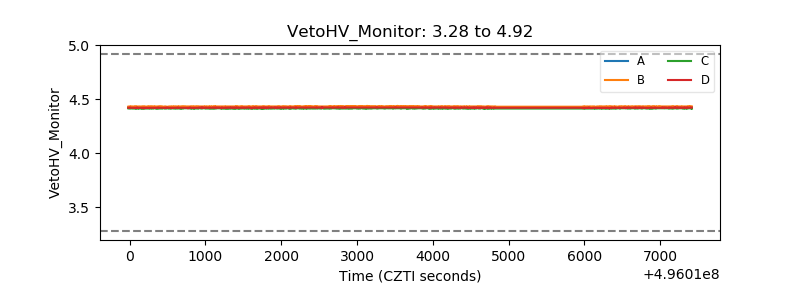 |
| Veto LLD | 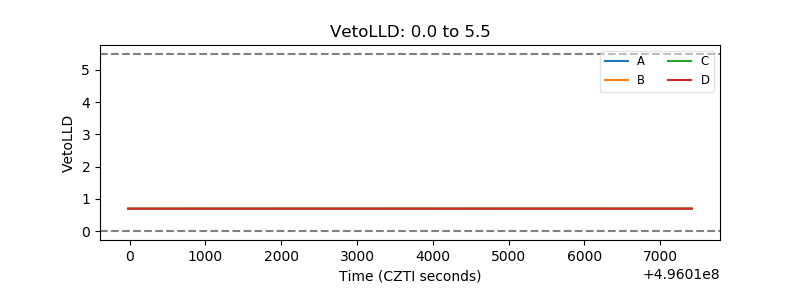 |
| Alpha Counter | 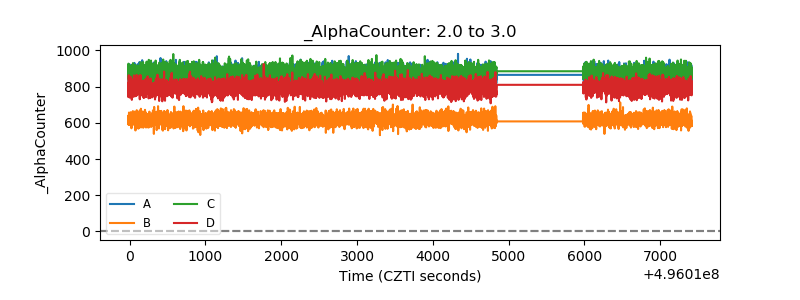 |
| _CPM_Rate | 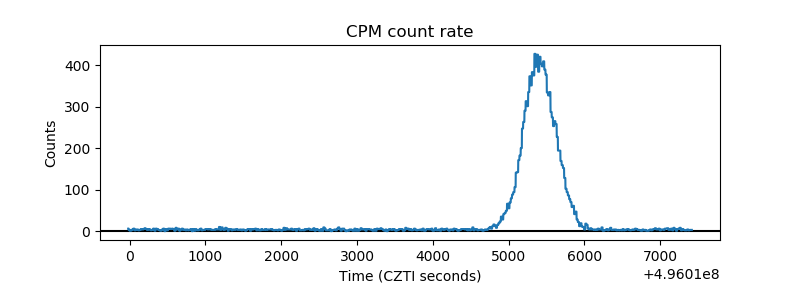 |
| CZT Counter | 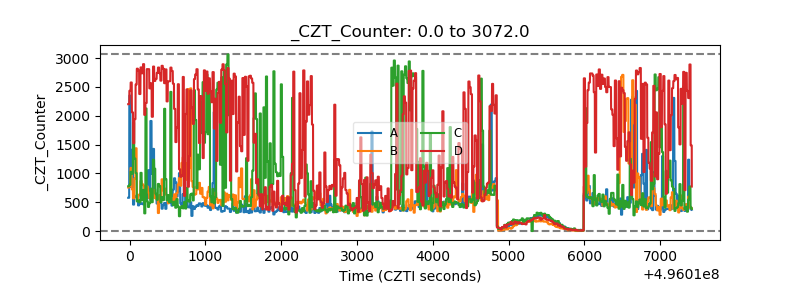 |
| +2.5 Volts monitor |  |
| +5 Volts monitor |  |
| _ROLL_ROT | 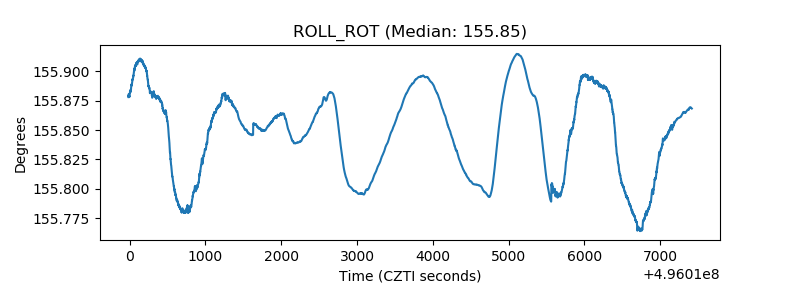 |
| _Roll_DEC | 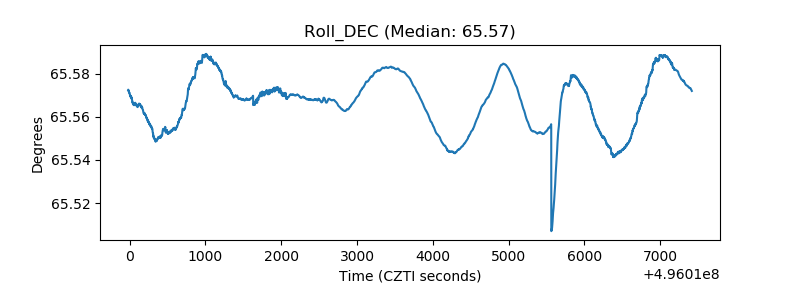 |
| _Roll_RA | 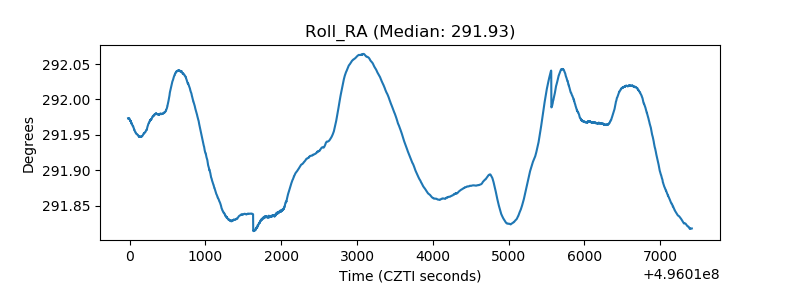 |
| Veto Counter | 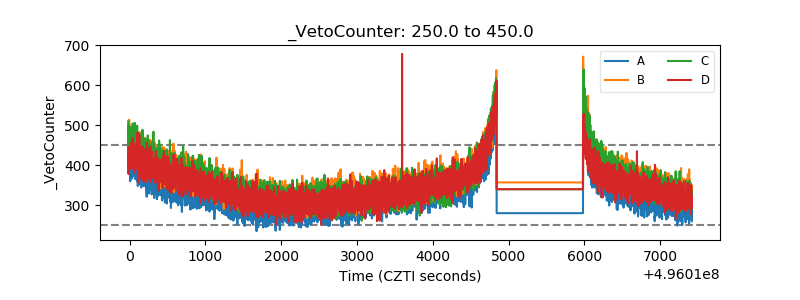 |