| Param | Original file | Final file |
|---|---|---|
| Filename | modeM0/AS1A14_041T01_9000006510_53981cztM0_level2.fits | modeM0/AS1A14_041T01_9000006510_53981cztM0_level2_quad_clean.evt |
| Size (bytes) | 720,800,640 | 84,576,960 |
| Size | 687.4 MB | 80.7 MB |
| Events in quadrant A | 3,972,993 | 621,351 |
| Events in quadrant B | 3,897,599 | 662,570 |
| Events in quadrant C | 7,893,002 | 476,303 |
| Events in quadrant D | 10,402,976 | 337,155 |
| Mode M9 | |||
|---|---|---|---|
| Quadrant | BADHDUFLAG | Total packets | Discarded packets |
| A | 0 | 16 | 0 |
| B | 0 | 17 | 0 |
| C | 0 | 17 | 0 |
| D | 0 | 17 | 0 |
| Mode SS | |||
|---|---|---|---|
| Quadrant | BADHDUFLAG | Total packets | Discarded packets |
| A | 0 | 136 | 0 |
| B | 0 | 136 | 0 |
| C | 0 | 136 | 0 |
| D | 0 | 136 | 0 |
| Mode M0 | |||
|---|---|---|---|
| Quadrant | BADHDUFLAG | Total packets | Discarded packets |
| A | 0 | 16870 | 2 |
| B | 0 | 16530 | 2 |
| C | 0 | 27993 | 2 |
| D | 0 | 35563 | 2 |
| Quadrant | Total seconds | Saturated seconds | Saturation percentage |
|---|---|---|---|
| A | 6641 | 258 | 3.884957% |
| B | 6641 | 394 | 5.932841% |
| C | 6641 | 1679 | 25.282337% |
| D | 6641 | 2842 | 42.794760% |
Noise dominated data is calculated using 1-second bins in cleaned event files. If a bin has >2000 counts, and if more than 50% of those come from <1% of pixels, then it is considered to be noise-dominated and hence unusable.
| Quadrant | # 1 sec bins | Bins with >0 counts | Bins with >2000 counts | High rate bins dominated by noise | Noise dominated (total time) | Noise dominated (detector-on time) | Marked lightcurve |
|---|---|---|---|---|---|---|---|
| A | 7531 | 6642 | 211 | 211 | 2.80% | 3.18% | 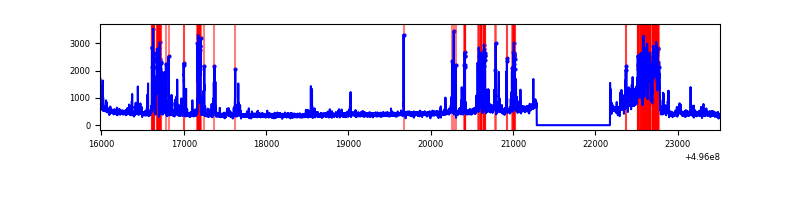 |
| B | 7531 | 6642 | 232 | 232 | 3.08% | 3.49% | 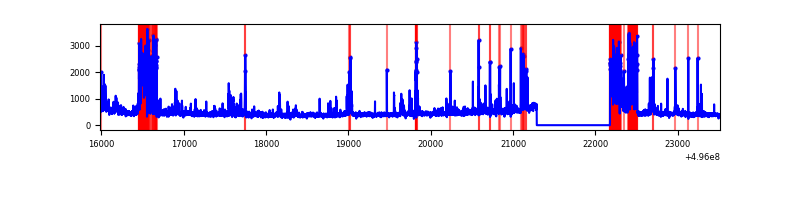 |
| C | 7531 | 6642 | 1610 | 1610 | 21.38% | 24.24% | 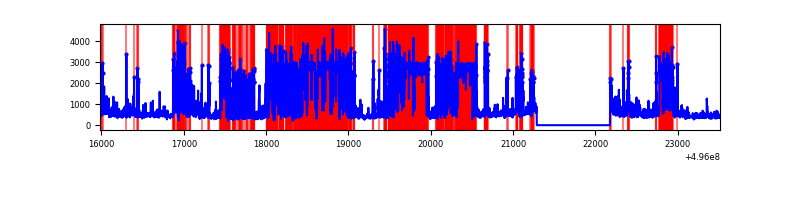 |
| D | 7531 | 6641 | 2658 | 2658 | 35.29% | 40.02% | 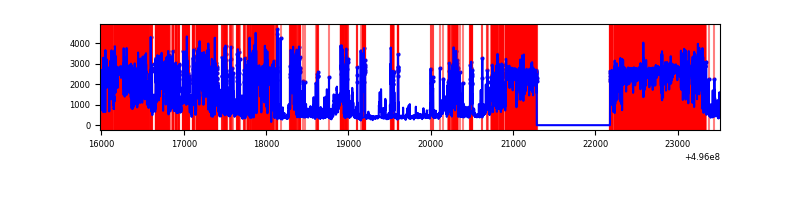 |
Top three noisy pixels from each quadrant. If the there are fewer than three noisy pixels in the level2.evt file, extra rows are filled as -1
| Pixel properties | Quadrant properties | ||||||
|---|---|---|---|---|---|---|---|
| Quadrant | DetID | PixID | Counts | Sigma | Mean | Median | Sigma |
| A | 15 | 174 | 648073 | 3822.73 | 684 | 666 | 169.4 |
| A | 12 | 115 | 479021 | 2824.53 | 684 | 666 | 169.4 |
| A | 10 | 253 | 35448 | 205.38 | 684 | 666 | 169.4 |
| B | 5 | 185 | 732128 | 5086.79 | 677 | 654 | 143.8 |
| B | 0 | 213 | 183731 | 1273.15 | 677 | 654 | 143.8 |
| B | 4 | 81 | 108390 | 749.21 | 677 | 654 | 143.8 |
| C | 1 | 241 | 3681120 | 22326.25 | 595 | 586 | 164.9 |
| C | 12 | 249 | 693711 | 4204.52 | 595 | 586 | 164.9 |
| C | 9 | 38 | 671284 | 4068.48 | 595 | 586 | 164.9 |
| D | 8 | 176 | 7567823 | 52779.35 | 494 | 469 | 143.4 |
| D | 6 | 239 | 277271 | 1930.59 | 494 | 469 | 143.4 |
| D | 2 | 172 | 258680 | 1800.92 | 494 | 469 | 143.4 |
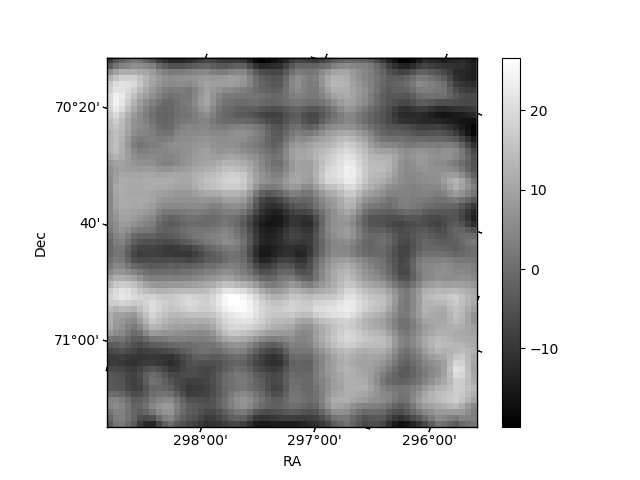
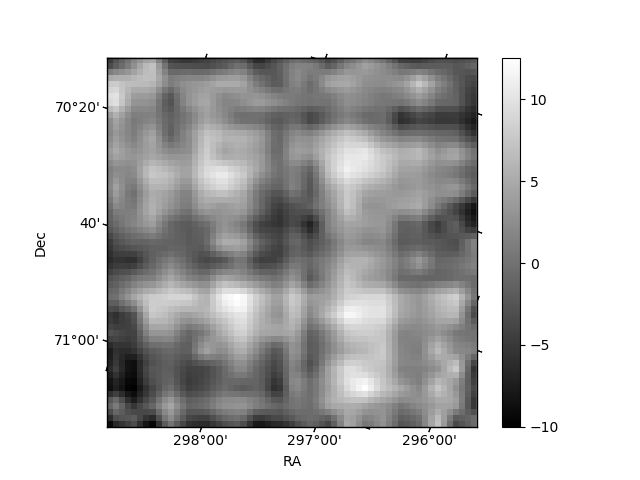
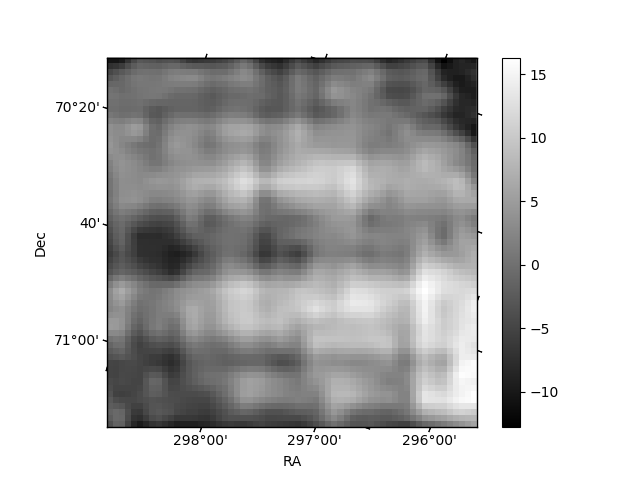
Histogram calculated using DETX and DETY for each event in the final _common_clean file
| Quadrant A | 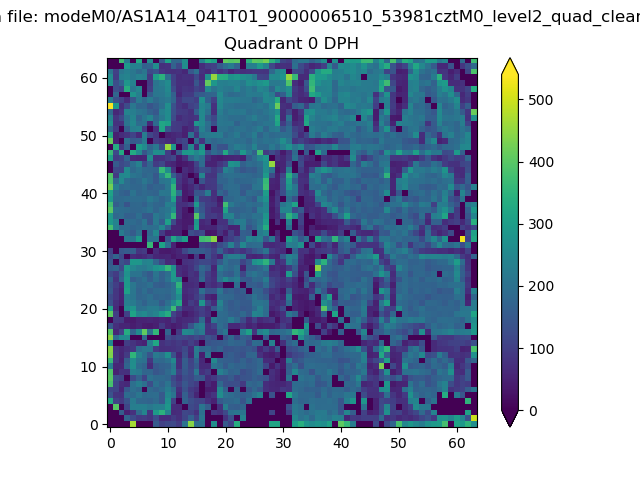 |
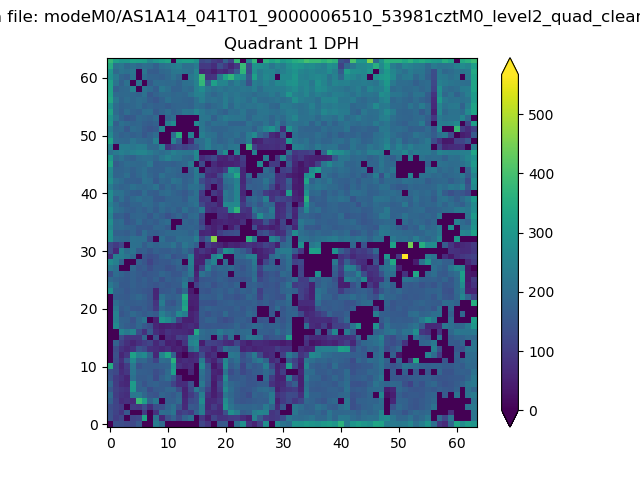 |
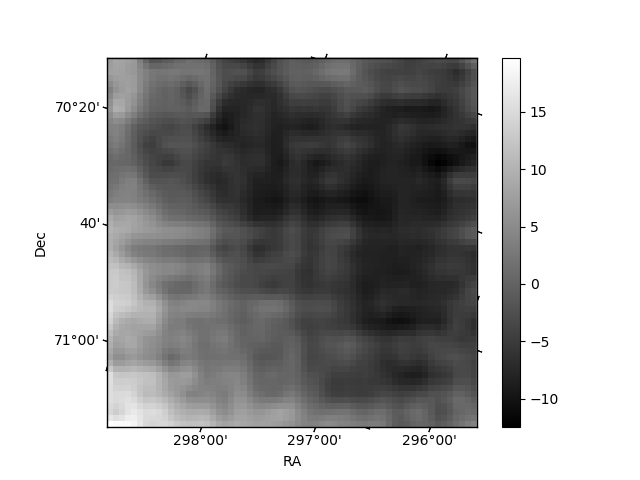
Quadrant B |
|---|---|---|---|
| Quadrant D | 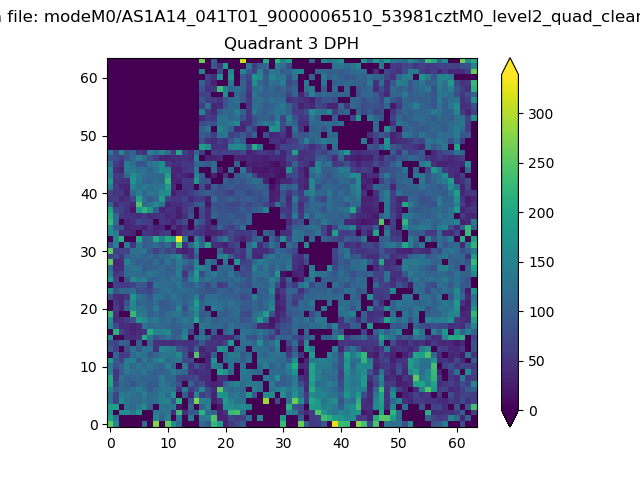 |
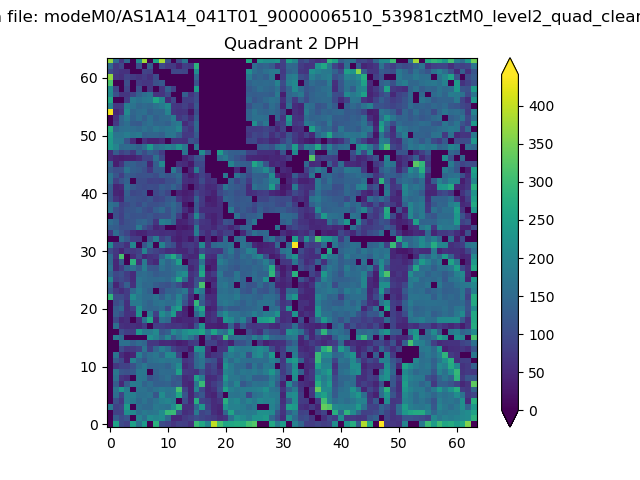 |
Quadrant C |
| Plot type | Count rate plots | Images |
|---|---|---|
| Comparison with Poisson distribution Blue bars denote a histogram of data divided into 1 sec bins. Red curve is a Poisson curve with rate = median count rate of data. |
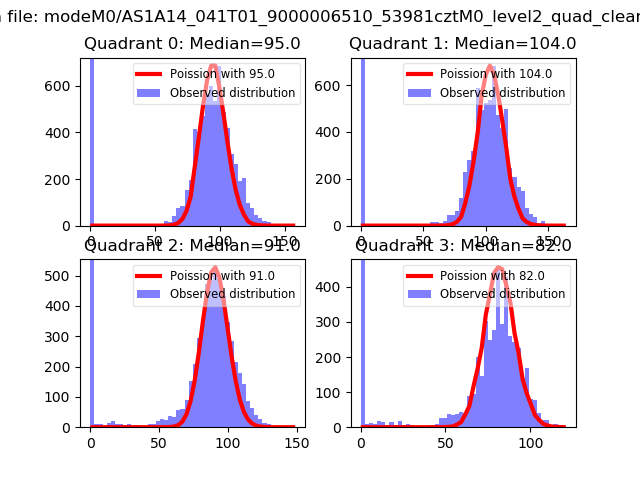 |
 |
| Quadrant-wise count rates Data is divided into 100 sec bins |
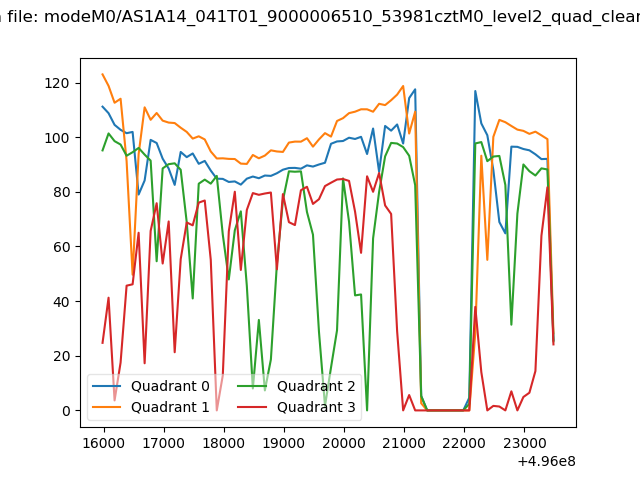 |
|
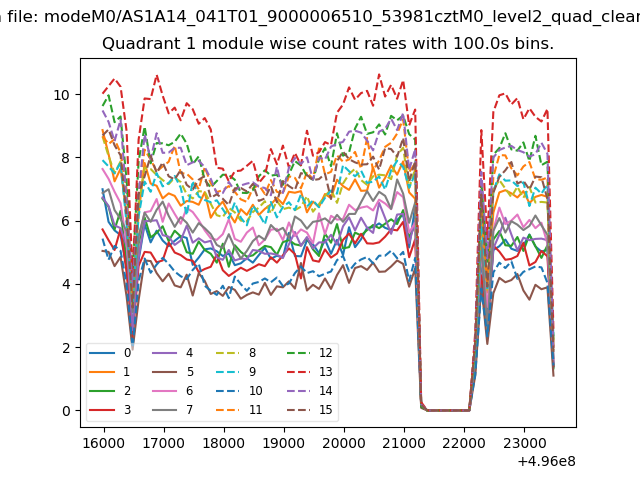
| Module-wise count rates for Quadrant A Data is divided into 100 sec bins |
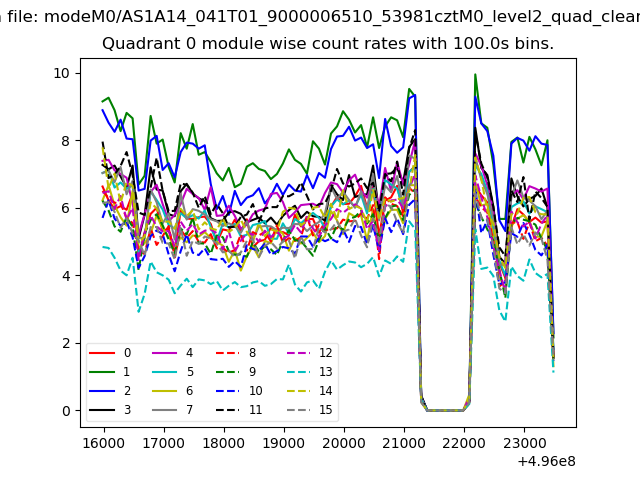 |
 |
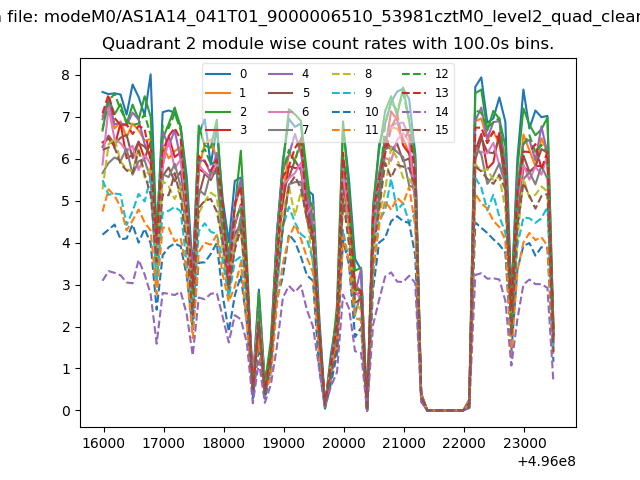
| Module-wise count rates for Quadrant B Data is divided into 100 sec bins |
 |
 |
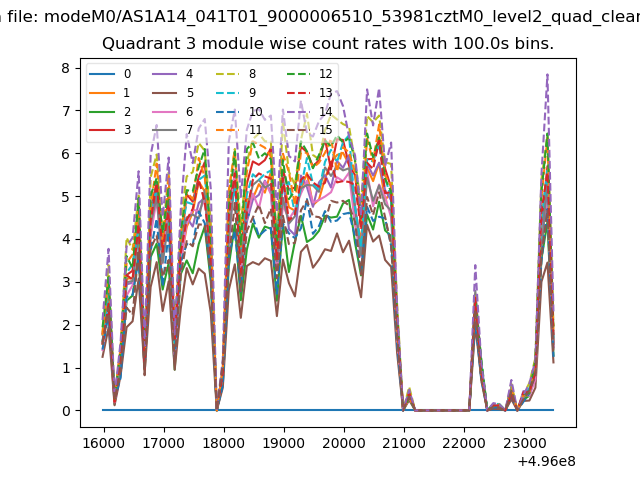
| Module-wise count rates for Quadrant C Data is divided into 100 sec bins |
 |
 |
| Module-wise count rates for Quadrant D Data is divided into 100 sec bins |
 |
 |
| Parameter | Plot |
|---|---|
| CZT HV Monitor | 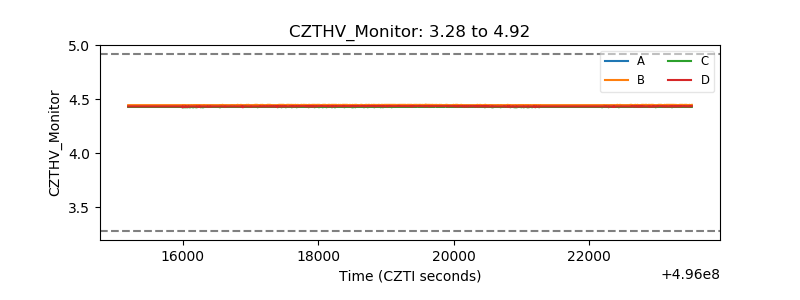 |
| D_VDD | 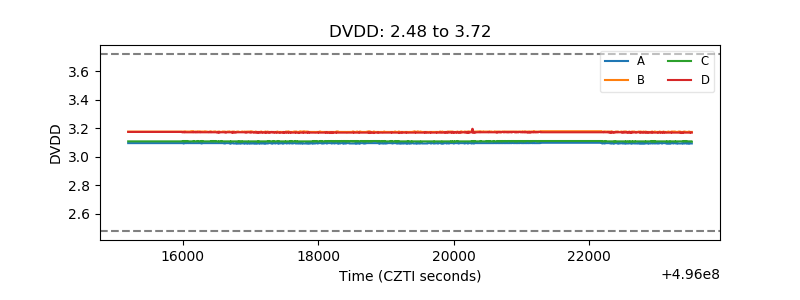 |
| Temperature 1 | 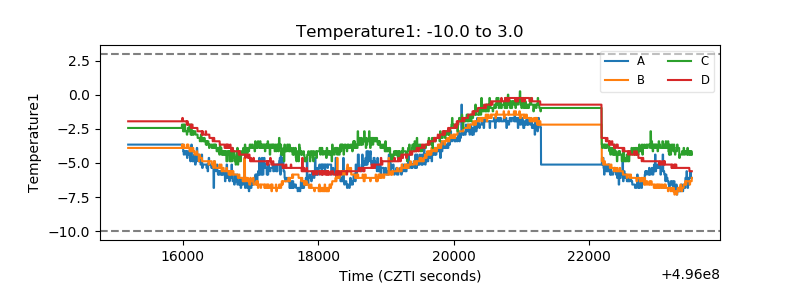 |
| Veto HV Monitor | 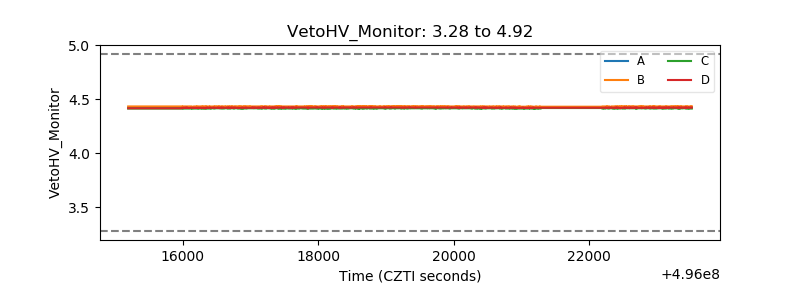 |
| Veto LLD | 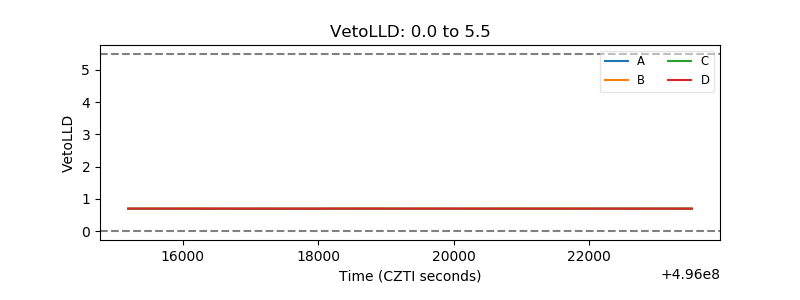 |
| Alpha Counter | 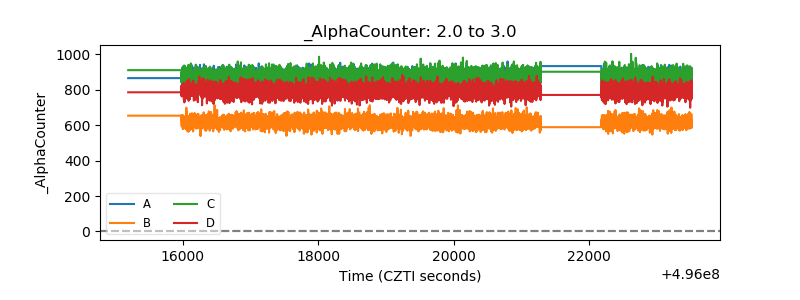 |
| _CPM_Rate | 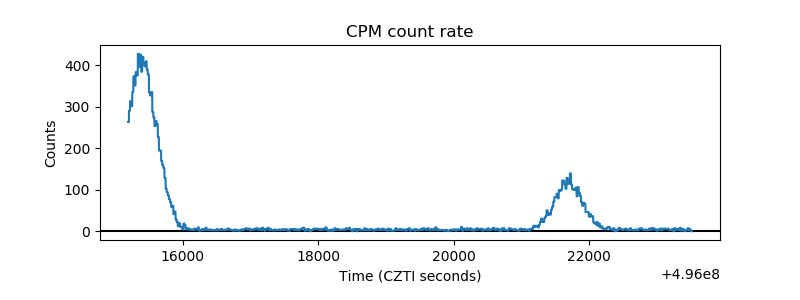 |
| CZT Counter | 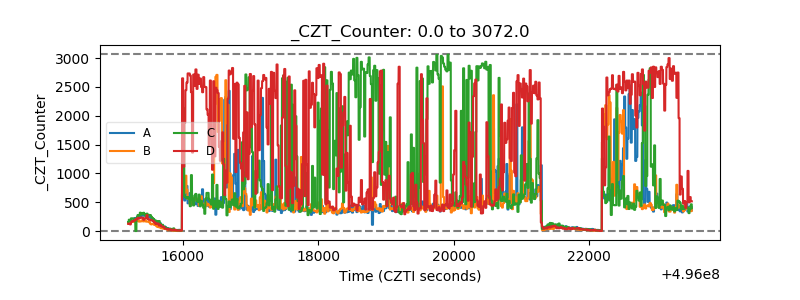 |
| +2.5 Volts monitor |  |
| +5 Volts monitor |  |
| _ROLL_ROT | 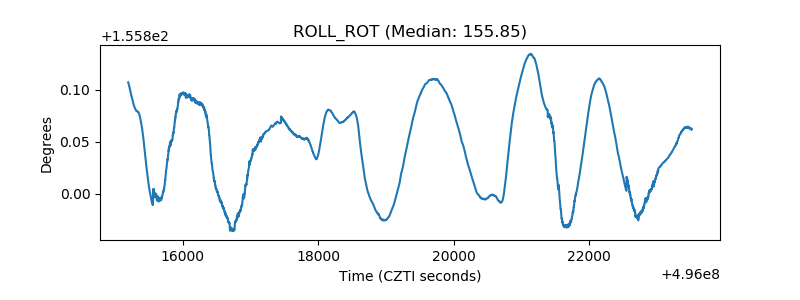 |
| _Roll_DEC | 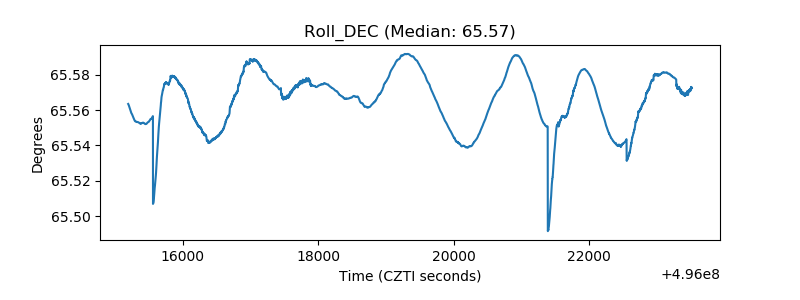 |
| _Roll_RA | 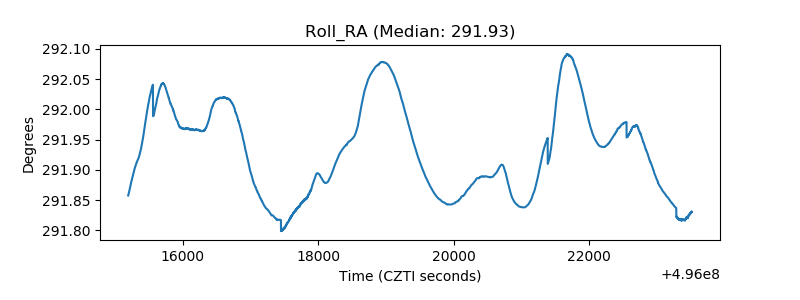 |
| Veto Counter | 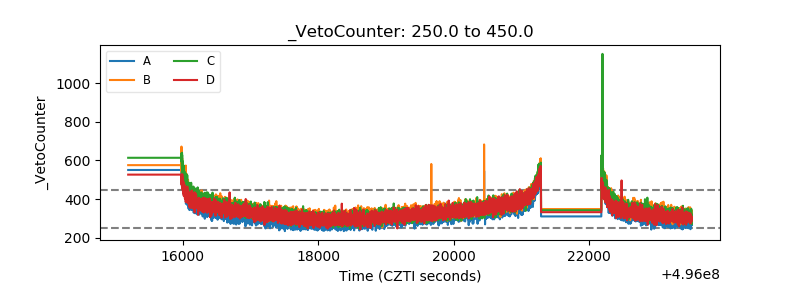 |