| Param | Original file | Final file |
|---|---|---|
| Filename | modeM0/AS1A14_041T01_9000006510_53982cztM0_level2.fits | modeM0/AS1A14_041T01_9000006510_53982cztM0_level2_quad_clean.evt |
| Size (bytes) | 714,055,680 | 93,758,400 |
| Size | 681.0 MB | 89.4 MB |
| Events in quadrant A | 3,974,922 | 682,156 |
| Events in quadrant B | 4,145,748 | 721,961 |
| Events in quadrant C | 5,919,030 | 589,550 |
| Events in quadrant D | 11,822,845 | 334,285 |
| Mode M9 | |||
|---|---|---|---|
| Quadrant | BADHDUFLAG | Total packets | Discarded packets |
| A | 0 | 9 | 0 |
| B | 0 | 10 | 0 |
| C | 0 | 10 | 0 |
| D | 0 | 10 | 0 |
| Mode SS | |||
|---|---|---|---|
| Quadrant | BADHDUFLAG | Total packets | Discarded packets |
| A | 0 | 150 | 0 |
| B | 0 | 150 | 0 |
| C | 0 | 150 | 0 |
| D | 0 | 150 | 0 |
| Mode M0 | |||
|---|---|---|---|
| Quadrant | BADHDUFLAG | Total packets | Discarded packets |
| A | 0 | 17470 | 2 |
| B | 0 | 17891 | 3 |
| C | 0 | 22776 | 2 |
| D | 0 | 40310 | 2 |
| Quadrant | Total seconds | Saturated seconds | Saturation percentage |
|---|---|---|---|
| A | 7335 | 184 | 2.508521% |
| B | 7334 | 380 | 5.181347% |
| C | 7334 | 888 | 12.107990% |
| D | 7334 | 3531 | 48.145623% |
Noise dominated data is calculated using 1-second bins in cleaned event files. If a bin has >2000 counts, and if more than 50% of those come from <1% of pixels, then it is considered to be noise-dominated and hence unusable.
| Quadrant | # 1 sec bins | Bins with >0 counts | Bins with >2000 counts | High rate bins dominated by noise | Noise dominated (total time) | Noise dominated (detector-on time) | Marked lightcurve |
|---|---|---|---|---|---|---|---|
| A | 7725 | 7336 | 152 | 152 | 1.97% | 2.07% | 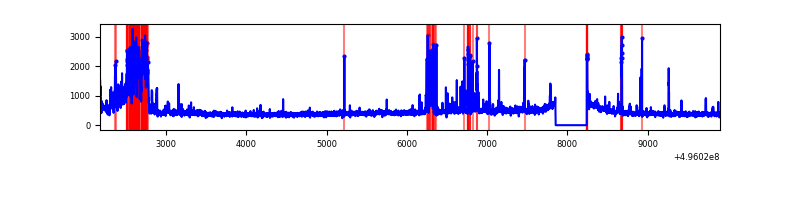 |
| B | 7724 | 7335 | 188 | 188 | 2.43% | 2.56% | 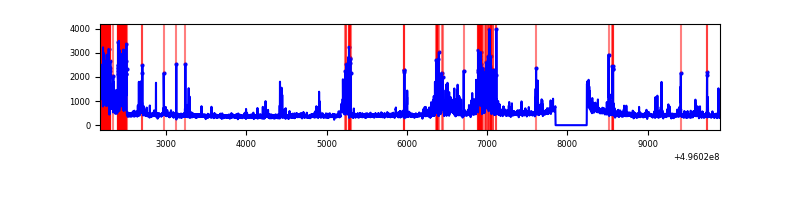 |
| C | 7724 | 7335 | 824 | 824 | 10.67% | 11.23% | 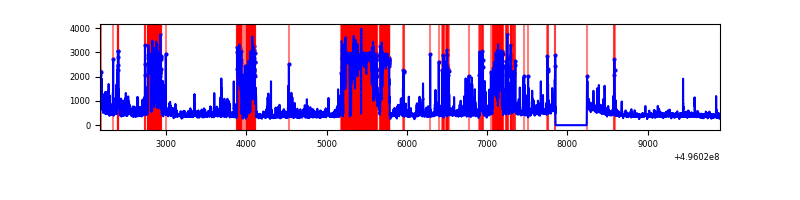 |
| D | 7724 | 7334 | 3188 | 3188 | 41.27% | 43.47% | 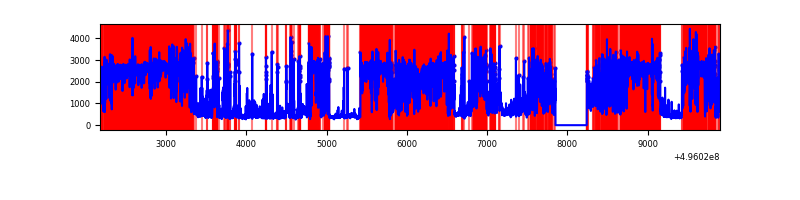 |
Top three noisy pixels from each quadrant. If the there are fewer than three noisy pixels in the level2.evt file, extra rows are filled as -1
| Pixel properties | Quadrant properties | ||||||
|---|---|---|---|---|---|---|---|
| Quadrant | DetID | PixID | Counts | Sigma | Mean | Median | Sigma |
| A | 12 | 115 | 489688 | 2584.18 | 762 | 742 | 189.2 |
| A | 15 | 174 | 314037 | 1655.83 | 762 | 742 | 189.2 |
| A | 4 | 249 | 52724 | 274.74 | 762 | 742 | 189.2 |
| B | 5 | 185 | 581577 | 3595.49 | 753 | 728 | 161.5 |
| B | 0 | 213 | 225002 | 1388.27 | 753 | 728 | 161.5 |
| B | 4 | 81 | 155544 | 958.32 | 753 | 728 | 161.5 |
| C | 12 | 249 | 1785208 | 9150.15 | 709 | 702 | 195.0 |
| C | 1 | 241 | 335175 | 1715.03 | 709 | 702 | 195.0 |
| C | 12 | 2 | 247095 | 1263.39 | 709 | 702 | 195.0 |
| D | 8 | 176 | 8707766 | 57993.76 | 522 | 498 | 150.1 |
| D | 3 | 12 | 436055 | 2900.98 | 522 | 498 | 150.1 |
| D | 6 | 239 | 241227 | 1603.35 | 522 | 498 | 150.1 |
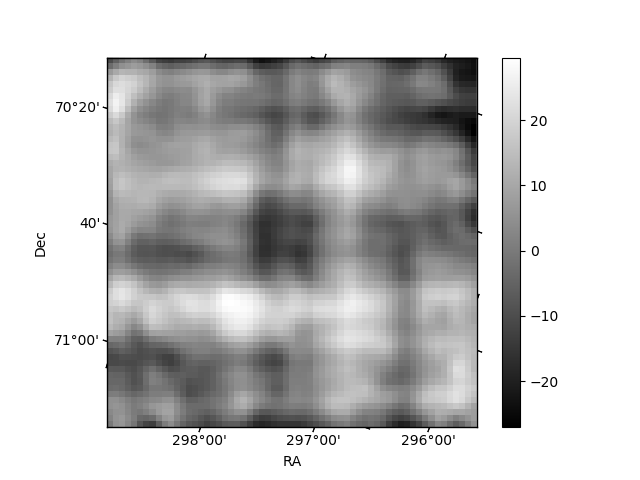
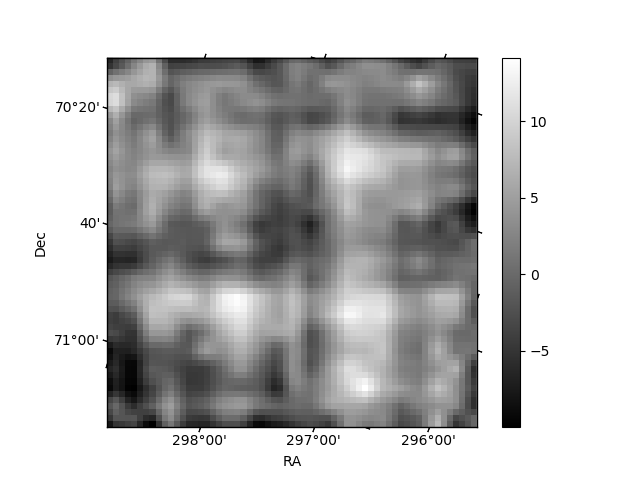
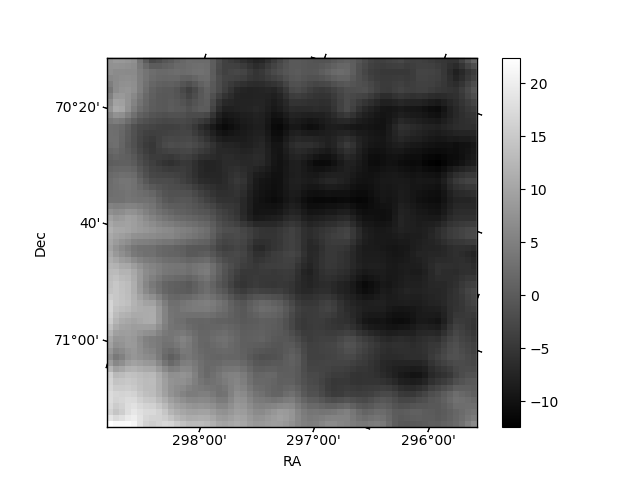
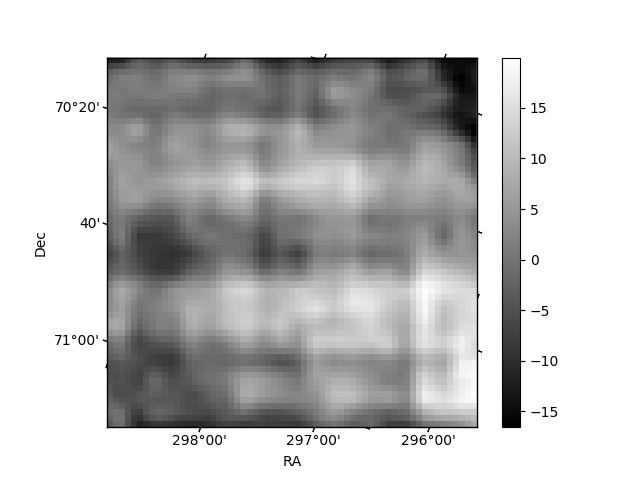
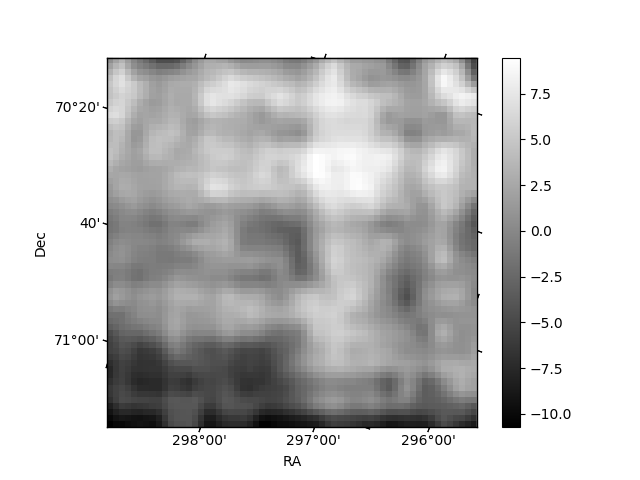
Histogram calculated using DETX and DETY for each event in the final _common_clean file
| Quadrant A | 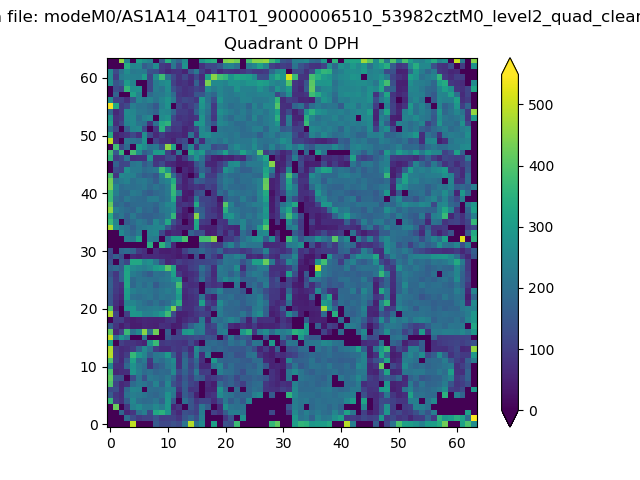 |
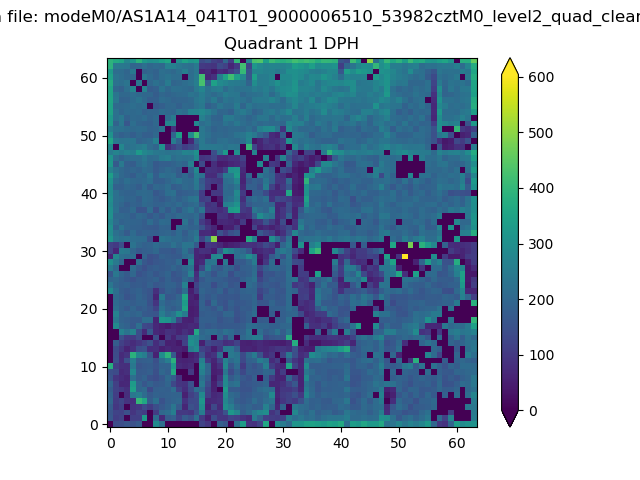 |
Quadrant B |
|---|---|---|---|
| Quadrant D | 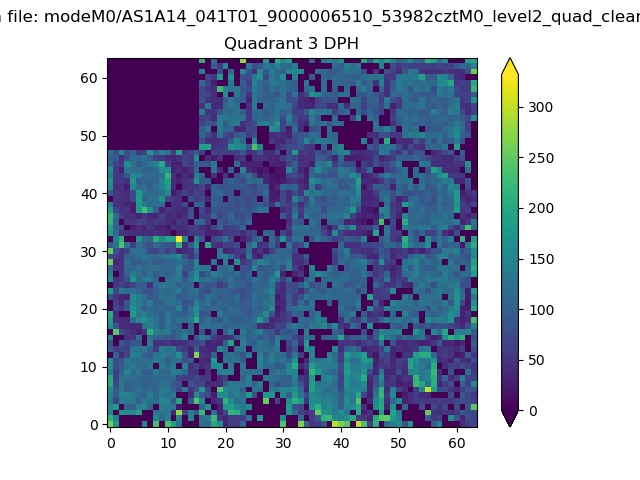 |
 |
Quadrant C |
| Plot type | Count rate plots | Images |
|---|---|---|
| Comparison with Poisson distribution Blue bars denote a histogram of data divided into 1 sec bins. Red curve is a Poisson curve with rate = median count rate of data. |
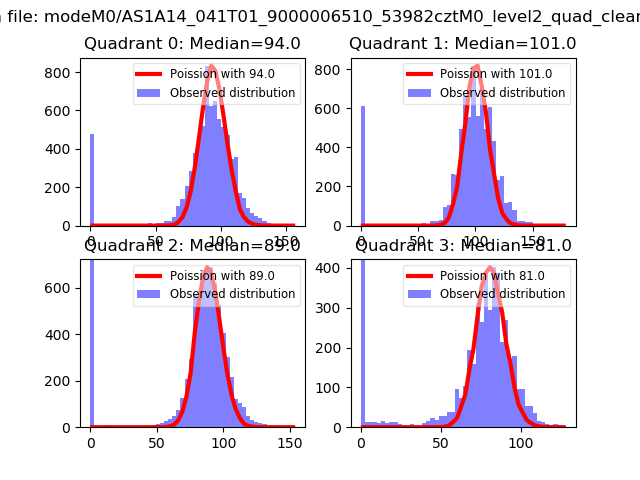 |
 |
| Quadrant-wise count rates Data is divided into 100 sec bins |
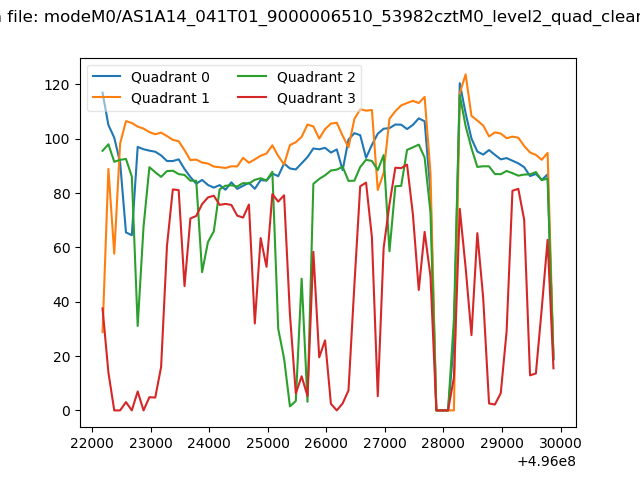 |
|
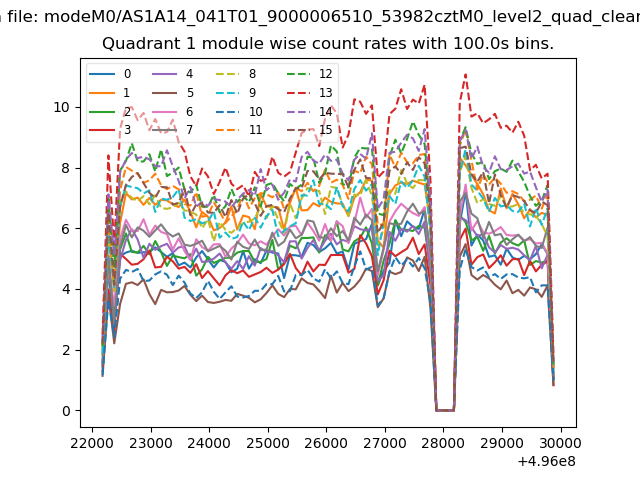
| Module-wise count rates for Quadrant A Data is divided into 100 sec bins |
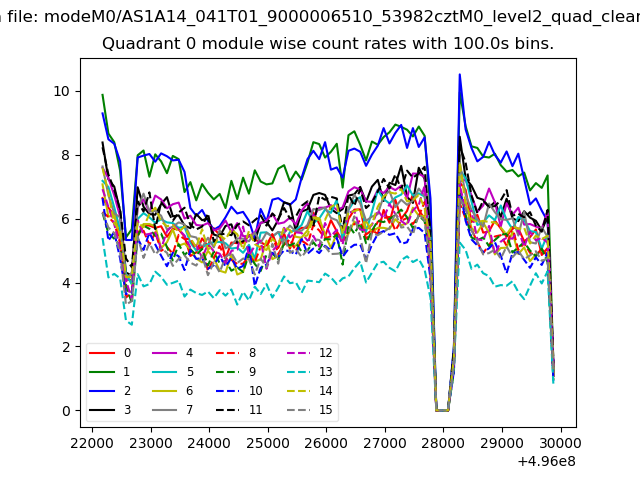 |
 |
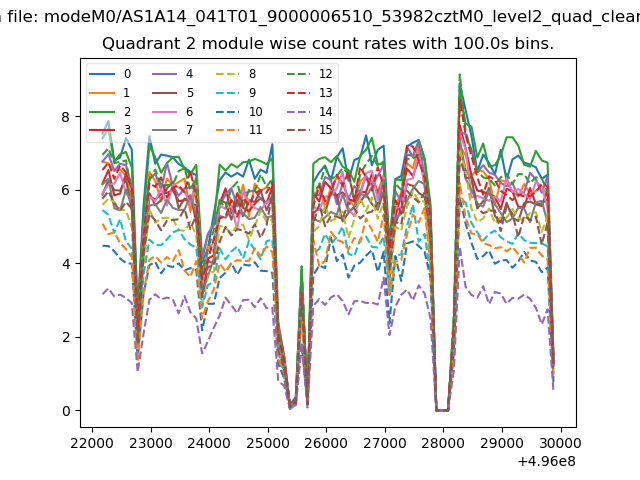
| Module-wise count rates for Quadrant B Data is divided into 100 sec bins |
 |
 |
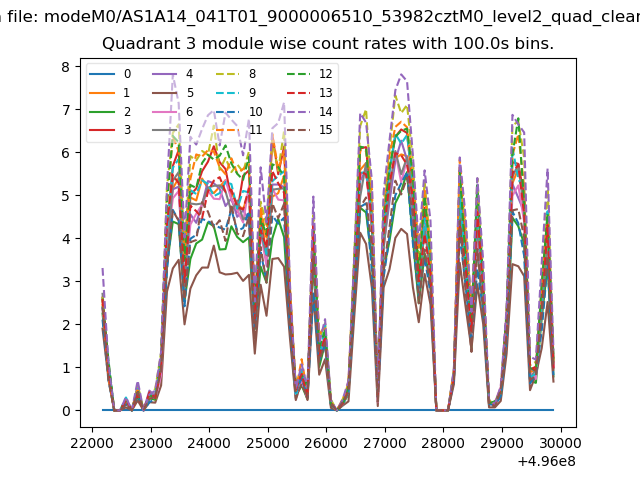
| Module-wise count rates for Quadrant C Data is divided into 100 sec bins |
 |
 |
| Module-wise count rates for Quadrant D Data is divided into 100 sec bins |
 |
 |
| Parameter | Plot |
|---|---|
| CZT HV Monitor | 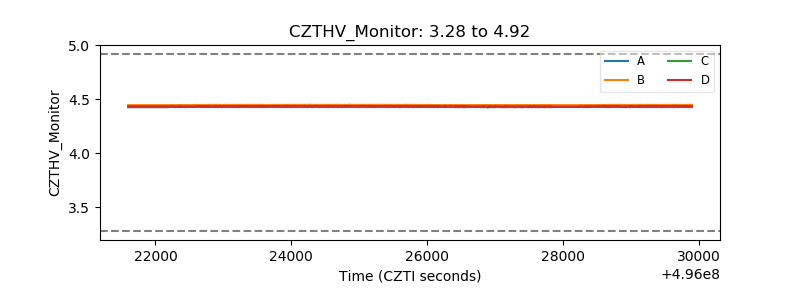 |
| D_VDD | 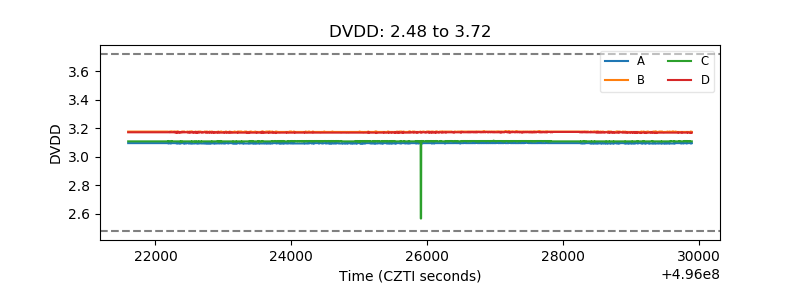 |
| Temperature 1 | 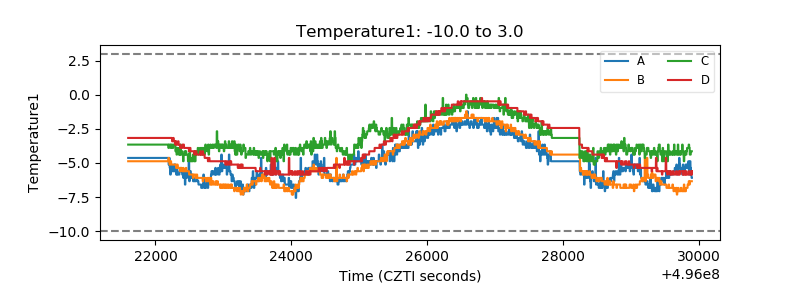 |
| Veto HV Monitor | 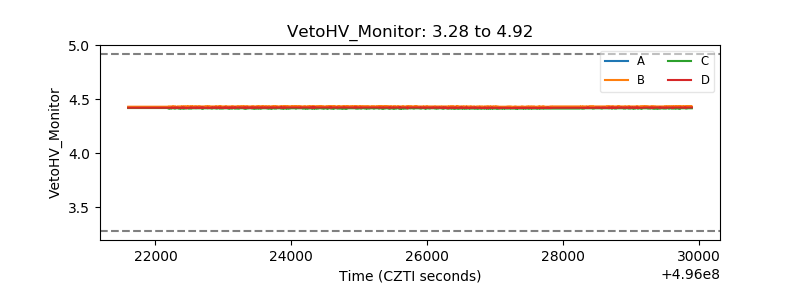 |
| Veto LLD | 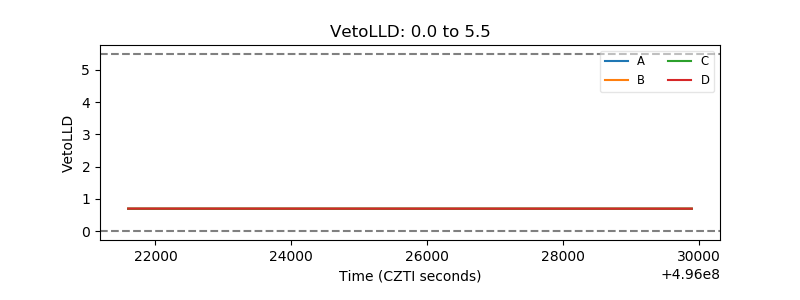 |
| Alpha Counter | 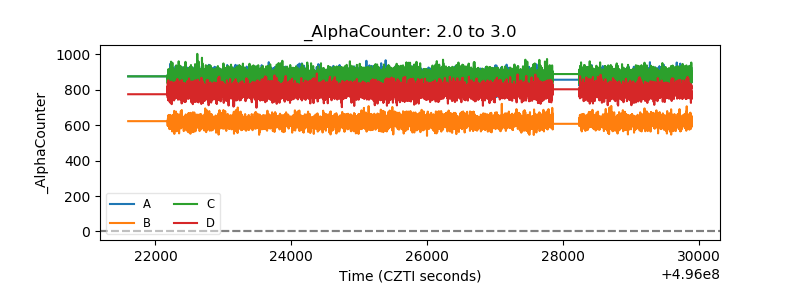 |
| _CPM_Rate | 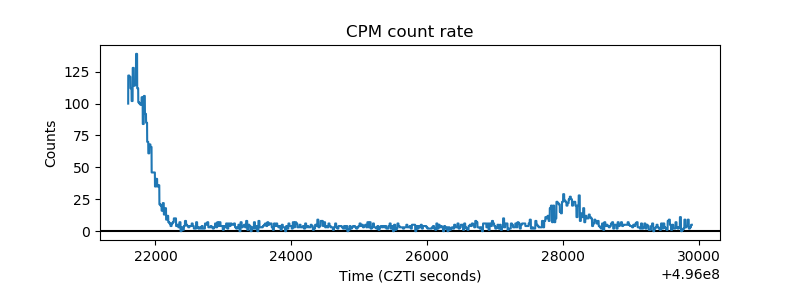 |
| CZT Counter | 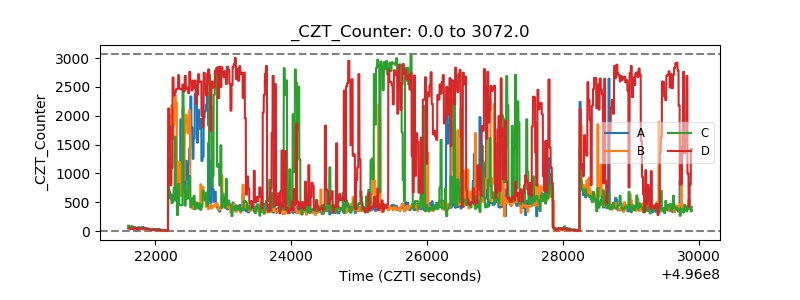 |
| +2.5 Volts monitor |  |
| +5 Volts monitor |  |
| _ROLL_ROT | 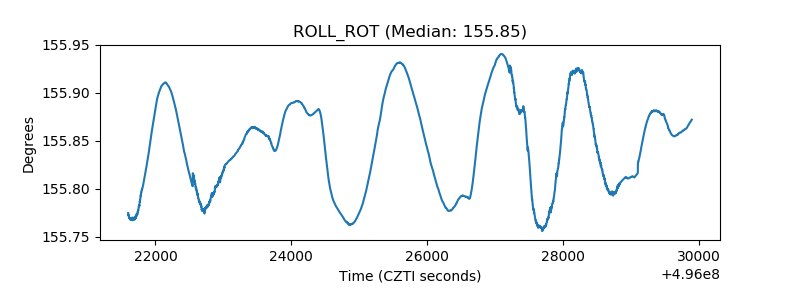 |
| _Roll_DEC | 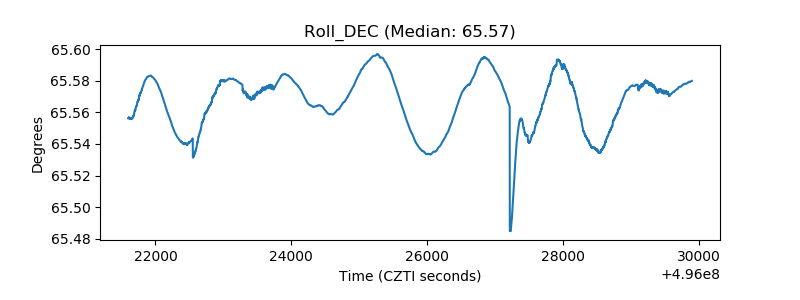 |
| _Roll_RA | 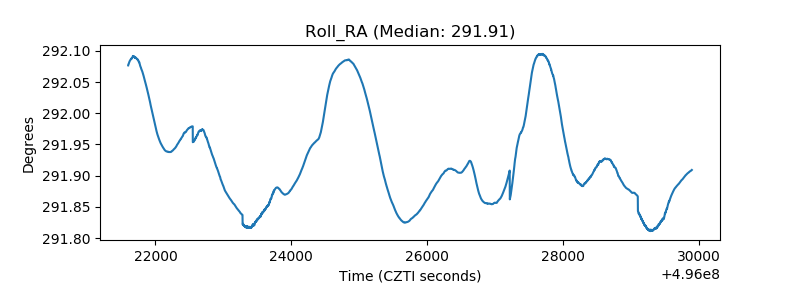 |
| Veto Counter | 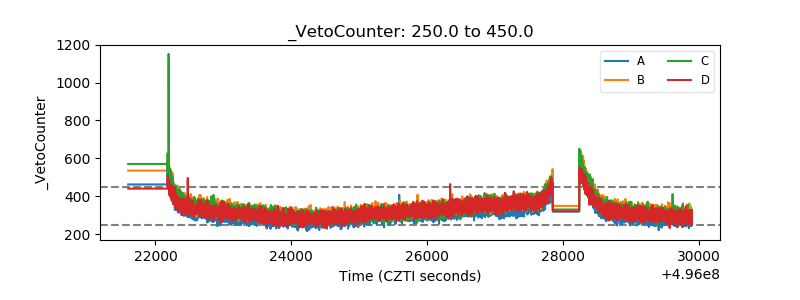 |