| Param | Original file | Final file |
|---|---|---|
| Filename | modeM0/AS1A14_041T01_9000006510_53983cztM0_level2.fits | modeM0/AS1A14_041T01_9000006510_53983cztM0_level2_quad_clean.evt |
| Size (bytes) | 799,856,640 | 98,562,240 |
| Size | 762.8 MB | 94.0 MB |
| Events in quadrant A | 4,339,438 | 727,156 |
| Events in quadrant B | 4,119,791 | 797,114 |
| Events in quadrant C | 3,866,651 | 711,569 |
| Events in quadrant D | 16,664,425 | 195,936 |
| Mode SS | |||
|---|---|---|---|
| Quadrant | BADHDUFLAG | Total packets | Discarded packets |
| A | 0 | 158 | 0 |
| B | 0 | 158 | 0 |
| C | 0 | 158 | 0 |
| D | 0 | 158 | 0 |
| Mode M0 | |||
|---|---|---|---|
| Quadrant | BADHDUFLAG | Total packets | Discarded packets |
| A | 0 | 18967 | 0 |
| B | 0 | 18147 | 0 |
| C | 0 | 17522 | 0 |
| D | 0 | 55000 | 0 |
| Quadrant | Total seconds | Saturated seconds | Saturation percentage |
|---|---|---|---|
| A | 7948 | 229 | 2.881228% |
| B | 7949 | 209 | 2.629262% |
| C | 7949 | 98 | 1.232859% |
| D | 7948 | 5816 | 73.175642% |
Noise dominated data is calculated using 1-second bins in cleaned event files. If a bin has >2000 counts, and if more than 50% of those come from <1% of pixels, then it is considered to be noise-dominated and hence unusable.
| Quadrant | # 1 sec bins | Bins with >0 counts | Bins with >2000 counts | High rate bins dominated by noise | Noise dominated (total time) | Noise dominated (detector-on time) | Marked lightcurve |
|---|---|---|---|---|---|---|---|
| A | 7948 | 7948 | 166 | 166 | 2.09% | 2.09% | 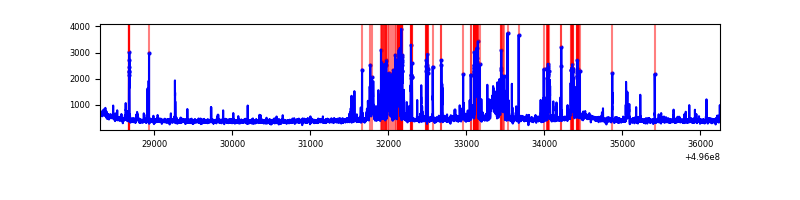 |
| B | 7949 | 7949 | 124 | 124 | 1.56% | 1.56% | 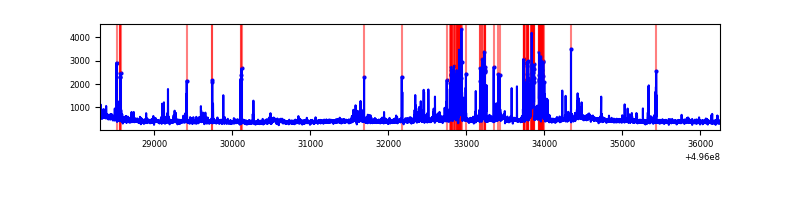 |
| C | 7949 | 7949 | 60 | 60 | 0.75% | 0.75% | 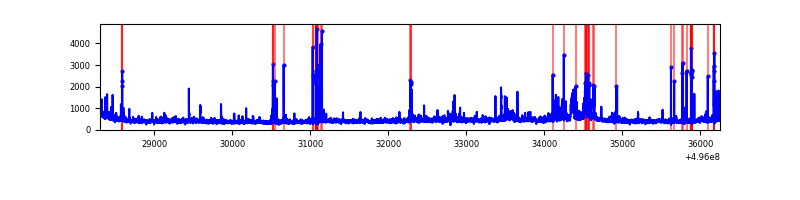 |
| D | 7947 | 7947 | 5297 | 5297 | 66.65% | 66.65% | 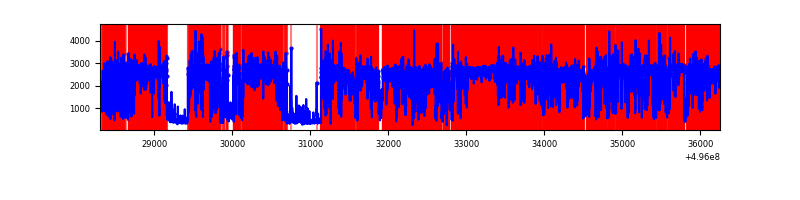 |
Top three noisy pixels from each quadrant. If the there are fewer than three noisy pixels in the level2.evt file, extra rows are filled as -1
| Pixel properties | Quadrant properties | ||||||
|---|---|---|---|---|---|---|---|
| Quadrant | DetID | PixID | Counts | Sigma | Mean | Median | Sigma |
| A | 15 | 174 | 717055 | 3552.8 | 819 | 798 | 201.6 |
| A | 0 | 8 | 224117 | 1107.71 | 819 | 798 | 201.6 |
| A | 7 | 14 | 63588 | 311.45 | 819 | 798 | 201.6 |
| B | 5 | 185 | 422811 | 2372.21 | 826 | 797 | 177.9 |
| B | 0 | 213 | 169666 | 949.24 | 826 | 797 | 177.9 |
| B | 5 | 172 | 90297 | 503.09 | 826 | 797 | 177.9 |
| C | 12 | 249 | 177205 | 787.36 | 810 | 798 | 224.1 |
| C | 15 | 209 | 133193 | 590.92 | 810 | 798 | 224.1 |
| C | 12 | 252 | 70120 | 309.4 | 810 | 798 | 224.1 |
| D | 8 | 176 | 13566958 | 108150.28 | 433 | 413 | 125.4 |
| D | 2 | 165 | 527585 | 4202.53 | 433 | 413 | 125.4 |
| D | 3 | 12 | 313939 | 2499.38 | 433 | 413 | 125.4 |
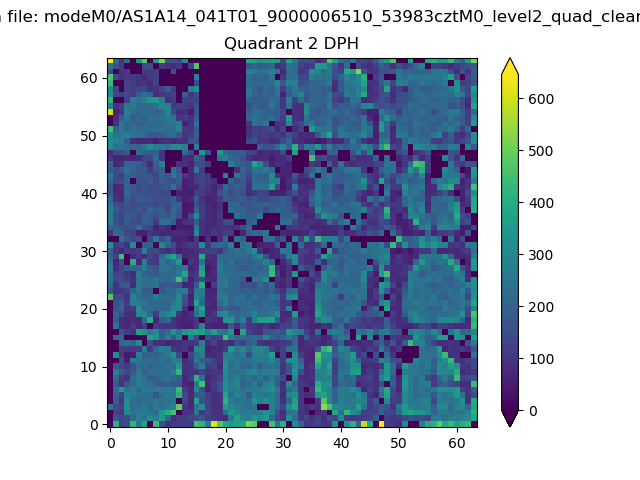
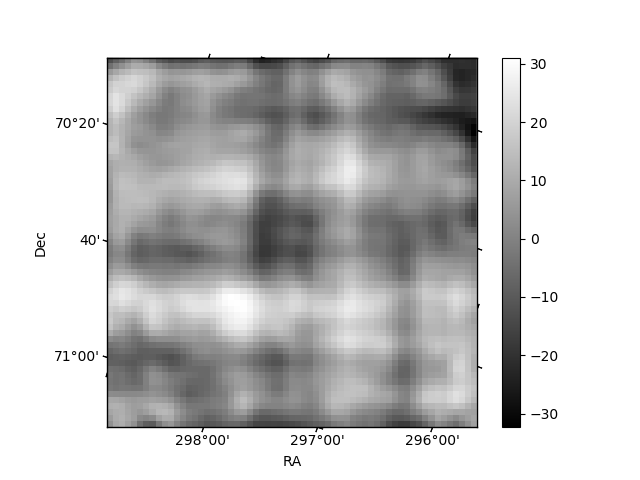
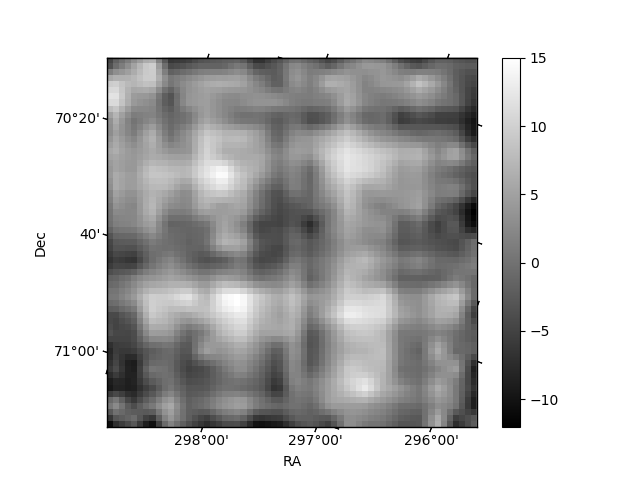
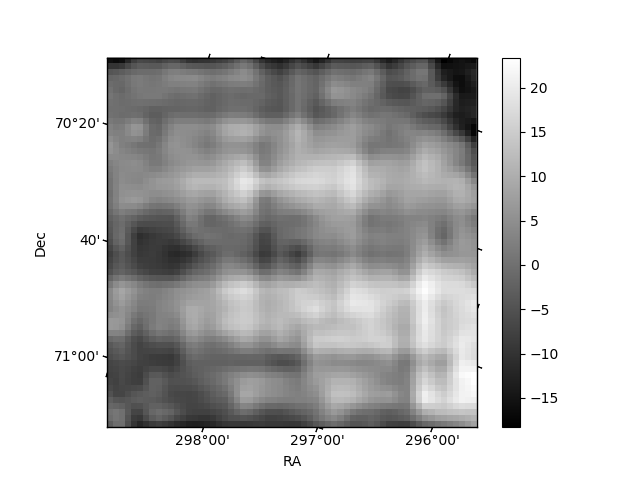
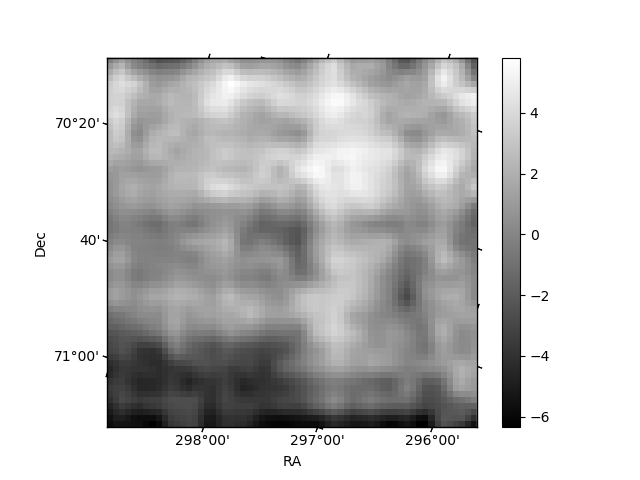
Histogram calculated using DETX and DETY for each event in the final _common_clean file
| Quadrant A | 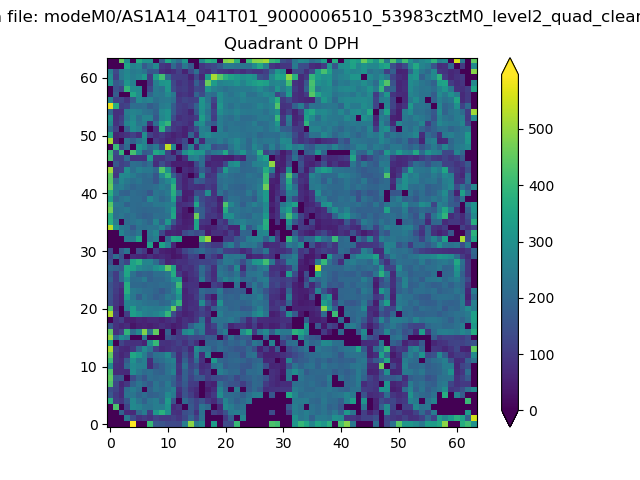 |
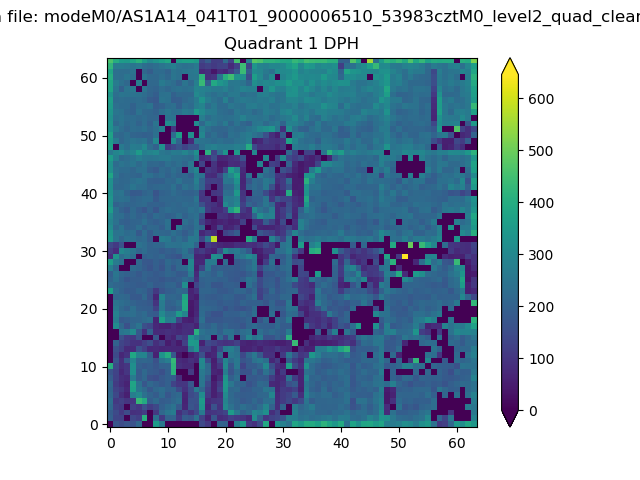 |
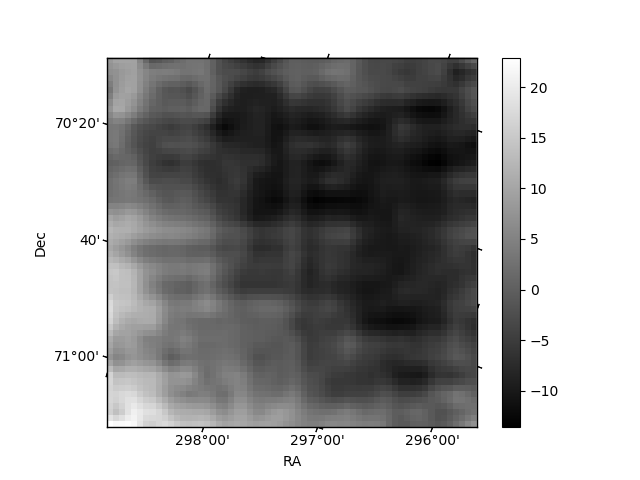
Quadrant B |
|---|---|---|---|
| Quadrant D | 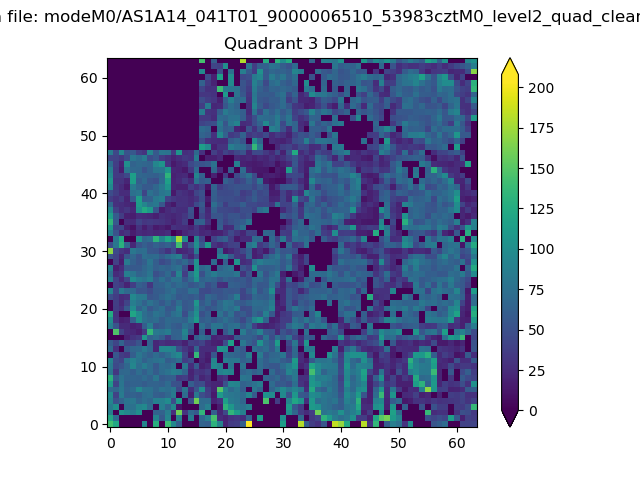 |
 |
Quadrant C |
| Plot type | Count rate plots | Images |
|---|---|---|
| Comparison with Poisson distribution Blue bars denote a histogram of data divided into 1 sec bins. Red curve is a Poisson curve with rate = median count rate of data. |
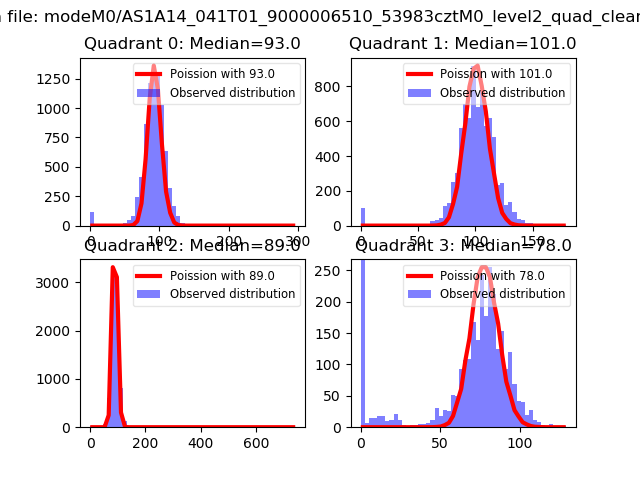 |
 |
| Quadrant-wise count rates Data is divided into 100 sec bins |
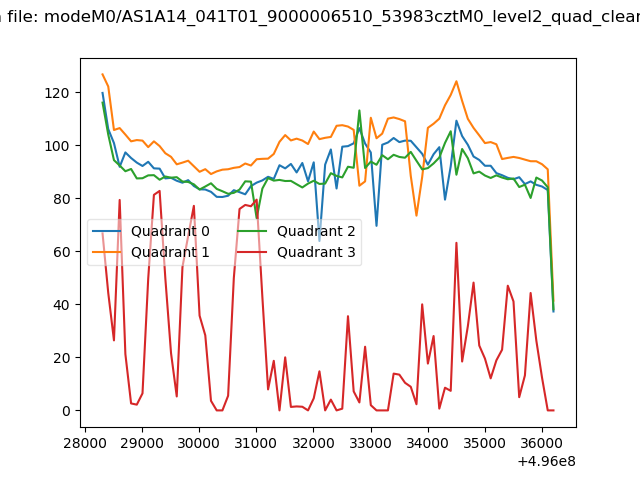 |
|
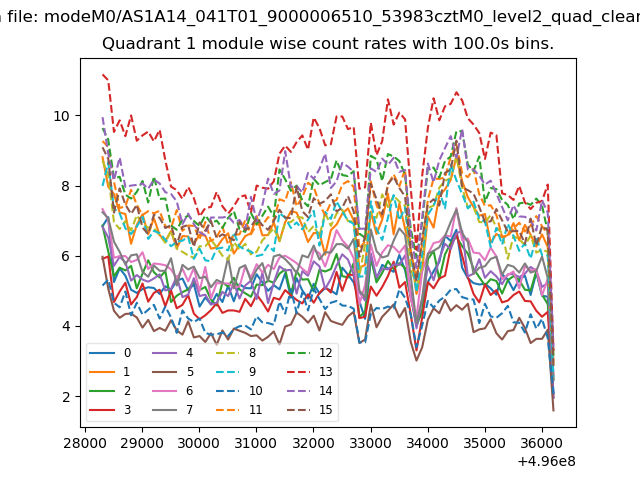
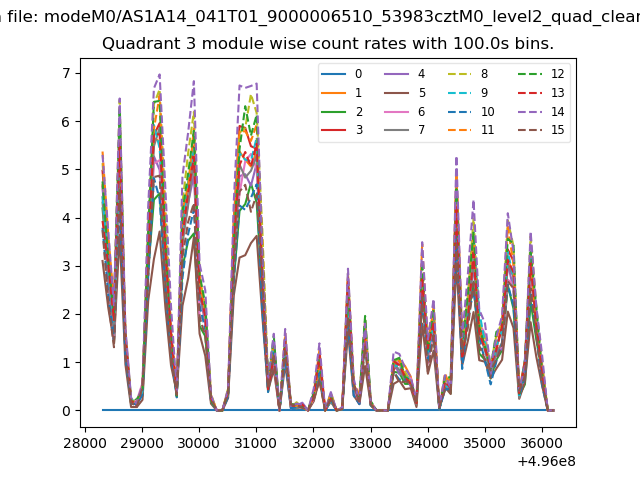
| Module-wise count rates for Quadrant A Data is divided into 100 sec bins |
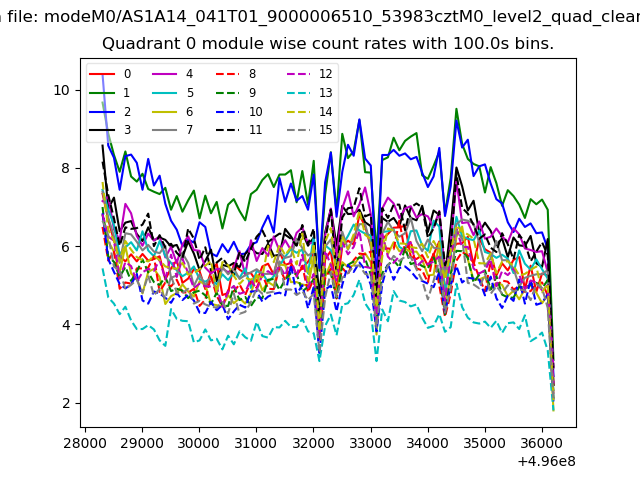 |
 |
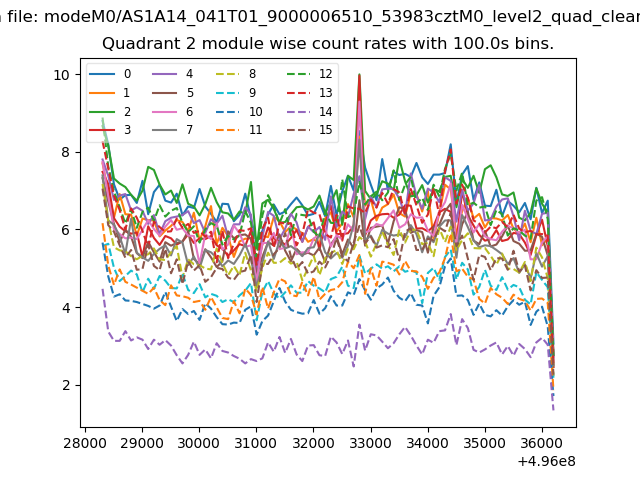
| Module-wise count rates for Quadrant B Data is divided into 100 sec bins |
 |
 |
| Module-wise count rates for Quadrant C Data is divided into 100 sec bins |
 |
 |
| Module-wise count rates for Quadrant D Data is divided into 100 sec bins |
 |
 |
| Parameter | Plot |
|---|---|
| CZT HV Monitor | 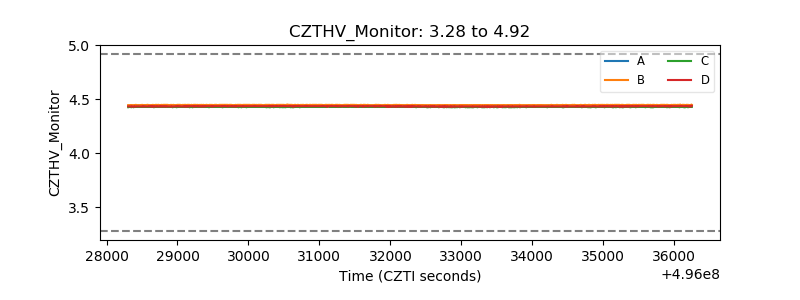 |
| D_VDD | 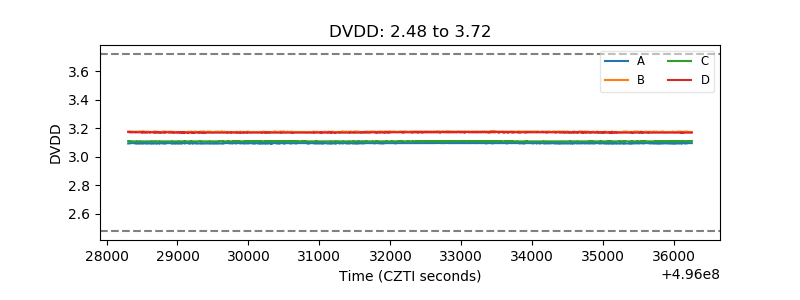 |
| Temperature 1 | 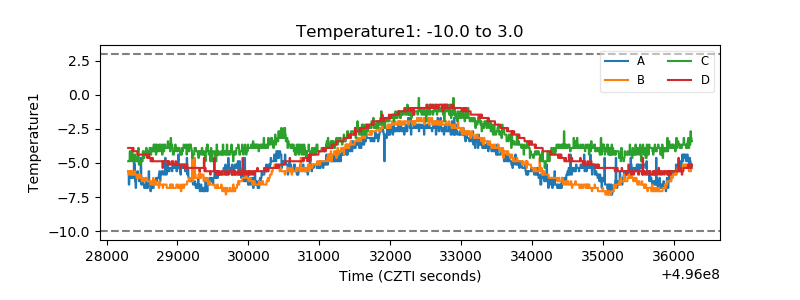 |
| Veto HV Monitor | 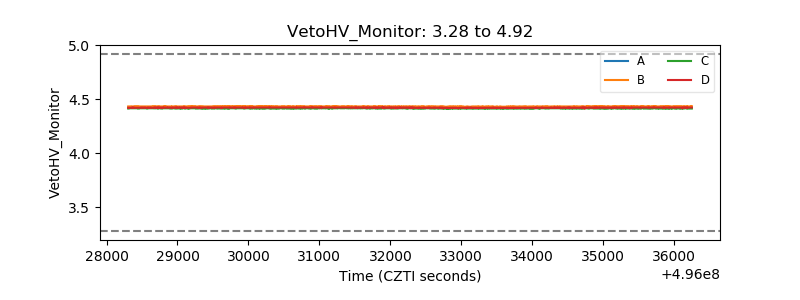 |
| Veto LLD | 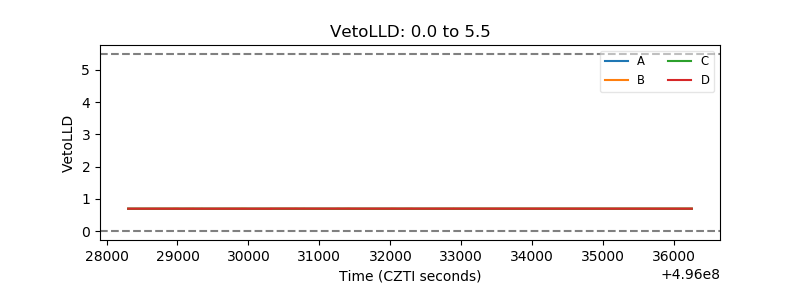 |
| Alpha Counter | 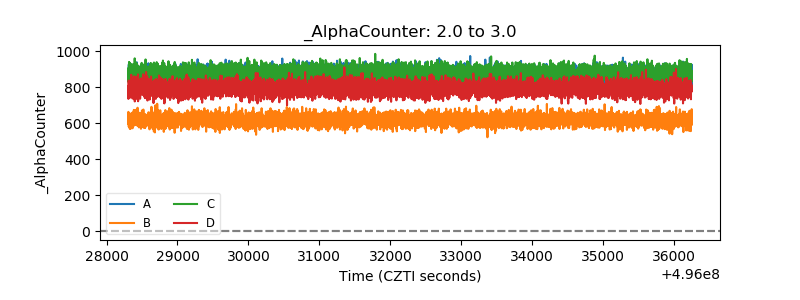 |
| _CPM_Rate | 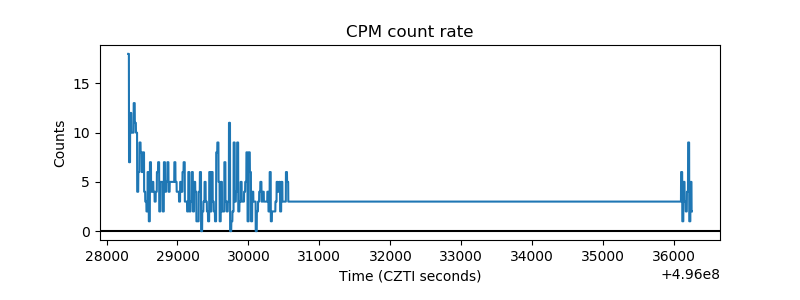 |
| CZT Counter | 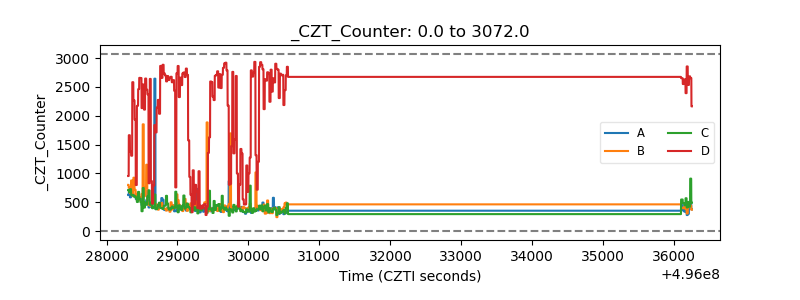 |
| +2.5 Volts monitor |  |
| +5 Volts monitor |  |
| _ROLL_ROT | 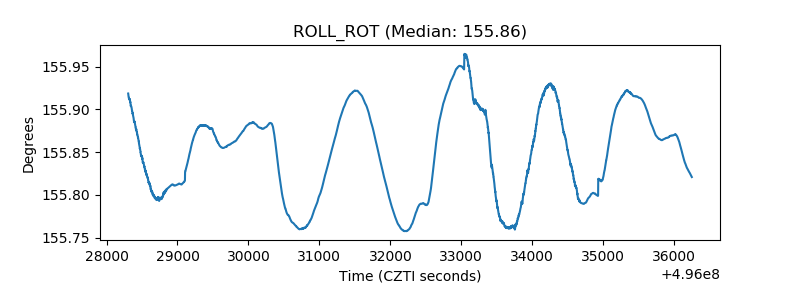 |
| _Roll_DEC | 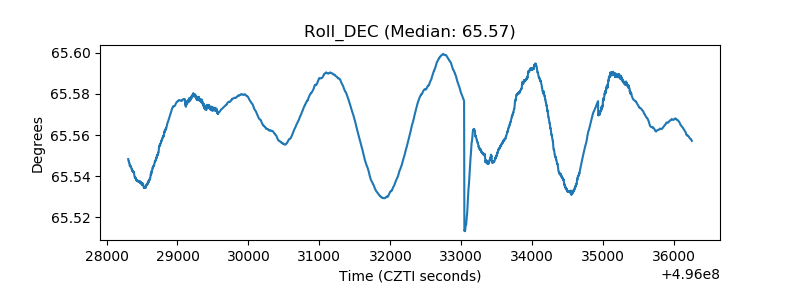 |
| _Roll_RA | 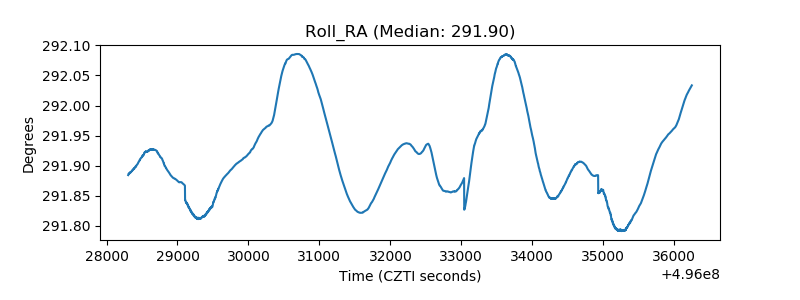 |
| Veto Counter | 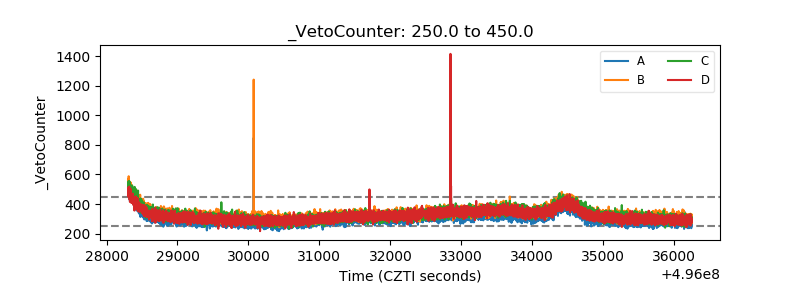 |