| Param | Original file | Final file |
|---|---|---|
| Filename | modeM0/AS1A14_041T01_9000006510_53984cztM0_level2.fits | modeM0/AS1A14_041T01_9000006510_53984cztM0_level2_quad_clean.evt |
| Size (bytes) | 884,851,200 | 97,727,040 |
| Size | 843.9 MB | 93.2 MB |
| Events in quadrant A | 5,192,942 | 722,543 |
| Events in quadrant B | 4,455,916 | 816,753 |
| Events in quadrant C | 4,312,760 | 718,853 |
| Events in quadrant D | 18,160,764 | 135,487 |
| Mode SS | |||
|---|---|---|---|
| Quadrant | BADHDUFLAG | Total packets | Discarded packets |
| A | 0 | 162 | 0 |
| B | 0 | 162 | 0 |
| C | 0 | 162 | 0 |
| D | 0 | 162 | 0 |
| Mode M0 | |||
|---|---|---|---|
| Quadrant | BADHDUFLAG | Total packets | Discarded packets |
| A | 0 | 21424 | 0 |
| B | 0 | 19226 | 0 |
| C | 0 | 18554 | 1 |
| D | 0 | 59478 | 0 |
| Quadrant | Total seconds | Saturated seconds | Saturation percentage |
|---|---|---|---|
| A | 8135 | 433 | 5.322680% |
| B | 8135 | 151 | 1.856177% |
| C | 8134 | 118 | 1.450701% |
| D | 8135 | 6663 | 81.905347% |
Noise dominated data is calculated using 1-second bins in cleaned event files. If a bin has >2000 counts, and if more than 50% of those come from <1% of pixels, then it is considered to be noise-dominated and hence unusable.
| Quadrant | # 1 sec bins | Bins with >0 counts | Bins with >2000 counts | High rate bins dominated by noise | Noise dominated (total time) | Noise dominated (detector-on time) | Marked lightcurve |
|---|---|---|---|---|---|---|---|
| A | 8135 | 8135 | 322 | 322 | 3.96% | 3.96% | 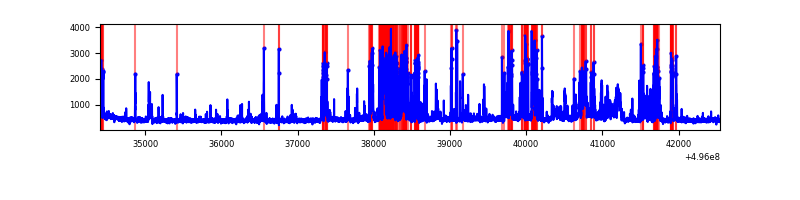 |
| B | 8135 | 8135 | 85 | 85 | 1.04% | 1.04% | 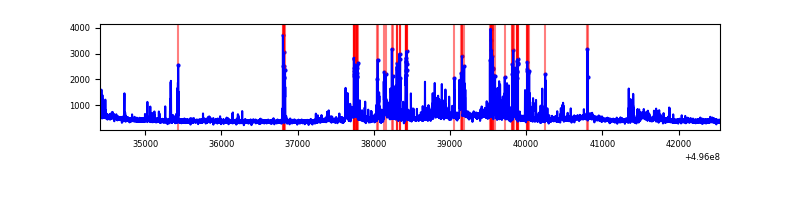 |
| C | 8134 | 8134 | 93 | 93 | 1.14% | 1.14% | 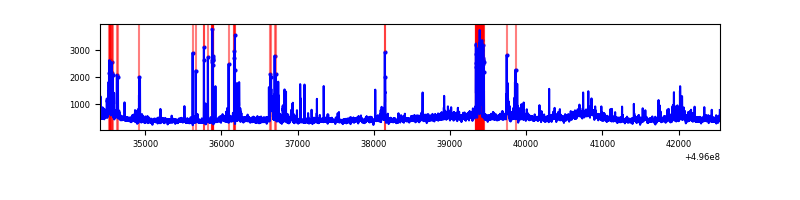 |
| D | 8135 | 8135 | 6229 | 6229 | 76.57% | 76.57% | 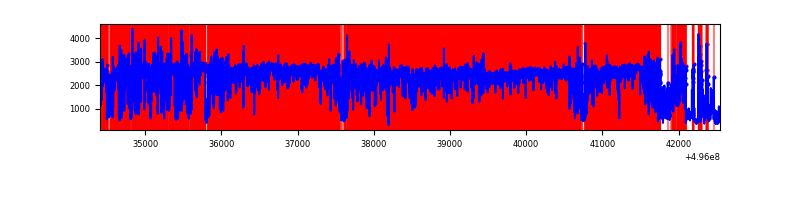 |
Top three noisy pixels from each quadrant. If the there are fewer than three noisy pixels in the level2.evt file, extra rows are filled as -1
| Pixel properties | Quadrant properties | ||||||
|---|---|---|---|---|---|---|---|
| Quadrant | DetID | PixID | Counts | Sigma | Mean | Median | Sigma |
| A | 15 | 174 | 832124 | 4016.84 | 829 | 807 | 207.0 |
| A | 13 | 248 | 495735 | 2391.45 | 829 | 807 | 207.0 |
| A | 0 | 8 | 265139 | 1277.23 | 829 | 807 | 207.0 |
| B | 5 | 250 | 272829 | 1491.23 | 845 | 814 | 182.4 |
| B | 0 | 213 | 269553 | 1473.27 | 845 | 814 | 182.4 |
| B | 2 | 249 | 245666 | 1342.32 | 845 | 814 | 182.4 |
| C | 4 | 5 | 349313 | 1546.84 | 824 | 817 | 225.3 |
| C | 12 | 249 | 237196 | 1049.2 | 824 | 817 | 225.3 |
| C | 15 | 209 | 169847 | 750.26 | 824 | 817 | 225.3 |
| D | 8 | 176 | 11253866 | 112320.95 | 347 | 331 | 100.2 |
| D | 2 | 165 | 4544926 | 45359.37 | 347 | 331 | 100.2 |
| D | 5 | 113 | 320037 | 3190.97 | 347 | 331 | 100.2 |
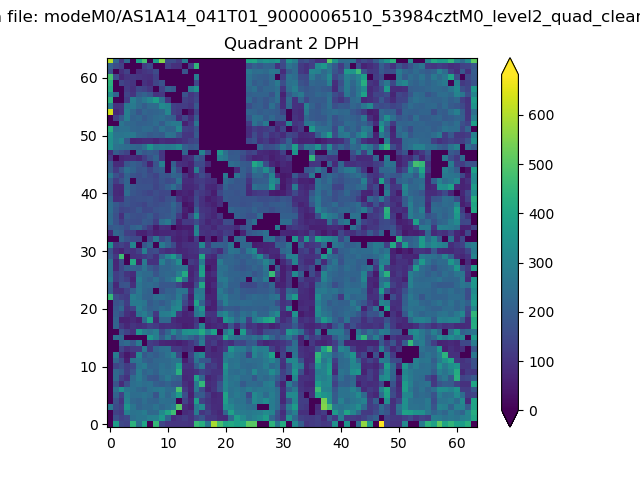
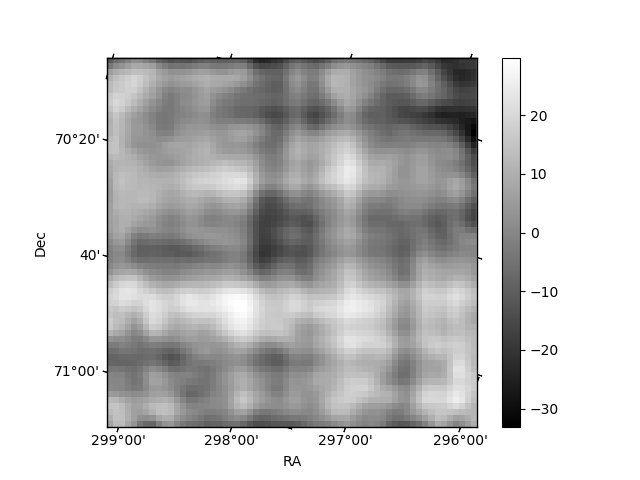
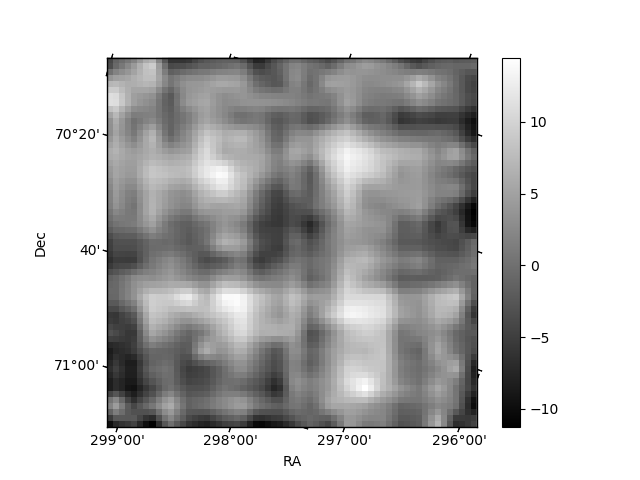
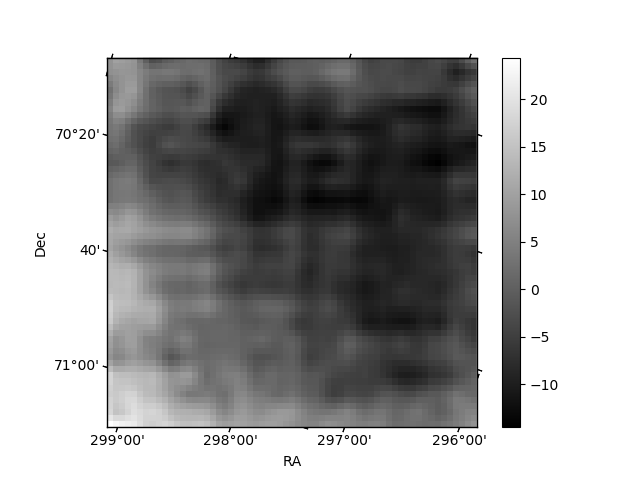
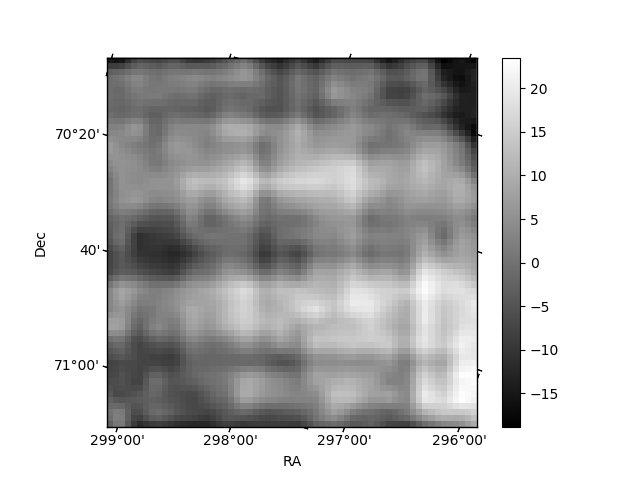
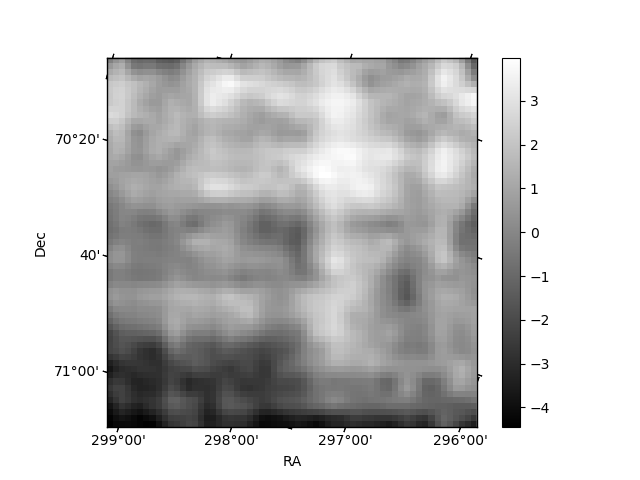
Histogram calculated using DETX and DETY for each event in the final _common_clean file
| Quadrant A | 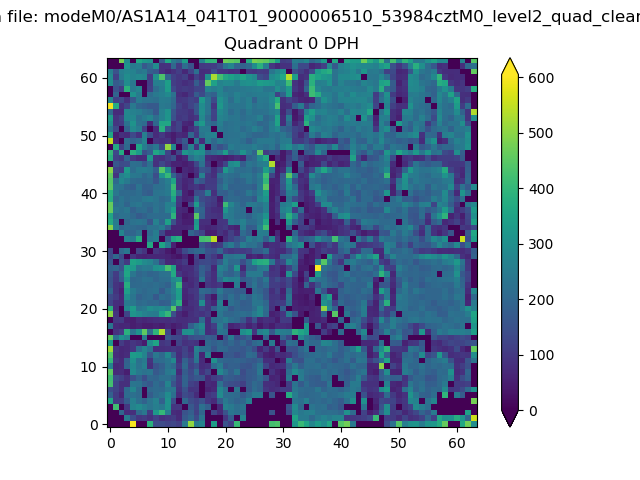 |
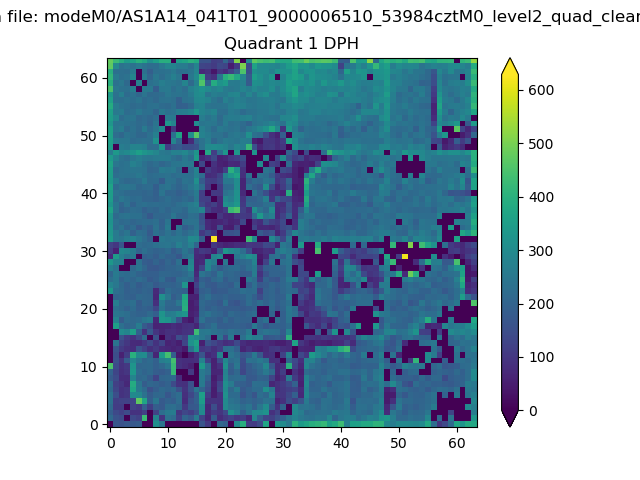 |
Quadrant B |
|---|---|---|---|
| Quadrant D | 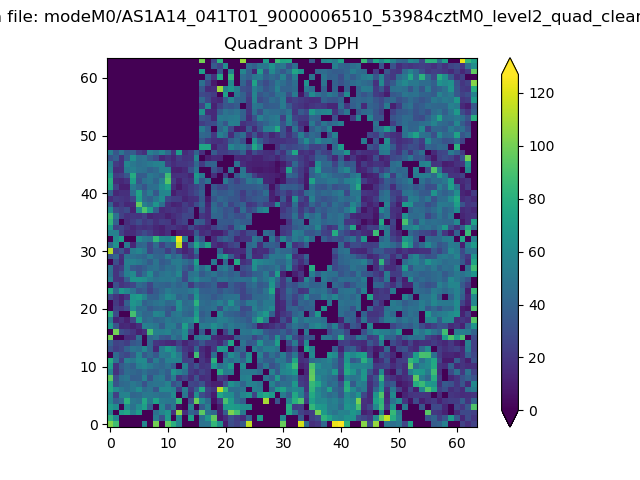 |
 |
Quadrant C |
| Plot type | Count rate plots | Images |
|---|---|---|
| Comparison with Poisson distribution Blue bars denote a histogram of data divided into 1 sec bins. Red curve is a Poisson curve with rate = median count rate of data. |
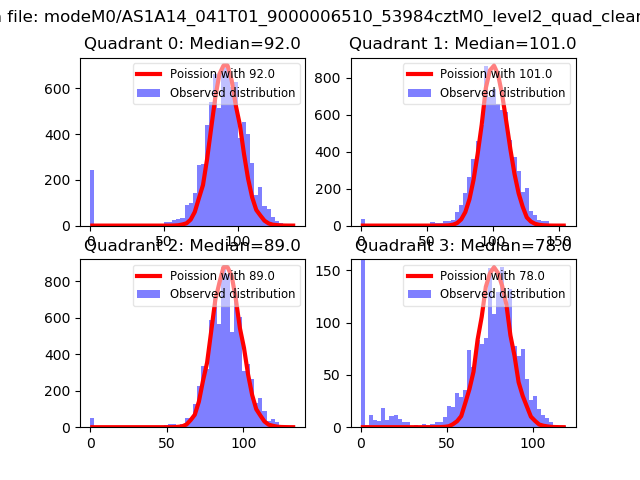 |
 |
| Quadrant-wise count rates Data is divided into 100 sec bins |
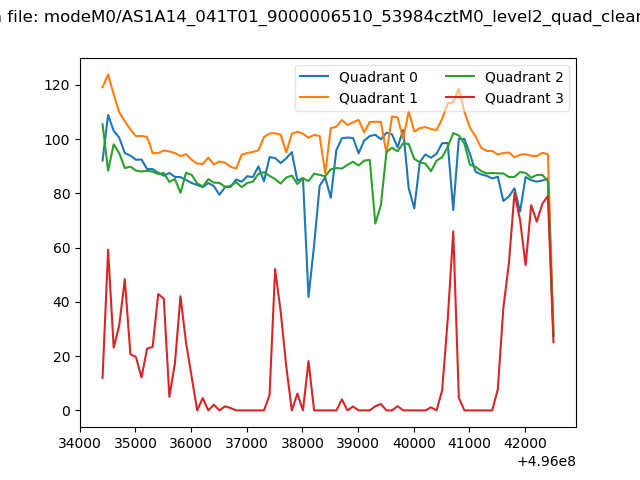 |
|
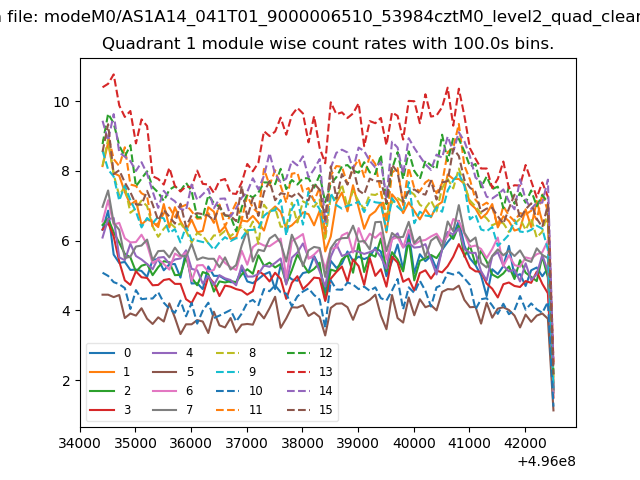
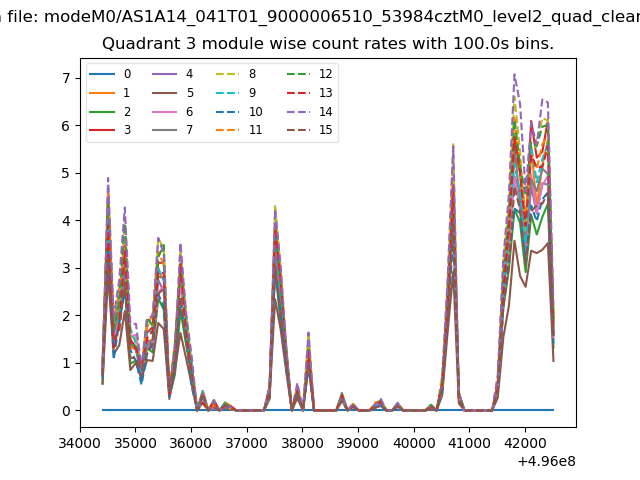
| Module-wise count rates for Quadrant A Data is divided into 100 sec bins |
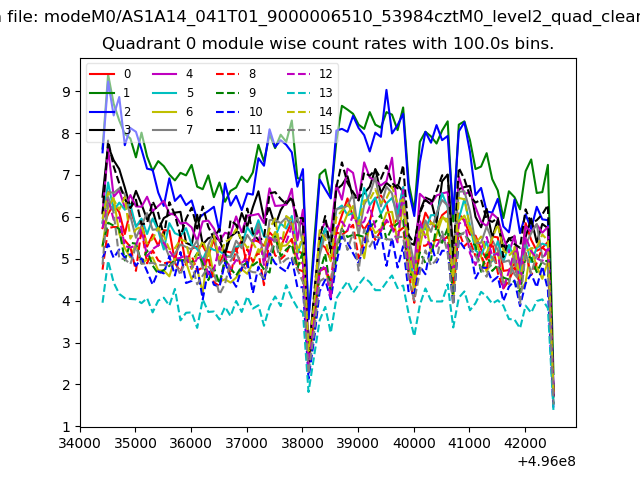 |
 |
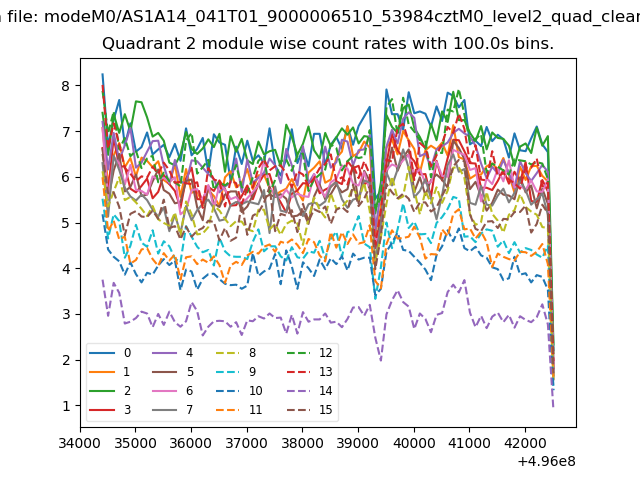
| Module-wise count rates for Quadrant B Data is divided into 100 sec bins |
 |
 |
| Module-wise count rates for Quadrant C Data is divided into 100 sec bins |
 |
 |
| Module-wise count rates for Quadrant D Data is divided into 100 sec bins |
 |
 |
| Parameter | Plot |
|---|---|
| CZT HV Monitor | 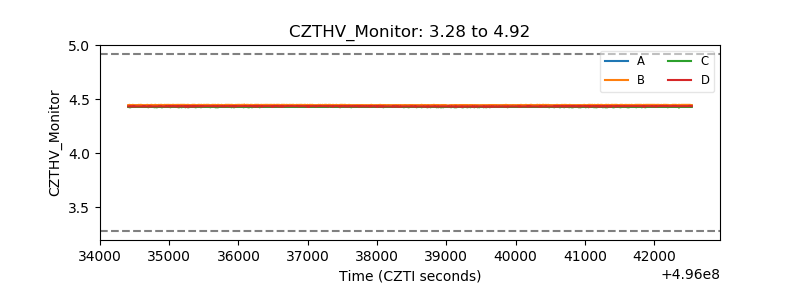 |
| D_VDD | 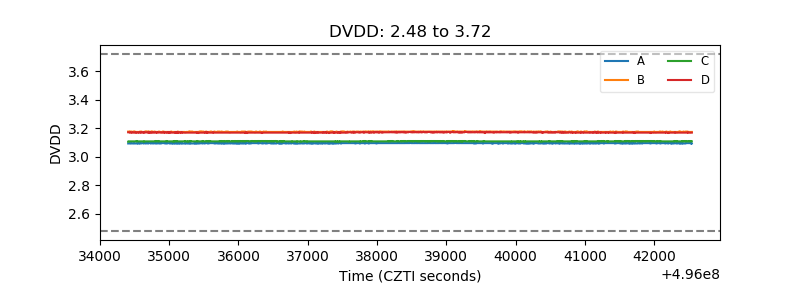 |
| Temperature 1 | 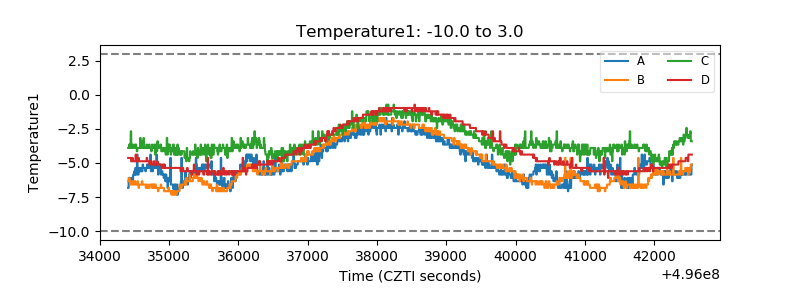 |
| Veto HV Monitor | 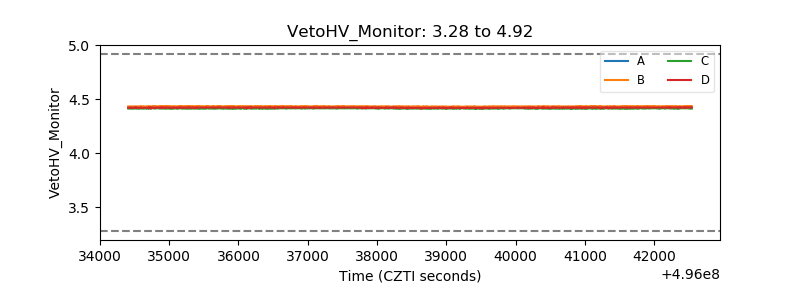 |
| Veto LLD | 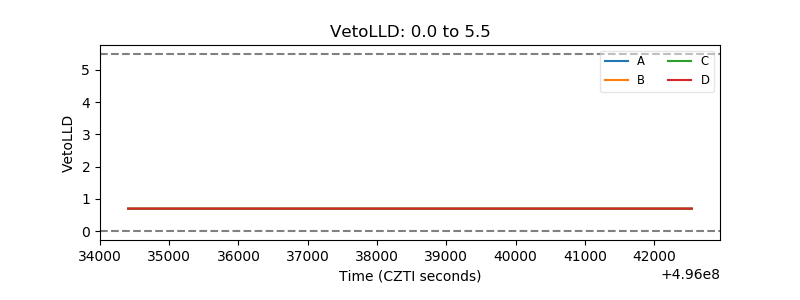 |
| Alpha Counter | 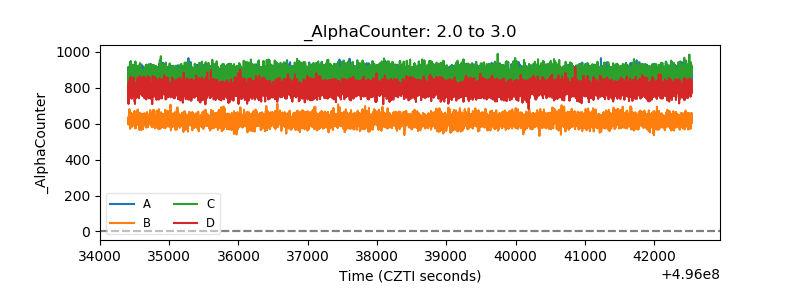 |
| _CPM_Rate | 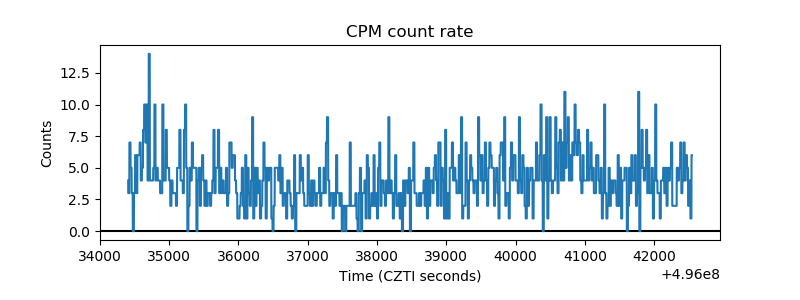 |
| CZT Counter | 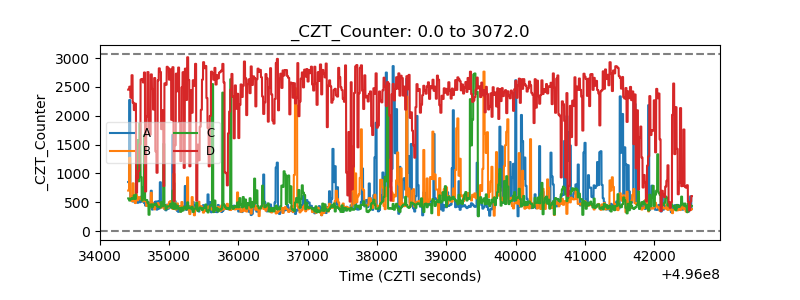 |
| +2.5 Volts monitor |  |
| +5 Volts monitor |  |
| _ROLL_ROT | 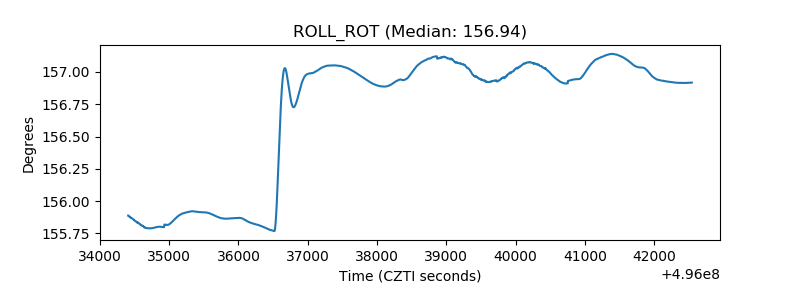 |
| _Roll_DEC | 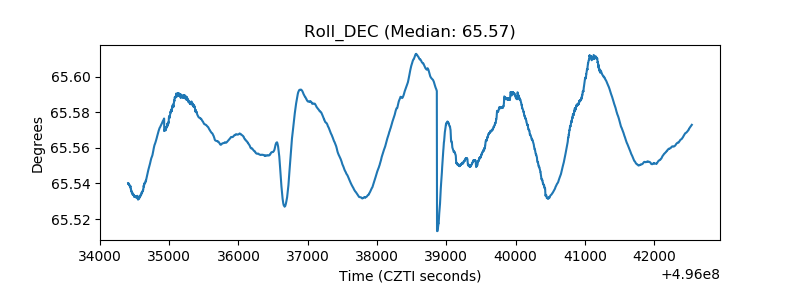 |
| _Roll_RA | 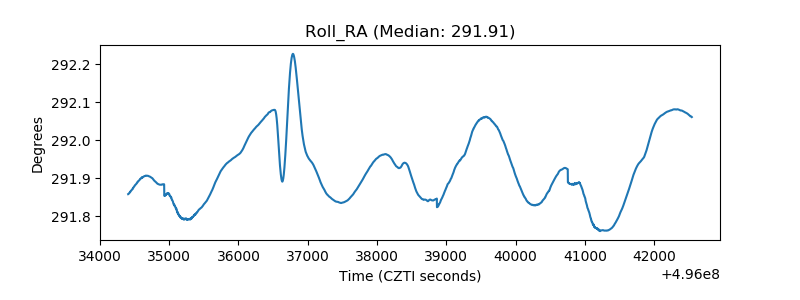 |
| Veto Counter | 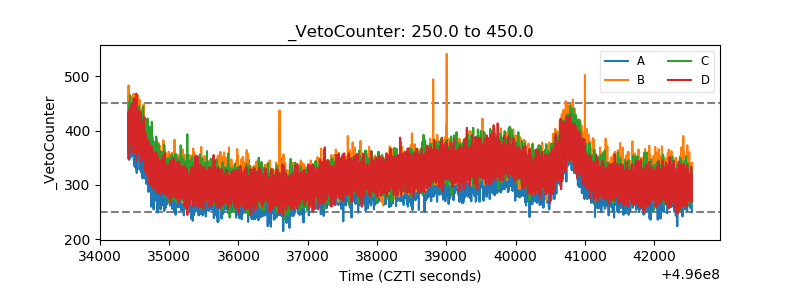 |