| Param | Original file | Final file |
|---|---|---|
| Filename | modeM0/AS1A14_041T01_9000006510_53987cztM0_level2.fits | modeM0/AS1A14_041T01_9000006510_53987cztM0_level2_quad_clean.evt |
| Size (bytes) | 294,926,400 | 40,872,960 |
| Size | 281.3 MB | 39.0 MB |
| Events in quadrant A | 1,784,822 | 283,430 |
| Events in quadrant B | 1,802,891 | 304,972 |
| Events in quadrant C | 1,697,173 | 276,843 |
| Events in quadrant D | 5,379,273 | 142,792 |
| Mode SS | |||
|---|---|---|---|
| Quadrant | BADHDUFLAG | Total packets | Discarded packets |
| A | 0 | 64 | 0 |
| B | 0 | 64 | 0 |
| C | 0 | 64 | 0 |
| D | 0 | 64 | 0 |
| Mode M0 | |||
|---|---|---|---|
| Quadrant | BADHDUFLAG | Total packets | Discarded packets |
| A | 0 | 7737 | 0 |
| B | 0 | 7841 | 0 |
| C | 0 | 7465 | 0 |
| D | 0 | 18240 | 0 |
| Quadrant | Total seconds | Saturated seconds | Saturation percentage |
|---|---|---|---|
| A | 3231 | 93 | 2.878366% |
| B | 3231 | 151 | 4.673476% |
| C | 3232 | 15 | 0.464109% |
| D | 3232 | 1516 | 46.905941% |
Noise dominated data is calculated using 1-second bins in cleaned event files. If a bin has >2000 counts, and if more than 50% of those come from <1% of pixels, then it is considered to be noise-dominated and hence unusable.
| Quadrant | # 1 sec bins | Bins with >0 counts | Bins with >2000 counts | High rate bins dominated by noise | Noise dominated (total time) | Noise dominated (detector-on time) | Marked lightcurve |
|---|---|---|---|---|---|---|---|
| A | 3231 | 3231 | 77 | 77 | 2.38% | 2.38% |  |
| B | 3231 | 3231 | 114 | 114 | 3.53% | 3.53% |  |
| C | 3232 | 3232 | 19 | 19 | 0.59% | 0.59% |  |
| D | 3231 | 3231 | 1443 | 1443 | 44.66% | 44.66% | 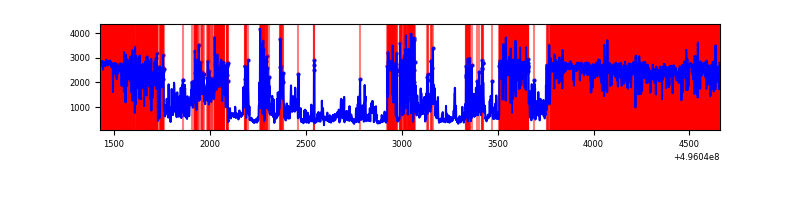 |
Top three noisy pixels from each quadrant. If the there are fewer than three noisy pixels in the level2.evt file, extra rows are filled as -1
| Pixel properties | Quadrant properties | ||||||
|---|---|---|---|---|---|---|---|
| Quadrant | DetID | PixID | Counts | Sigma | Mean | Median | Sigma |
| A | 13 | 248 | 146799 | 1820.09 | 321 | 312 | 80.5 |
| A | 0 | 8 | 126584 | 1568.92 | 321 | 312 | 80.5 |
| A | 15 | 174 | 101630 | 1258.87 | 321 | 312 | 80.5 |
| B | 5 | 185 | 324668 | 4699.58 | 314 | 303 | 69.0 |
| B | 10 | 245 | 90741 | 1310.31 | 314 | 303 | 69.0 |
| B | 2 | 249 | 46944 | 675.76 | 314 | 303 | 69.0 |
| C | 4 | 5 | 313660 | 3680.77 | 307 | 304 | 85.1 |
| C | 12 | 249 | 28442 | 330.52 | 307 | 304 | 85.1 |
| C | 9 | 53 | 19605 | 226.72 | 307 | 304 | 85.1 |
| D | 8 | 176 | 2767472 | 43306.77 | 221 | 212 | 63.9 |
| D | 2 | 165 | 1294728 | 20258.78 | 221 | 212 | 63.9 |
| D | 5 | 113 | 127250 | 1988.11 | 221 | 212 | 63.9 |
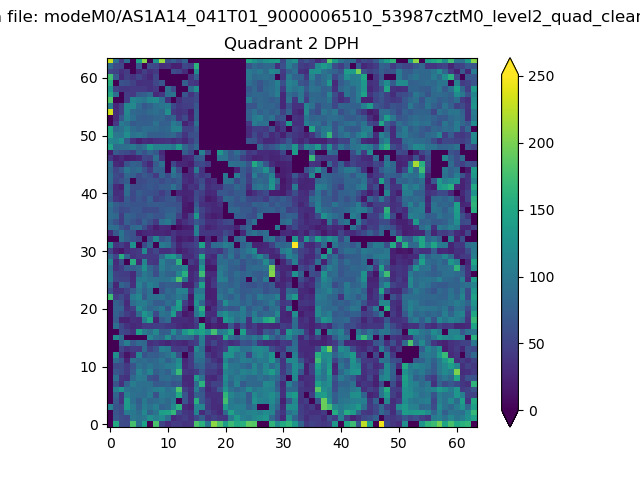
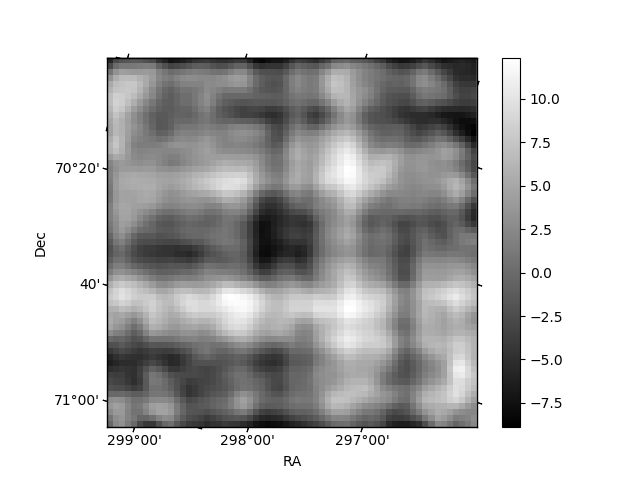
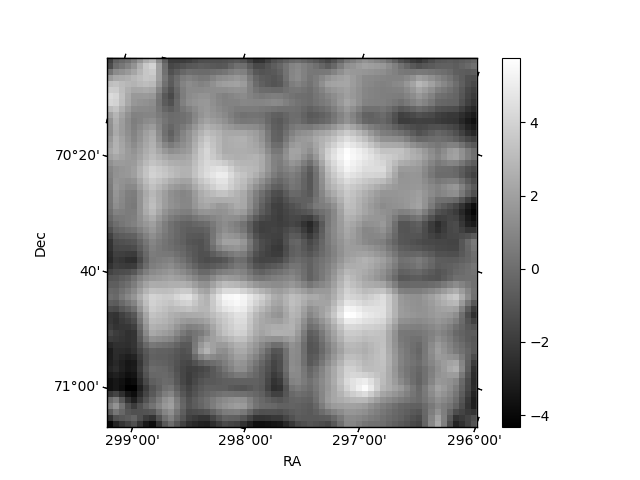
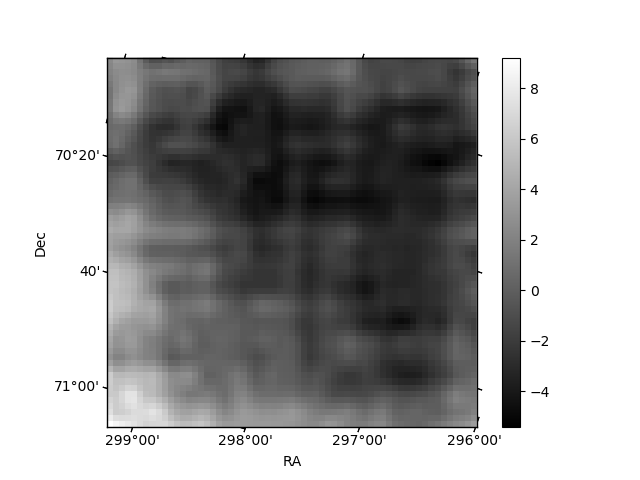
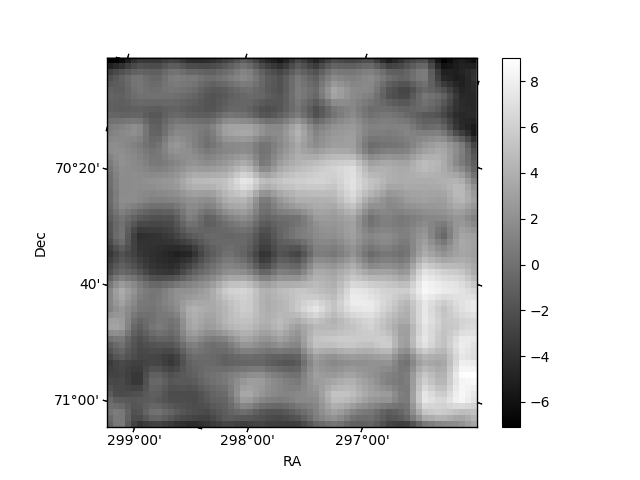
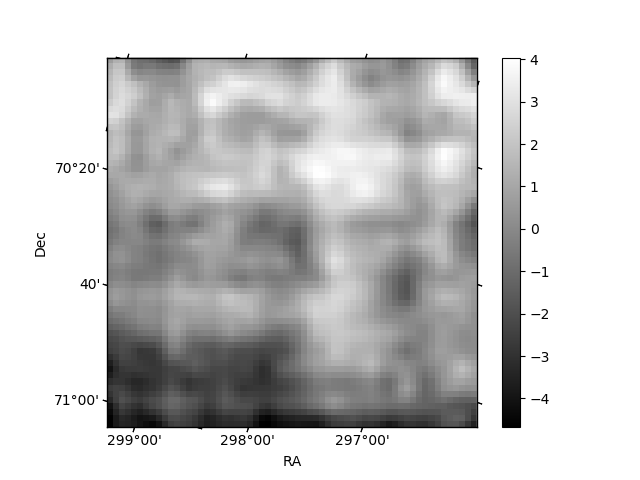
Histogram calculated using DETX and DETY for each event in the final _common_clean file
| Quadrant A | 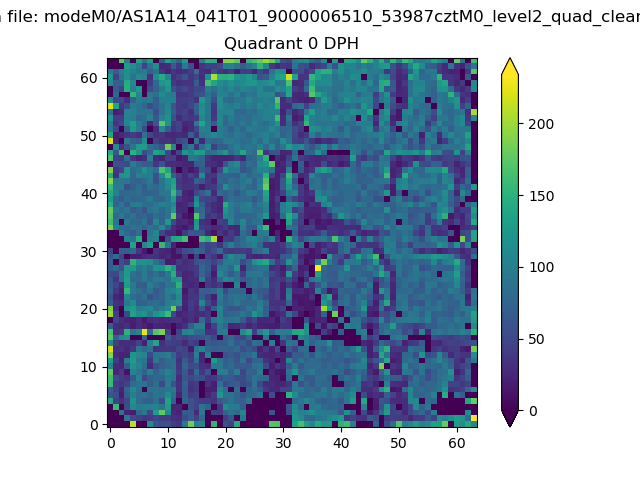 |
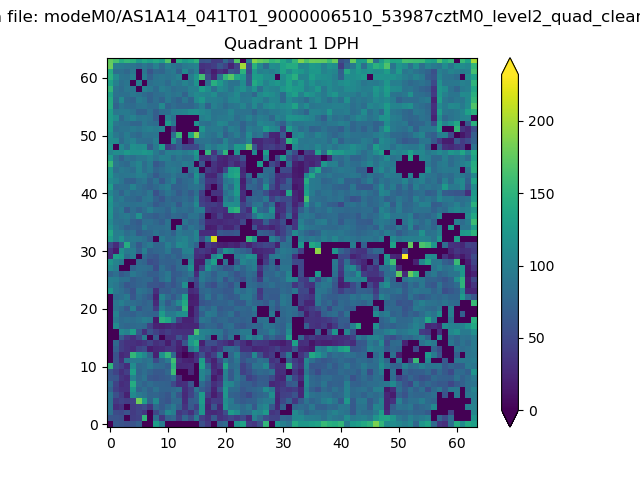 |
Quadrant B |
|---|---|---|---|
| Quadrant D | 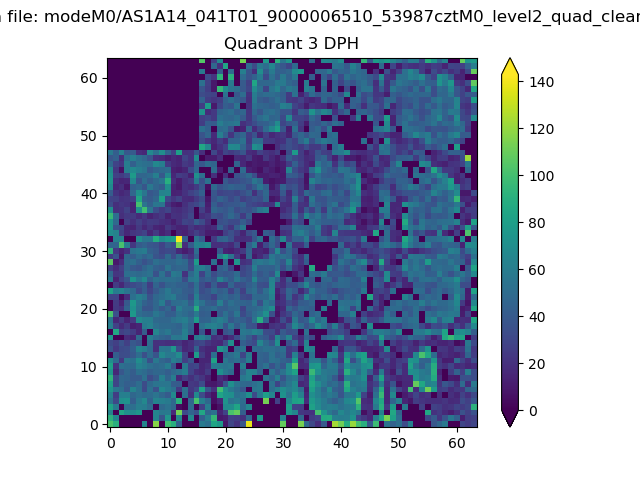 |
 |
Quadrant C |
| Plot type | Count rate plots | Images |
|---|---|---|
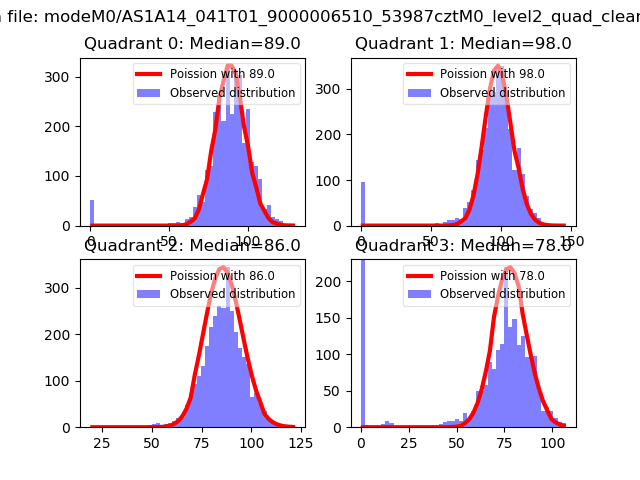
| Comparison with Poisson distribution Blue bars denote a histogram of data divided into 1 sec bins. Red curve is a Poisson curve with rate = median count rate of data. |
 |
 |
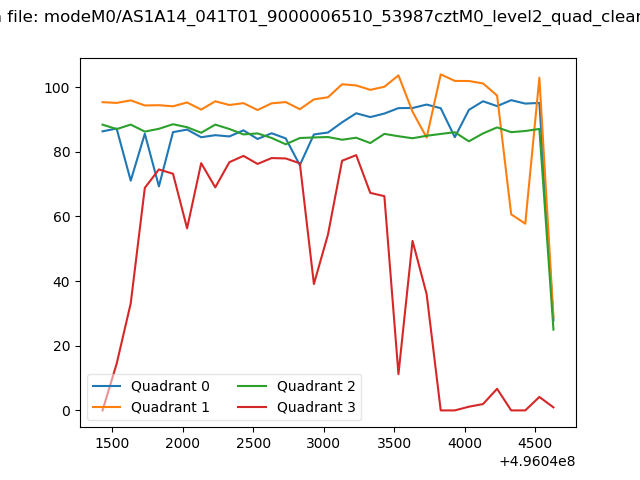
| Quadrant-wise count rates Data is divided into 100 sec bins |
 |
|
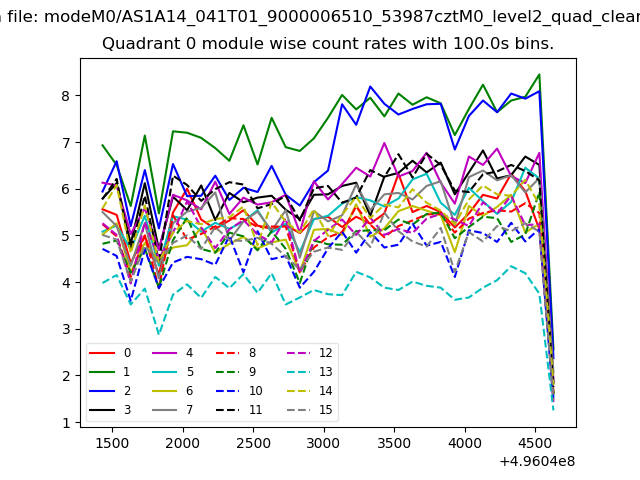
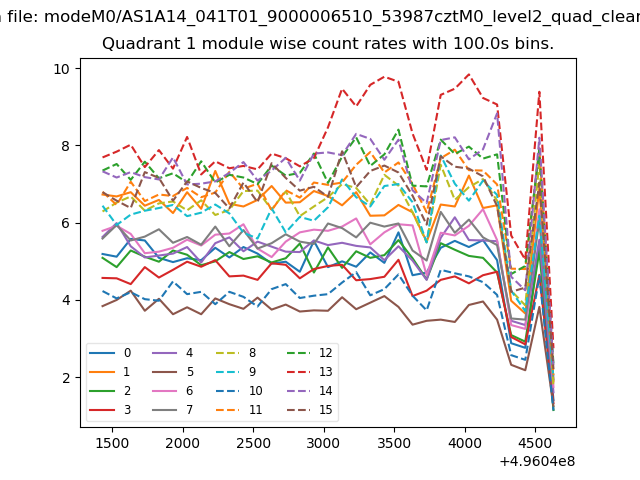
| Module-wise count rates for Quadrant A Data is divided into 100 sec bins |
 |
 |
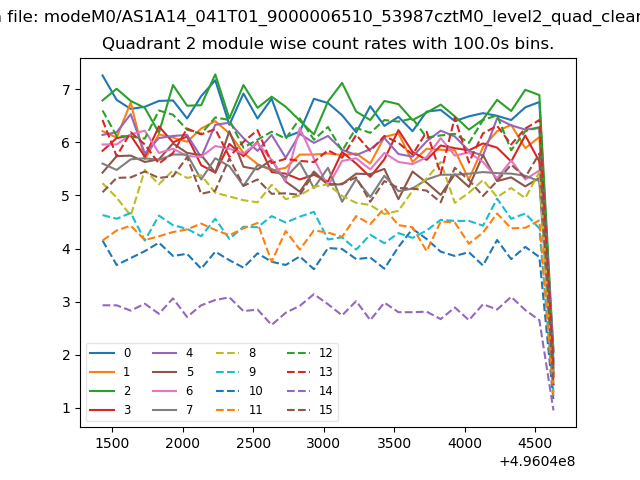
| Module-wise count rates for Quadrant B Data is divided into 100 sec bins |
 |
 |
| Module-wise count rates for Quadrant C Data is divided into 100 sec bins |
 |
 |
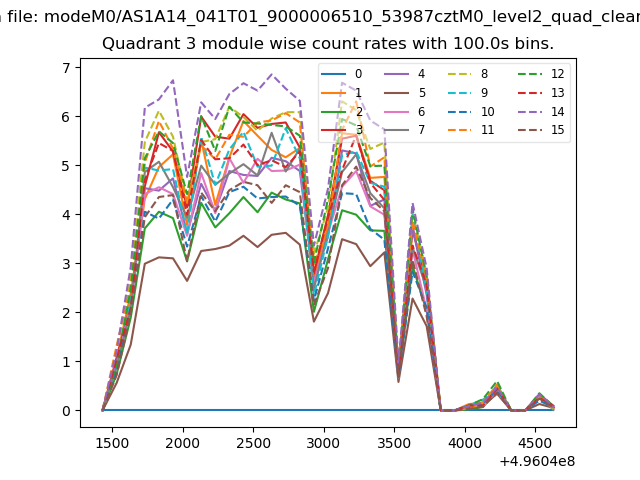
| Module-wise count rates for Quadrant D Data is divided into 100 sec bins |
 |
 |
| Parameter | Plot |
|---|---|
| CZT HV Monitor | 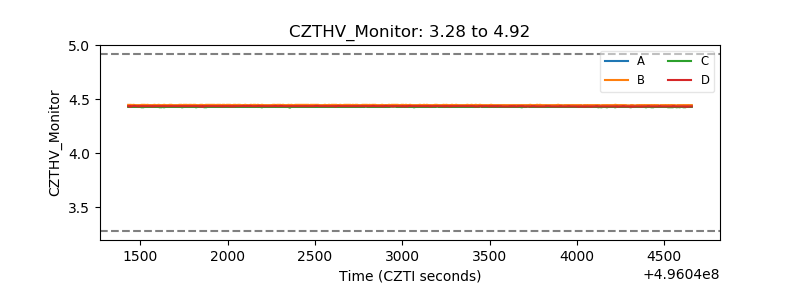 |
| D_VDD | 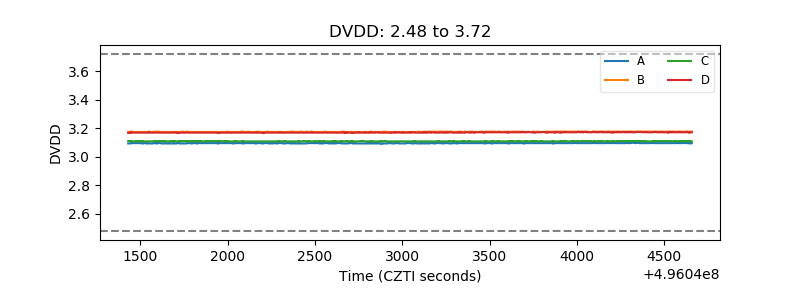 |
| Temperature 1 | 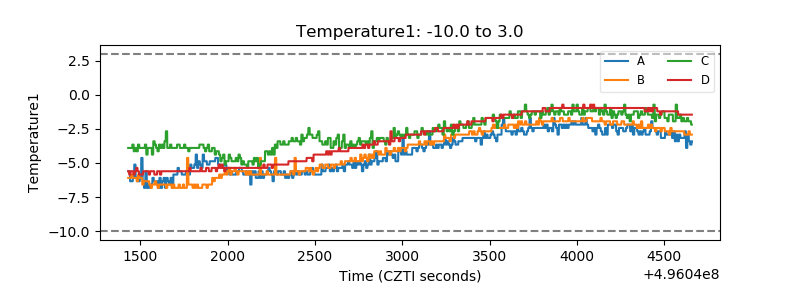 |
| Veto HV Monitor | 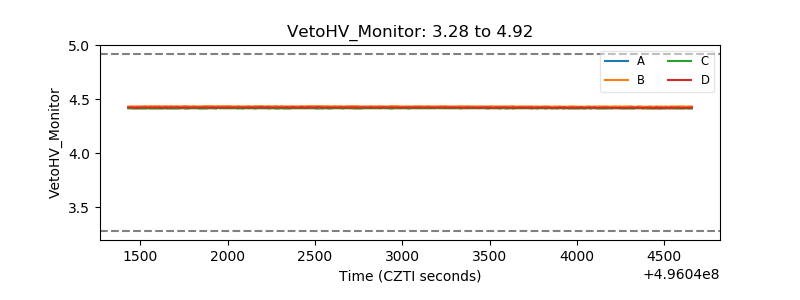 |
| Veto LLD | 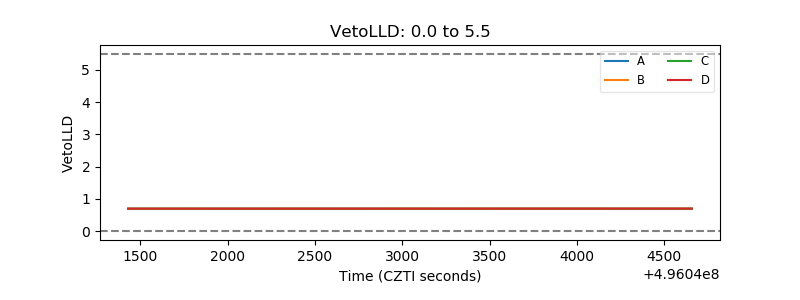 |
| Alpha Counter | 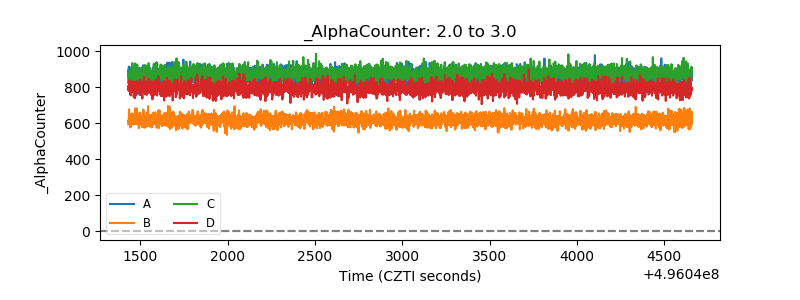 |
| _CPM_Rate | 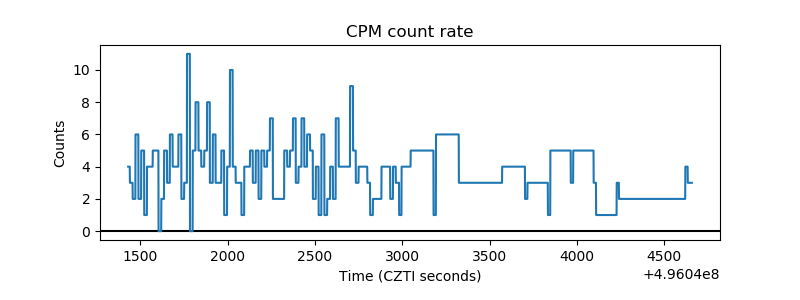 |
| CZT Counter | 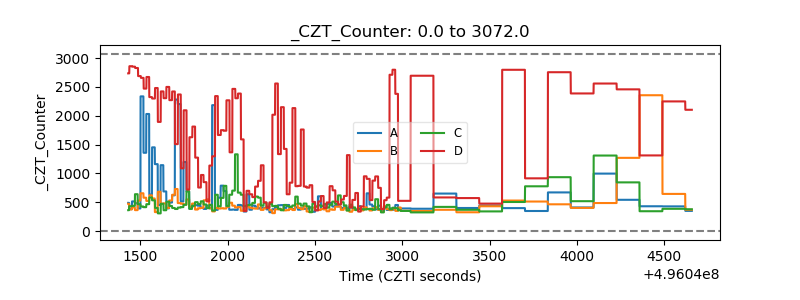 |
| +2.5 Volts monitor |  |
| +5 Volts monitor |  |
| _ROLL_ROT | 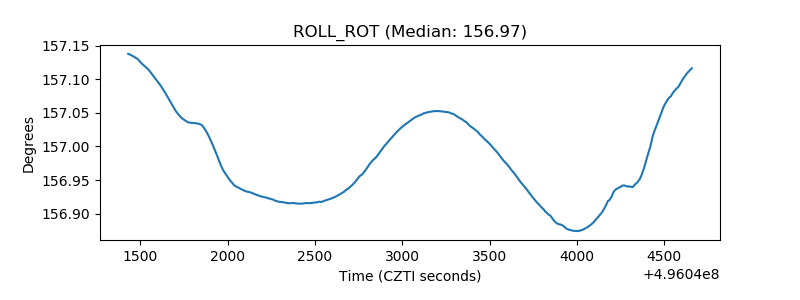 |
| _Roll_DEC | 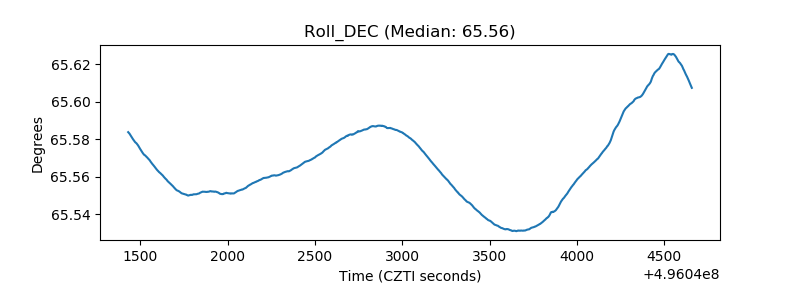 |
| _Roll_RA | 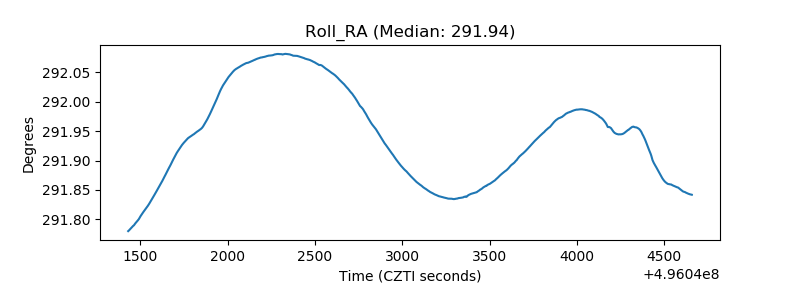 |
| Veto Counter | 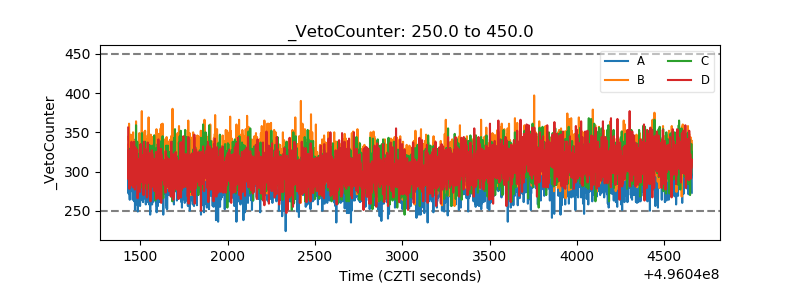 |