| Param | Original file | Final file |
|---|---|---|
| Filename | modeM0/AS1A14_041T01_9000006510_53988cztM0_level2.fits | modeM0/AS1A14_041T01_9000006510_53988cztM0_level2_quad_clean.evt |
| Size (bytes) | 2,087,208,000 | 284,466,240 |
| Size | 1.9 GB | 271.3 MB |
| Events in quadrant A | 12,886,857 | 2,025,904 |
| Events in quadrant B | 13,641,692 | 2,167,250 |
| Events in quadrant C | 11,379,163 | 1,940,044 |
| Events in quadrant D | 37,661,219 | 970,945 |
| Mode M9 | |||
|---|---|---|---|
| Quadrant | BADHDUFLAG | Total packets | Discarded packets |
| A | 0 | 17 | 0 |
| B | 0 | 17 | 0 |
| C | 0 | 17 | 0 |
| D | 0 | 17 | 0 |
| Mode SS | |||
|---|---|---|---|
| Quadrant | BADHDUFLAG | Total packets | Discarded packets |
| A | 0 | 446 | 0 |
| B | 0 | 446 | 0 |
| C | 0 | 446 | 0 |
| D | 0 | 446 | 0 |
| Mode M0 | |||
|---|---|---|---|
| Quadrant | BADHDUFLAG | Total packets | Discarded packets |
| A | 0 | 53889 | 4 |
| B | 0 | 56107 | 4 |
| C | 0 | 49721 | 4 |
| D | 0 | 127150 | 4 |
| Quadrant | Total seconds | Saturated seconds | Saturation percentage |
|---|---|---|---|
| A | 21900 | 867 | 3.958904% |
| B | 21901 | 1334 | 6.091046% |
| C | 21901 | 344 | 1.570705% |
| D | 21901 | 10653 | 48.641615% |
Noise dominated data is calculated using 1-second bins in cleaned event files. If a bin has >2000 counts, and if more than 50% of those come from <1% of pixels, then it is considered to be noise-dominated and hence unusable.
| Quadrant | # 1 sec bins | Bins with >0 counts | Bins with >2000 counts | High rate bins dominated by noise | Noise dominated (total time) | Noise dominated (detector-on time) | Marked lightcurve |
|---|---|---|---|---|---|---|---|
| A | 23571 | 21903 | 546 | 546 | 2.32% | 2.49% | 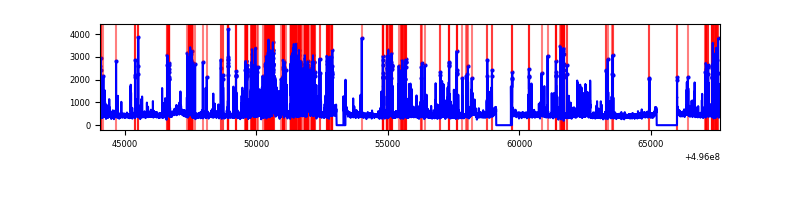 |
| B | 23572 | 21904 | 862 | 862 | 3.66% | 3.94% | 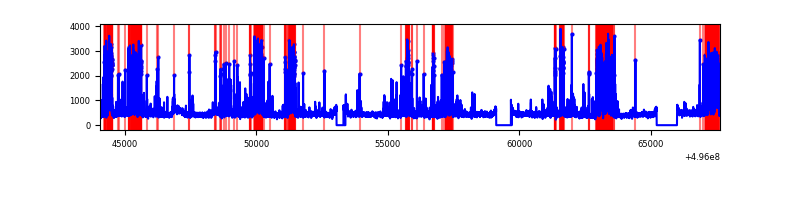 |
| C | 23572 | 21905 | 198 | 198 | 0.84% | 0.90% | 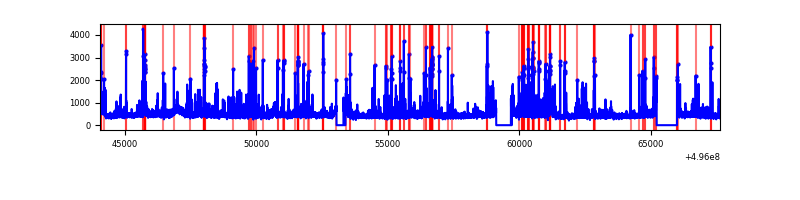 |
| D | 23572 | 21902 | 9190 | 9190 | 38.99% | 41.96% | 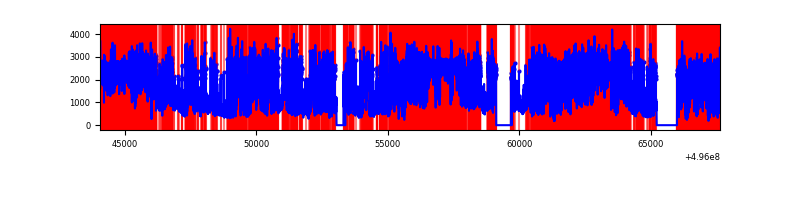 |
Top three noisy pixels from each quadrant. If the there are fewer than three noisy pixels in the level2.evt file, extra rows are filled as -1
| Pixel properties | Quadrant properties | ||||||
|---|---|---|---|---|---|---|---|
| Quadrant | DetID | PixID | Counts | Sigma | Mean | Median | Sigma |
| A | 15 | 174 | 2060851 | 3583.17 | 2318 | 2259 | 574.5 |
| A | 0 | 8 | 664495 | 1152.68 | 2318 | 2259 | 574.5 |
| A | 3 | 45 | 400667 | 693.47 | 2318 | 2259 | 574.5 |
| B | 5 | 185 | 2857192 | 5834.61 | 2287 | 2201 | 489.3 |
| B | 5 | 250 | 496651 | 1010.48 | 2287 | 2201 | 489.3 |
| B | 2 | 249 | 378190 | 768.39 | 2287 | 2201 | 489.3 |
| C | 14 | 254 | 351436 | 567.97 | 2262 | 2240 | 614.8 |
| C | 14 | 80 | 295767 | 477.42 | 2262 | 2240 | 614.8 |
| C | 9 | 38 | 264605 | 426.74 | 2262 | 2240 | 614.8 |
| D | 8 | 176 | 22890827 | 49393.96 | 1615 | 1541 | 463.4 |
| D | 2 | 165 | 3451616 | 7445.09 | 1615 | 1541 | 463.4 |
| D | 2 | 172 | 2180070 | 4701.16 | 1615 | 1541 | 463.4 |
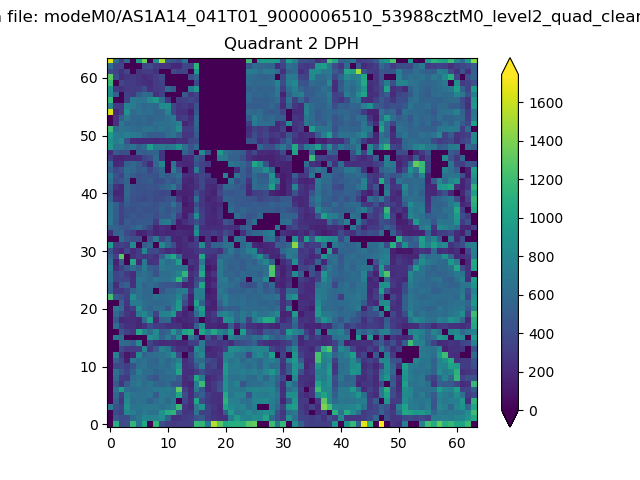
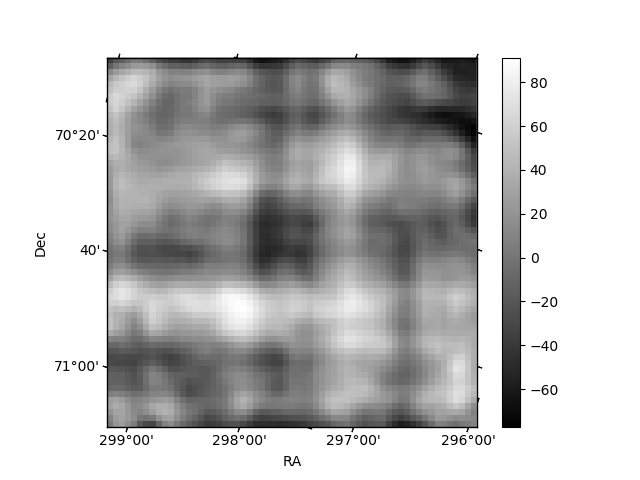
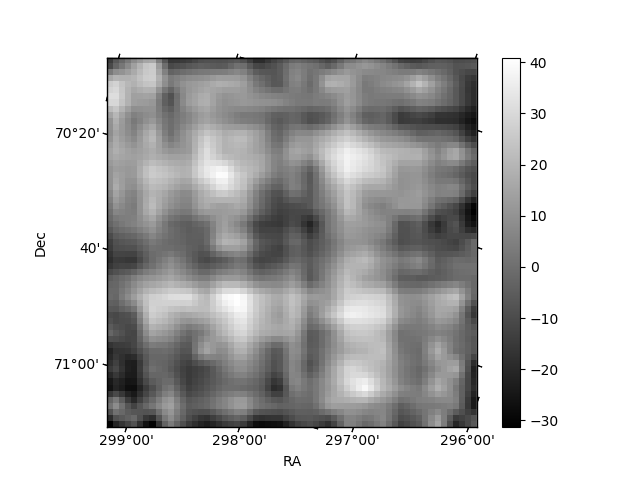
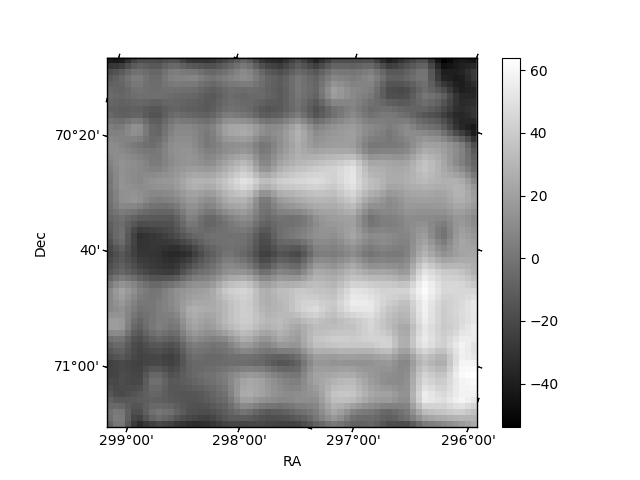
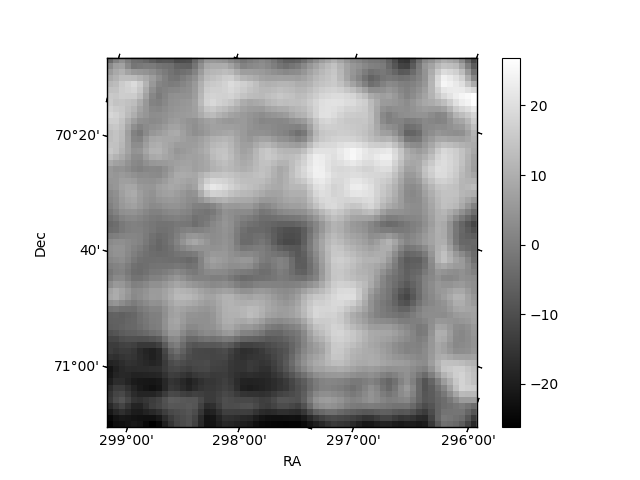
Histogram calculated using DETX and DETY for each event in the final _common_clean file
| Quadrant A | 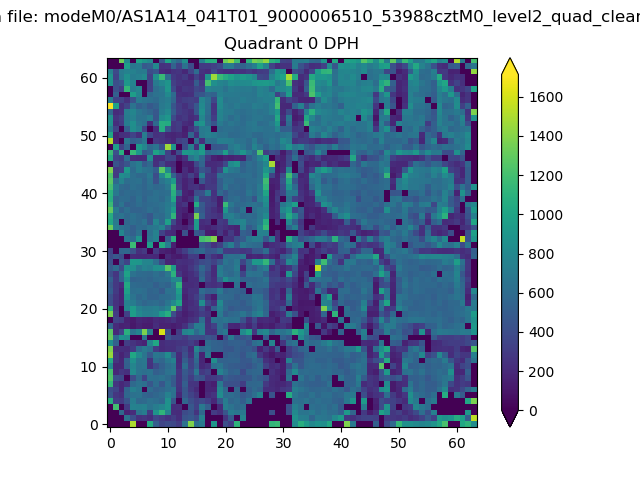 |
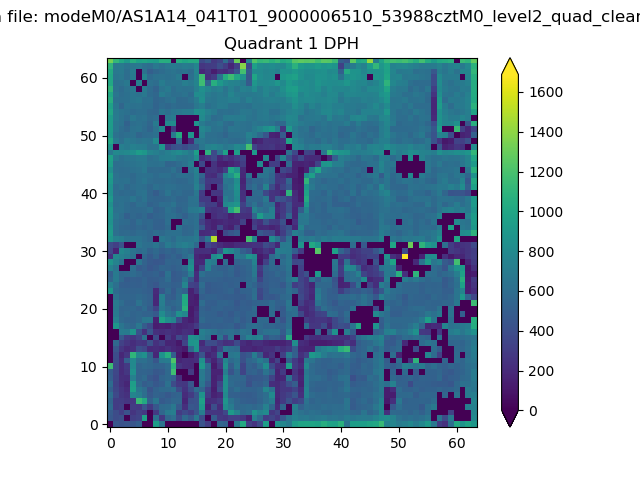 |
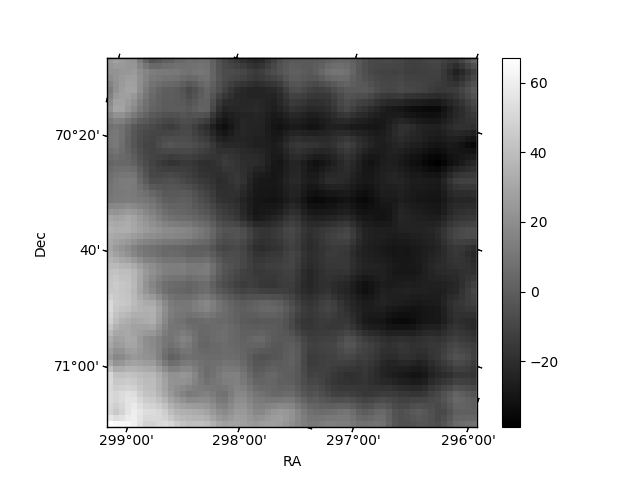
Quadrant B |
|---|---|---|---|
| Quadrant D | 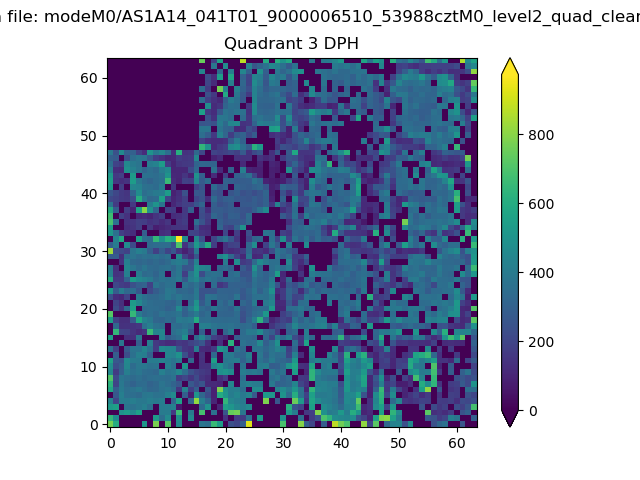 |
 |
Quadrant C |
| Plot type | Count rate plots | Images |
|---|---|---|
| Comparison with Poisson distribution Blue bars denote a histogram of data divided into 1 sec bins. Red curve is a Poisson curve with rate = median count rate of data. |
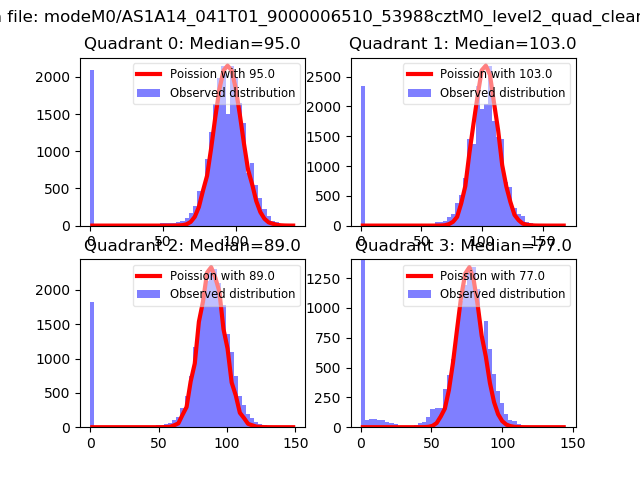 |
 |
| Quadrant-wise count rates Data is divided into 100 sec bins |
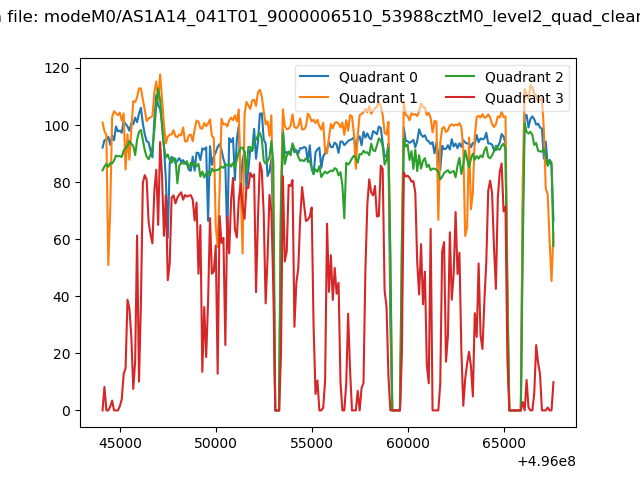 |
|
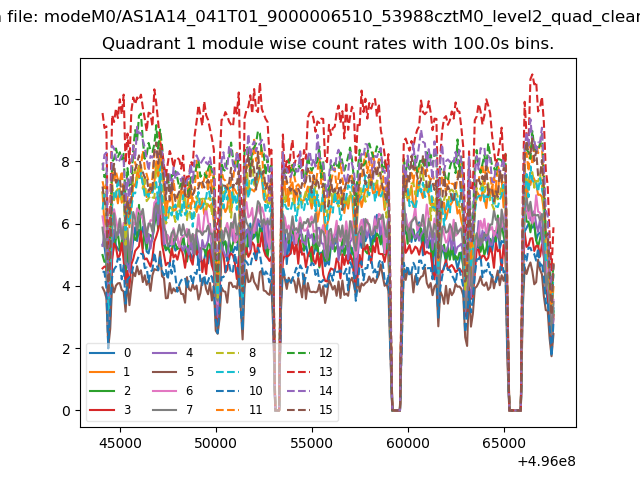
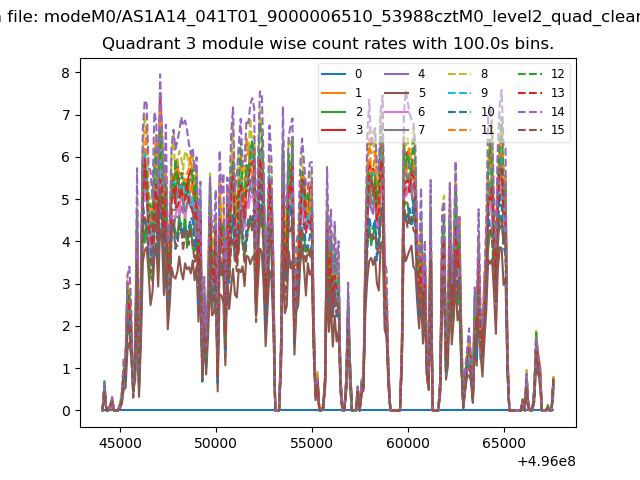
| Module-wise count rates for Quadrant A Data is divided into 100 sec bins |
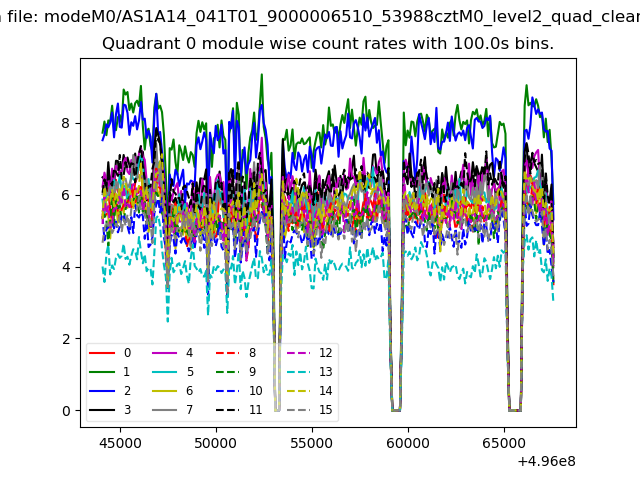 |
 |
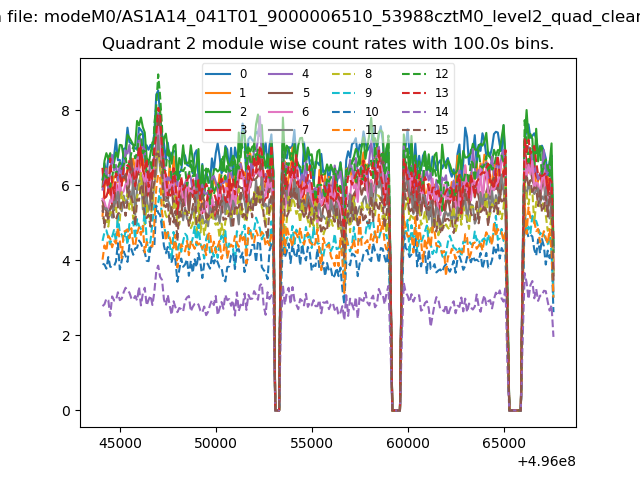
| Module-wise count rates for Quadrant B Data is divided into 100 sec bins |
 |
 |
| Module-wise count rates for Quadrant C Data is divided into 100 sec bins |
 |
 |
| Module-wise count rates for Quadrant D Data is divided into 100 sec bins |
 |
 |
| Parameter | Plot |
|---|---|
| CZT HV Monitor | 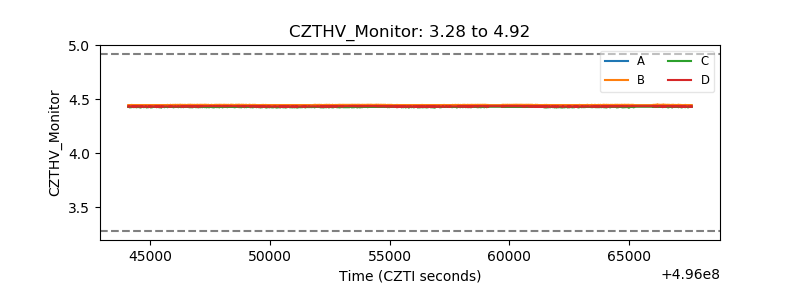 |
| D_VDD | 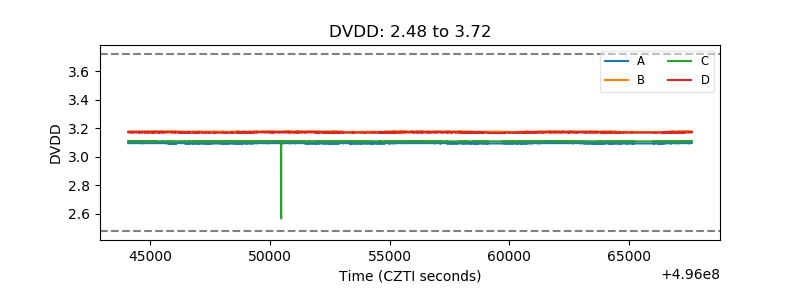 |
| Temperature 1 | 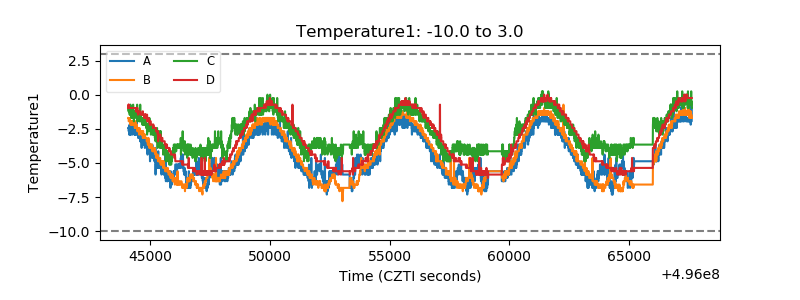 |
| Veto HV Monitor | 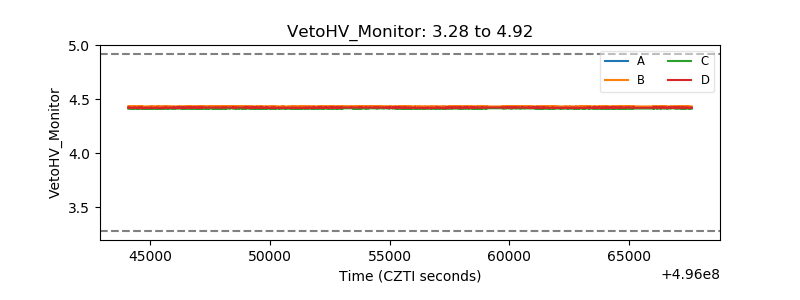 |
| Veto LLD | 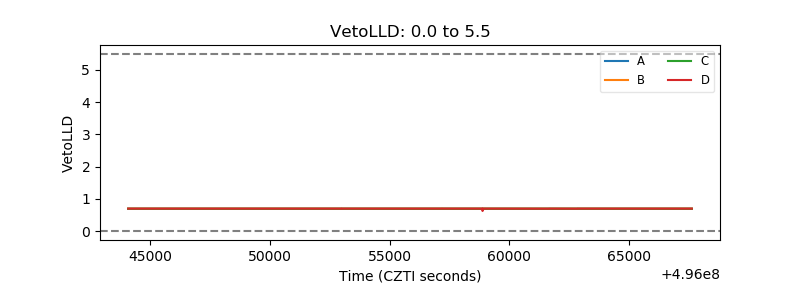 |
| Alpha Counter | 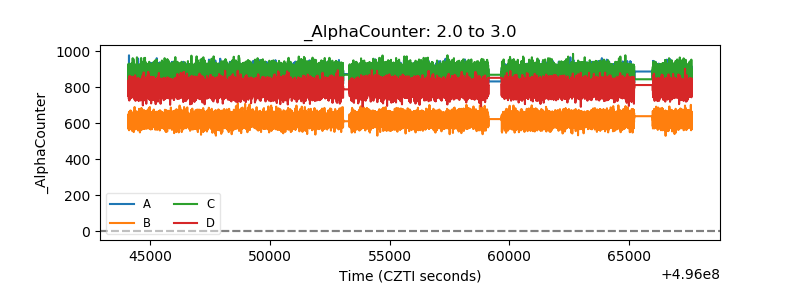 |
| _CPM_Rate | 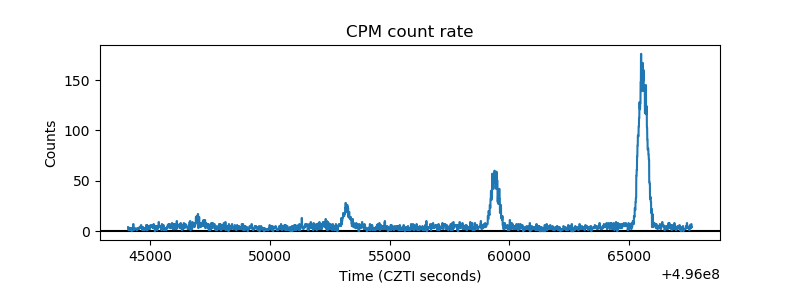 |
| CZT Counter | 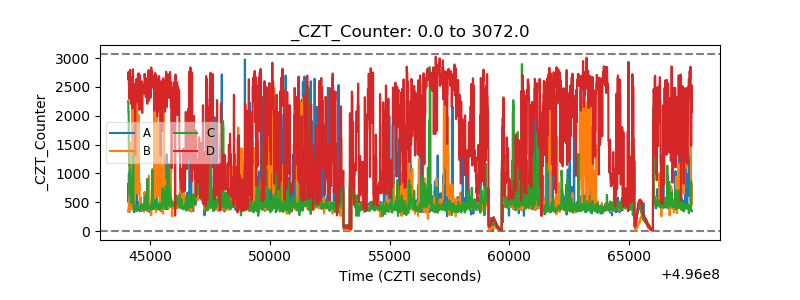 |
| +2.5 Volts monitor |  |
| +5 Volts monitor |  |
| _ROLL_ROT | 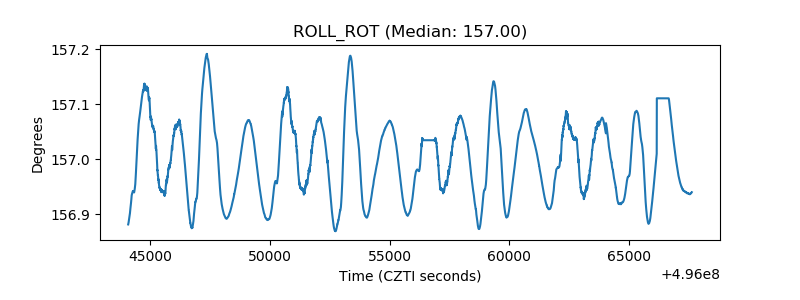 |
| _Roll_DEC | 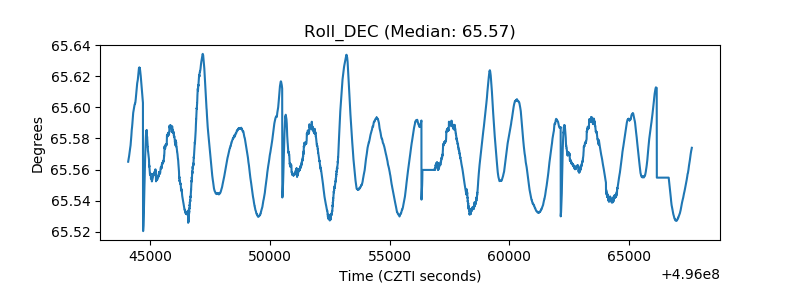 |
| _Roll_RA | 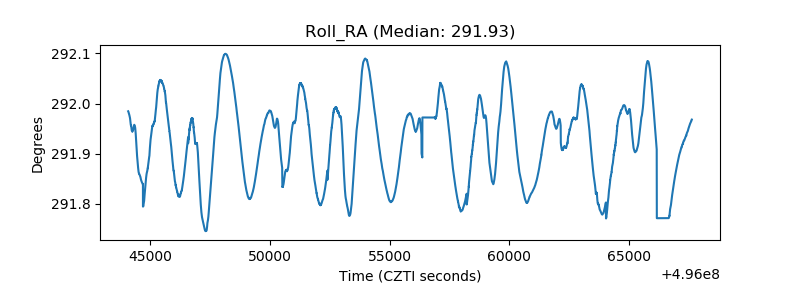 |
| Veto Counter | 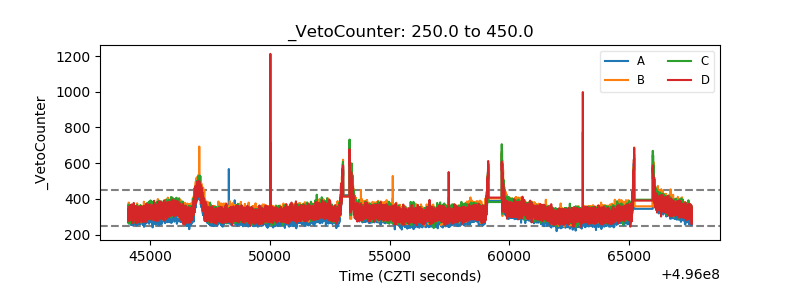 |