| Param | Original file | Final file |
|---|---|---|
| Filename | modeM0/AS1A14_041T01_9000006510_53989cztM0_level2.fits | modeM0/AS1A14_041T01_9000006510_53989cztM0_level2_quad_clean.evt |
| Size (bytes) | 628,764,480 | 78,635,520 |
| Size | 599.6 MB | 75.0 MB |
| Events in quadrant A | 3,269,381 | 588,137 |
| Events in quadrant B | 3,805,105 | 623,562 |
| Events in quadrant C | 3,222,006 | 551,768 |
| Events in quadrant D | 12,498,483 | 186,513 |
| Mode M9 | |||
|---|---|---|---|
| Quadrant | BADHDUFLAG | Total packets | Discarded packets |
| A | 0 | 9 | 0 |
| B | 0 | 9 | 0 |
| C | 0 | 9 | 0 |
| D | 0 | 9 | 0 |
| Mode SS | |||
|---|---|---|---|
| Quadrant | BADHDUFLAG | Total packets | Discarded packets |
| A | 0 | 126 | 0 |
| B | 0 | 126 | 0 |
| C | 0 | 126 | 0 |
| D | 0 | 126 | 0 |
| Mode M0 | |||
|---|---|---|---|
| Quadrant | BADHDUFLAG | Total packets | Discarded packets |
| A | 0 | 14232 | 1 |
| B | 0 | 15741 | 1 |
| C | 0 | 14114 | 1 |
| D | 0 | 41402 | 1 |
| Quadrant | Total seconds | Saturated seconds | Saturation percentage |
|---|---|---|---|
| A | 6166 | 194 | 3.146286% |
| B | 6167 | 328 | 5.318631% |
| C | 6166 | 110 | 1.783977% |
| D | 6166 | 4236 | 68.699319% |
Noise dominated data is calculated using 1-second bins in cleaned event files. If a bin has >2000 counts, and if more than 50% of those come from <1% of pixels, then it is considered to be noise-dominated and hence unusable.
| Quadrant | # 1 sec bins | Bins with >0 counts | Bins with >2000 counts | High rate bins dominated by noise | Noise dominated (total time) | Noise dominated (detector-on time) | Marked lightcurve |
|---|---|---|---|---|---|---|---|
| A | 7091 | 6166 | 114 | 114 | 1.61% | 1.85% | 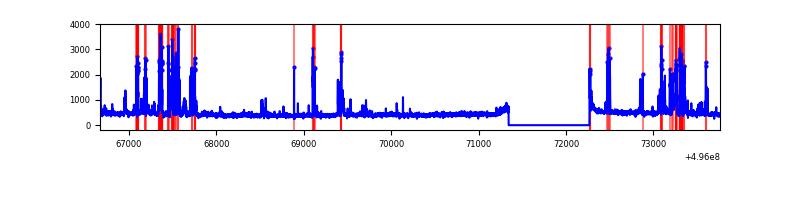 |
| B | 7092 | 6168 | 225 | 225 | 3.17% | 3.65% | 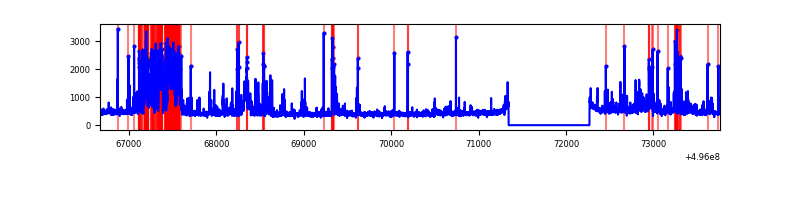 |
| C | 7091 | 6167 | 69 | 69 | 0.97% | 1.12% | 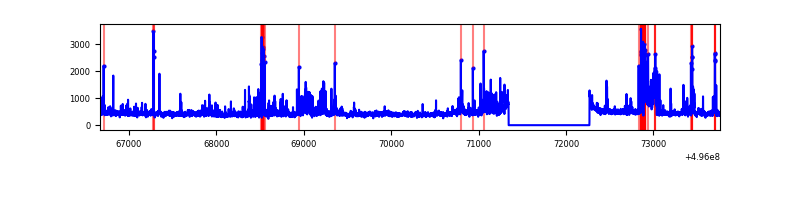 |
| D | 7090 | 6165 | 3663 | 3663 | 51.66% | 59.42% | 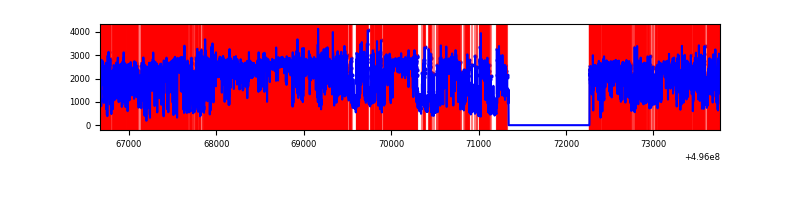 |
Top three noisy pixels from each quadrant. If the there are fewer than three noisy pixels in the level2.evt file, extra rows are filled as -1
| Pixel properties | Quadrant properties | ||||||
|---|---|---|---|---|---|---|---|
| Quadrant | DetID | PixID | Counts | Sigma | Mean | Median | Sigma |
| A | 15 | 174 | 542124 | 3326.89 | 652 | 635 | 162.8 |
| A | 13 | 248 | 52107 | 316.24 | 652 | 635 | 162.8 |
| A | 14 | 239 | 32006 | 192.74 | 652 | 635 | 162.8 |
| B | 5 | 185 | 675090 | 4919.65 | 640 | 621 | 137.1 |
| B | 0 | 213 | 227763 | 1656.8 | 640 | 621 | 137.1 |
| B | 2 | 249 | 151896 | 1103.42 | 640 | 621 | 137.1 |
| C | 13 | 3 | 292974 | 1676.66 | 636 | 630 | 174.4 |
| C | 12 | 249 | 90852 | 517.44 | 636 | 630 | 174.4 |
| C | 1 | 241 | 90537 | 515.64 | 636 | 630 | 174.4 |
| D | 8 | 176 | 8667886 | 85450.94 | 354 | 338 | 101.4 |
| D | 2 | 165 | 1036418 | 10214.42 | 354 | 338 | 101.4 |
| D | 10 | 172 | 532438 | 5245.83 | 354 | 338 | 101.4 |
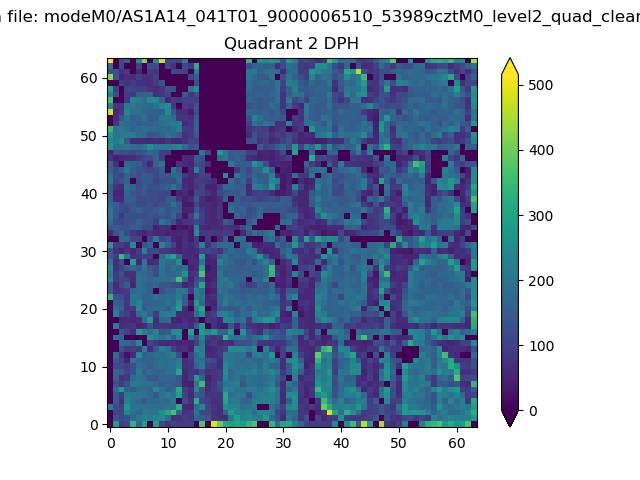
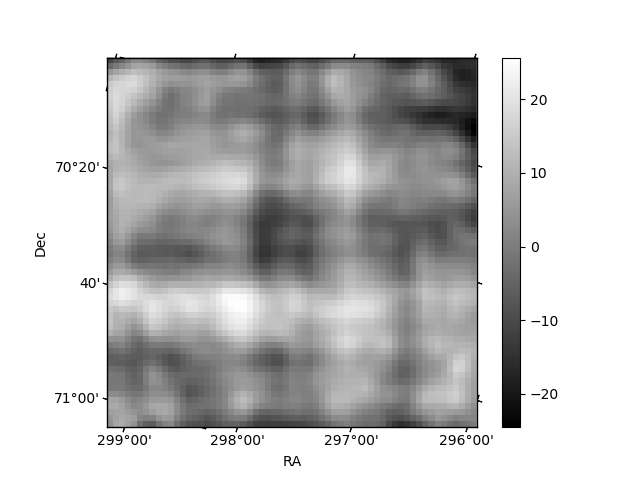
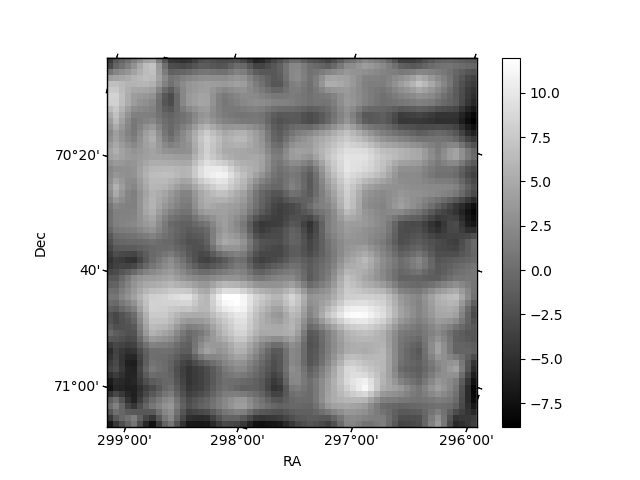
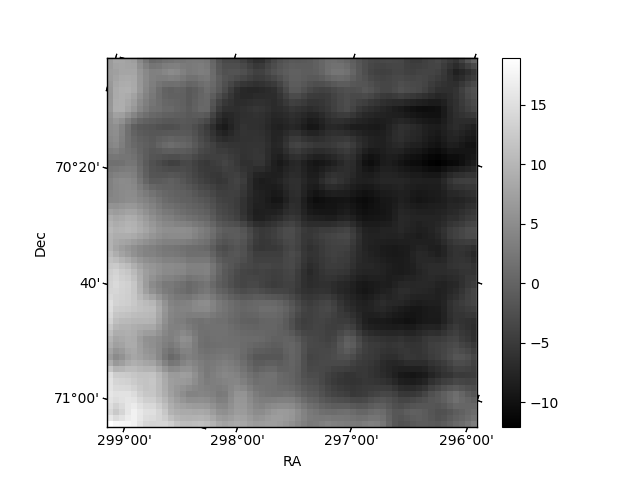
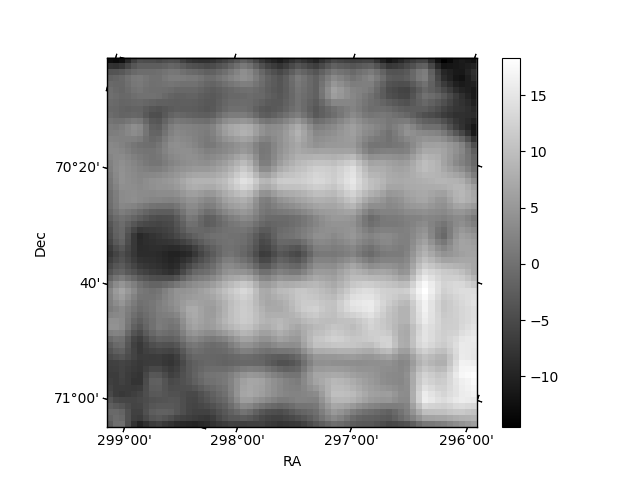
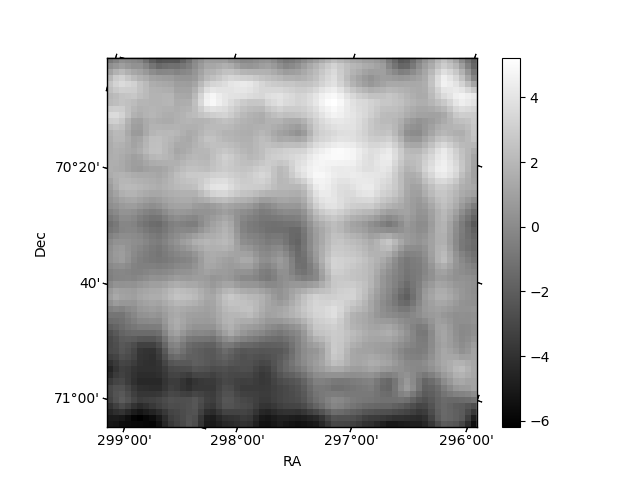
Histogram calculated using DETX and DETY for each event in the final _common_clean file
| Quadrant A | 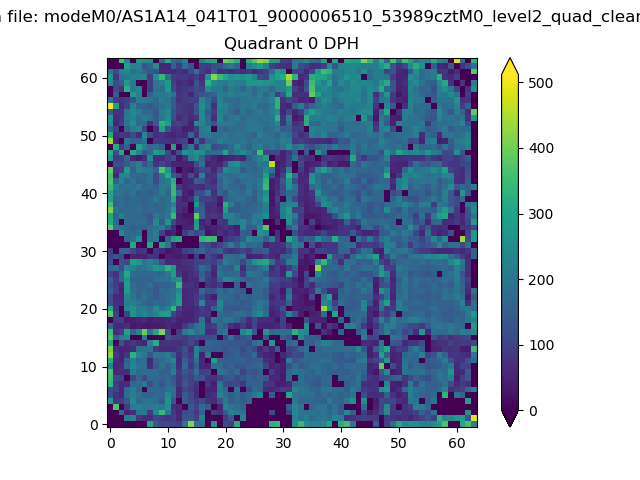 |
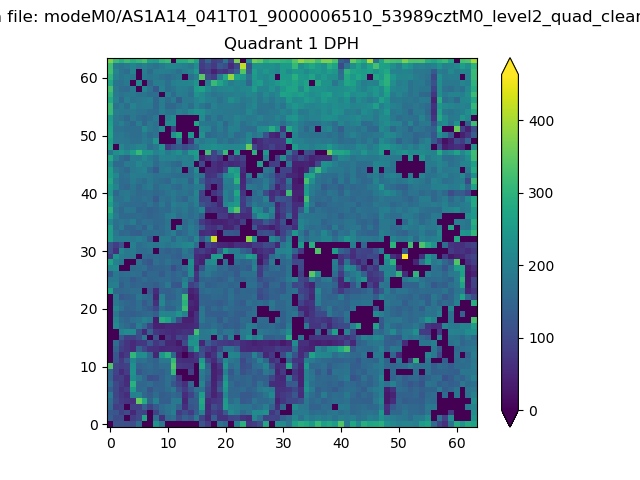 |
Quadrant B |
|---|---|---|---|
| Quadrant D | 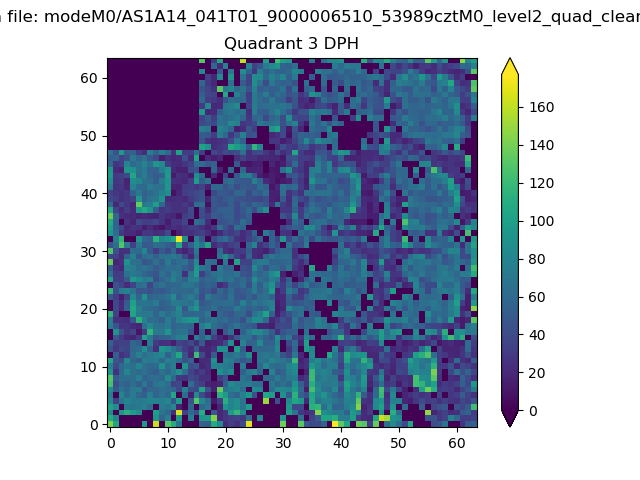 |
 |
Quadrant C |
| Plot type | Count rate plots | Images |
|---|---|---|
| Comparison with Poisson distribution Blue bars denote a histogram of data divided into 1 sec bins. Red curve is a Poisson curve with rate = median count rate of data. |
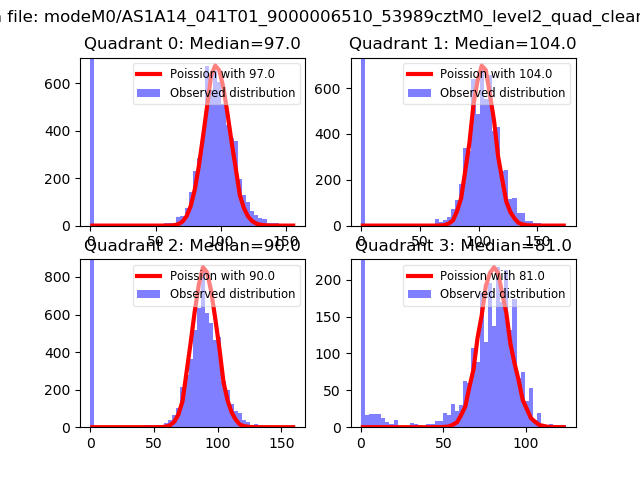 |
 |
| Quadrant-wise count rates Data is divided into 100 sec bins |
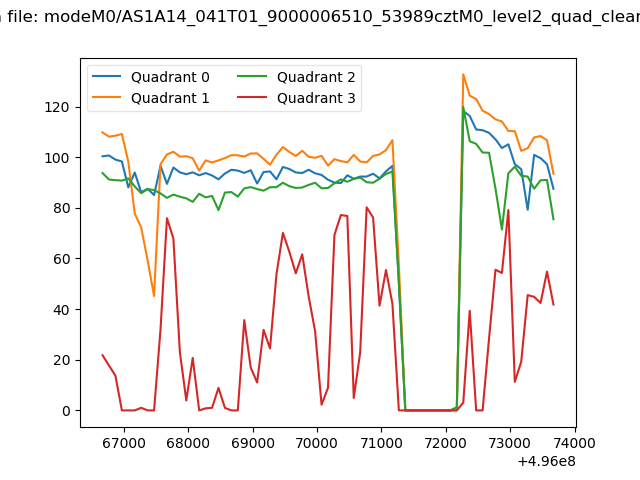 |
|
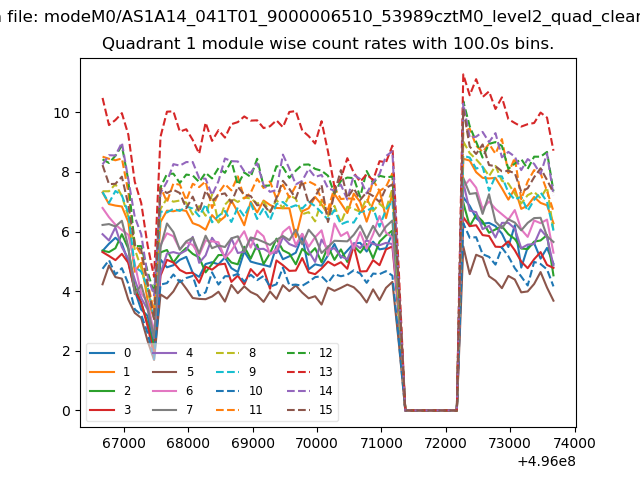
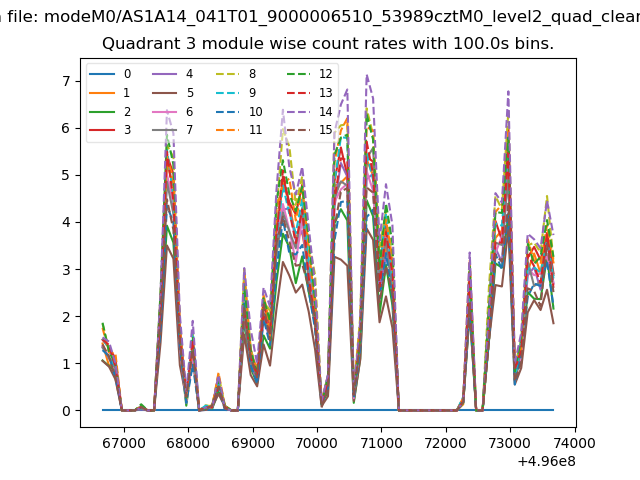
| Module-wise count rates for Quadrant A Data is divided into 100 sec bins |
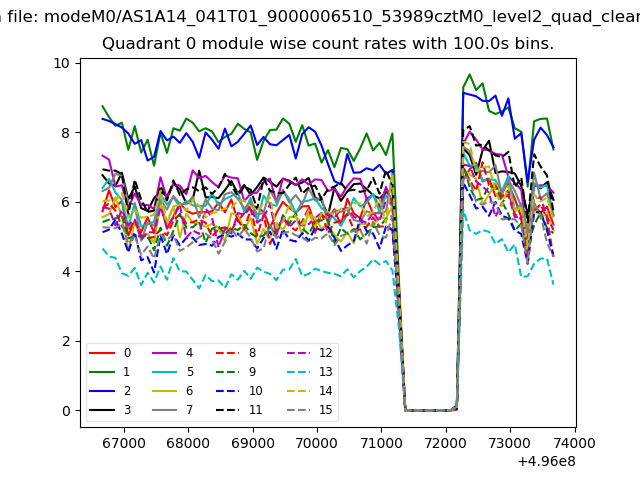 |
 |
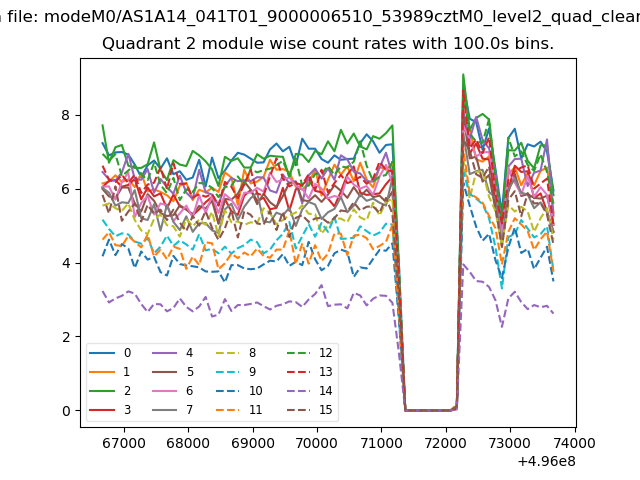
| Module-wise count rates for Quadrant B Data is divided into 100 sec bins |
 |
 |
| Module-wise count rates for Quadrant C Data is divided into 100 sec bins |
 |
 |
| Module-wise count rates for Quadrant D Data is divided into 100 sec bins |
 |
 |
| Parameter | Plot |
|---|---|
| CZT HV Monitor | 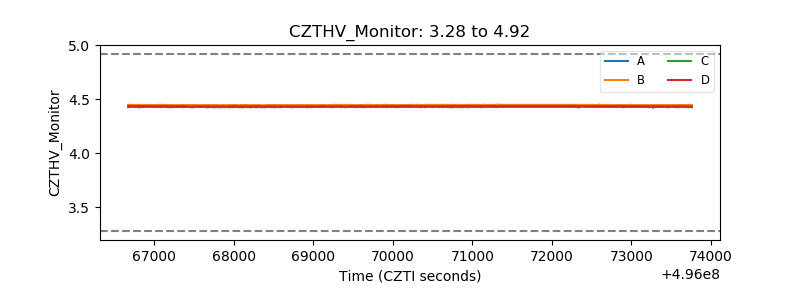 |
| D_VDD | 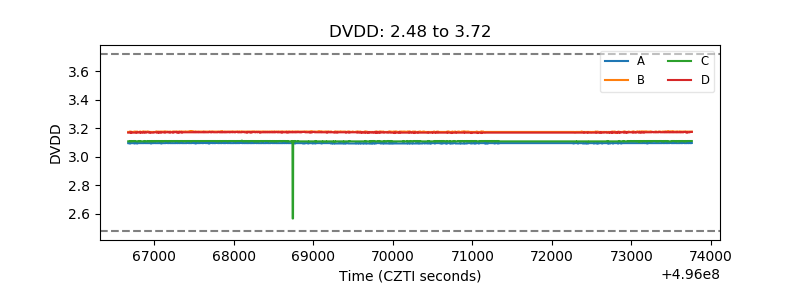 |
| Temperature 1 | 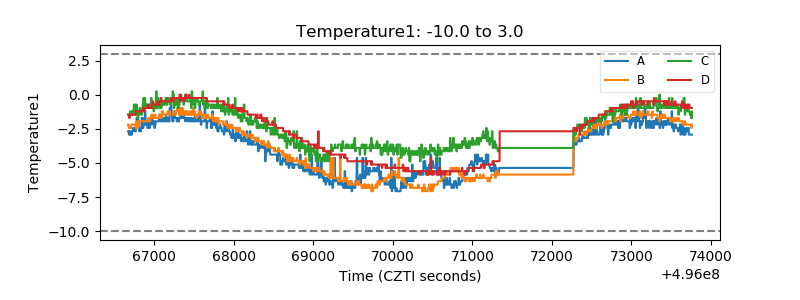 |
| Veto HV Monitor | 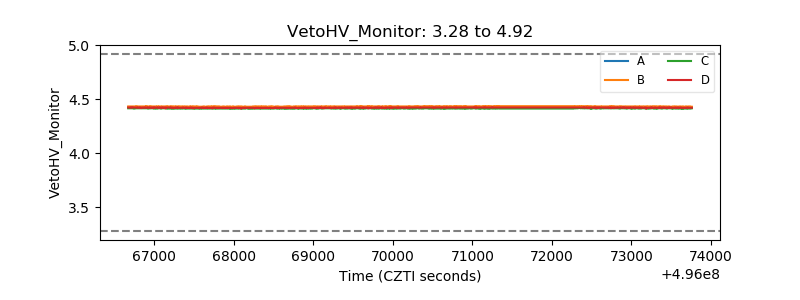 |
| Veto LLD | 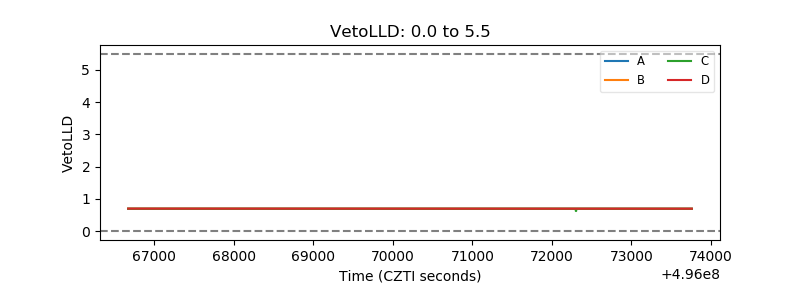 |
| Alpha Counter | 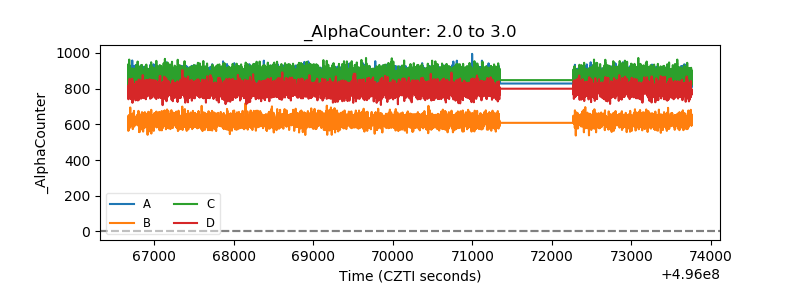 |
| _CPM_Rate | 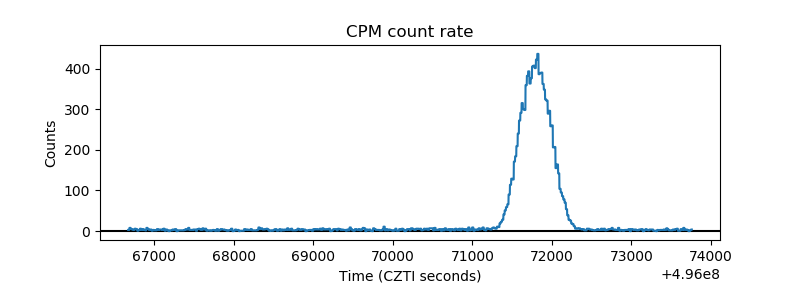 |
| CZT Counter | 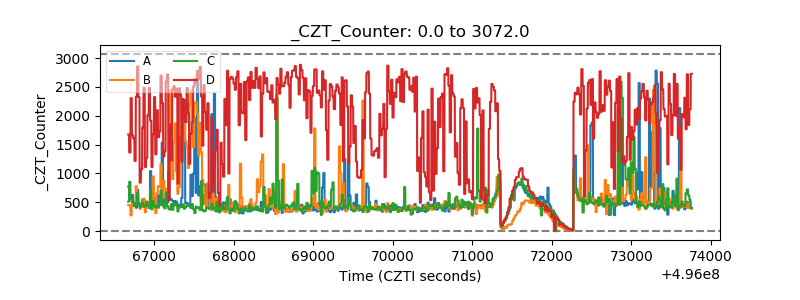 |
| +2.5 Volts monitor |  |
| +5 Volts monitor |  |
| _ROLL_ROT | 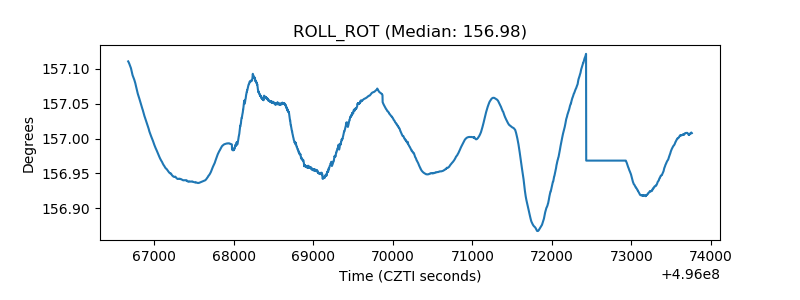 |
| _Roll_DEC | 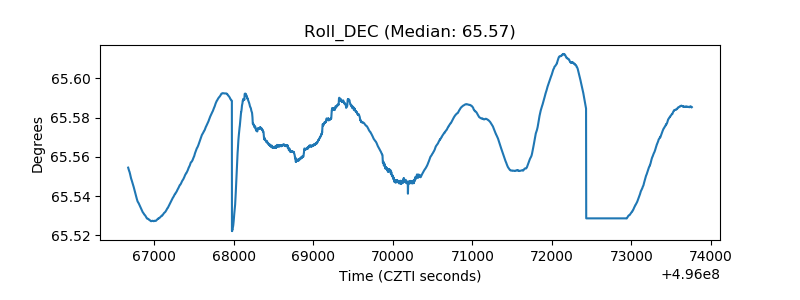 |
| _Roll_RA | 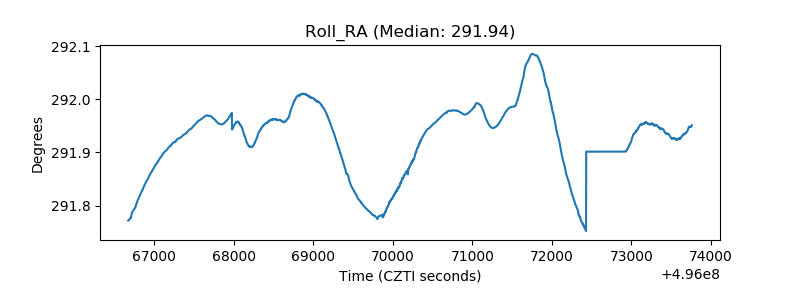 |
| Veto Counter | 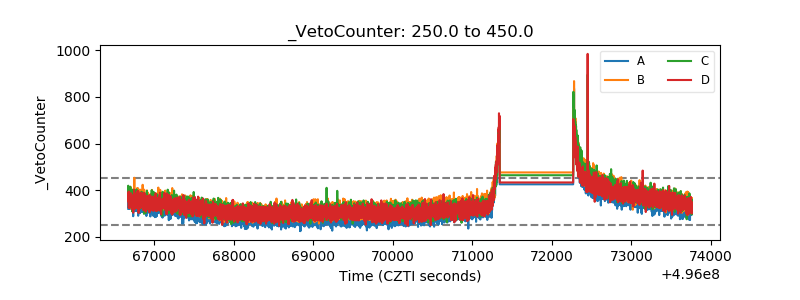 |