| Param | Original file | Final file |
|---|---|---|
| Filename | modeM0/AS1A14_041T01_9000006510_53991cztM0_level2.fits | modeM0/AS1A14_041T01_9000006510_53991cztM0_level2_quad_clean.evt |
| Size (bytes) | 674,038,080 | 76,032,000 |
| Size | 642.8 MB | 72.5 MB |
| Events in quadrant A | 3,045,084 | 588,744 |
| Events in quadrant B | 3,697,290 | 619,153 |
| Events in quadrant C | 4,115,445 | 529,507 |
| Events in quadrant D | 13,623,811 | 143,269 |
| Mode M9 | |||
|---|---|---|---|
| Quadrant | BADHDUFLAG | Total packets | Discarded packets |
| A | 0 | 11 | 0 |
| B | 0 | 11 | 0 |
| C | 0 | 11 | 0 |
| D | 0 | 11 | 0 |
| Mode SS | |||
|---|---|---|---|
| Quadrant | BADHDUFLAG | Total packets | Discarded packets |
| A | 0 | 122 | 0 |
| B | 0 | 122 | 0 |
| C | 0 | 122 | 0 |
| D | 0 | 122 | 0 |
| Mode M0 | |||
|---|---|---|---|
| Quadrant | BADHDUFLAG | Total packets | Discarded packets |
| A | 0 | 13605 | 1 |
| B | 0 | 15363 | 1 |
| C | 0 | 16689 | 1 |
| D | 0 | 44643 | 1 |
| Quadrant | Total seconds | Saturated seconds | Saturation percentage |
|---|---|---|---|
| A | 6033 | 143 | 2.370297% |
| B | 6033 | 297 | 4.922924% |
| C | 6033 | 422 | 6.994862% |
| D | 6034 | 4638 | 76.864435% |
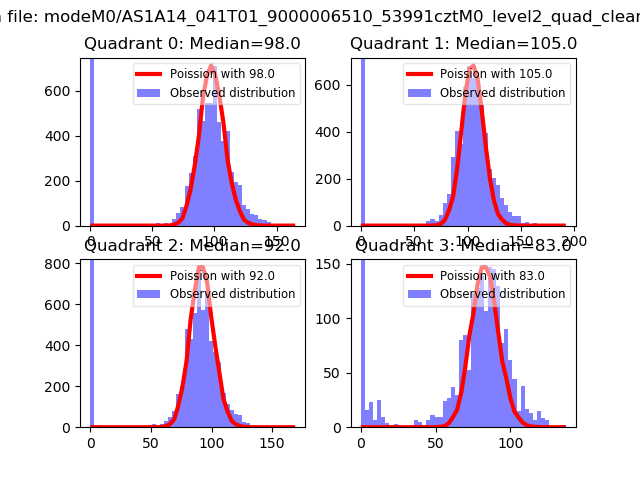
Noise dominated data is calculated using 1-second bins in cleaned event files. If a bin has >2000 counts, and if more than 50% of those come from <1% of pixels, then it is considered to be noise-dominated and hence unusable.
| Quadrant | # 1 sec bins | Bins with >0 counts | Bins with >2000 counts | High rate bins dominated by noise | Noise dominated (total time) | Noise dominated (detector-on time) | Marked lightcurve |
|---|---|---|---|---|---|---|---|
| A | 7108 | 6034 | 92 | 92 | 1.29% | 1.52% | 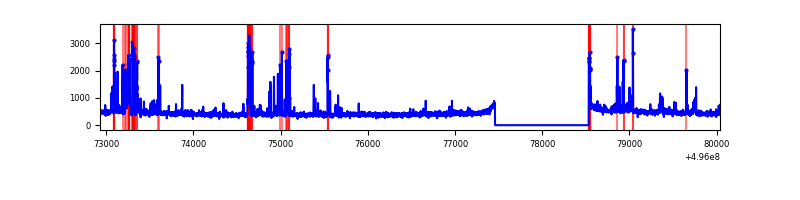 |
| B | 7108 | 6034 | 226 | 226 | 3.18% | 3.75% | 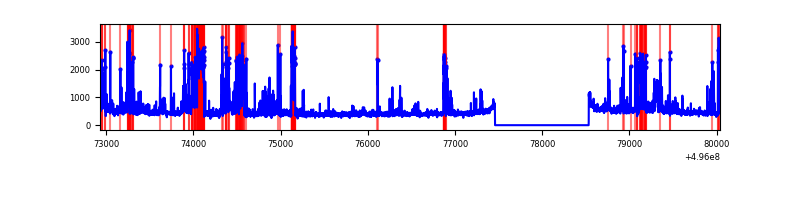 |
| C | 7108 | 6034 | 384 | 384 | 5.40% | 6.36% | 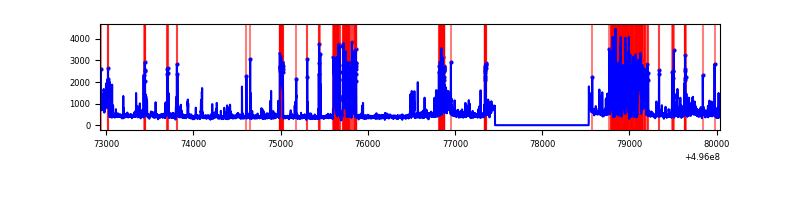 |
| D | 7108 | 6033 | 4398 | 4398 | 61.87% | 72.90% | 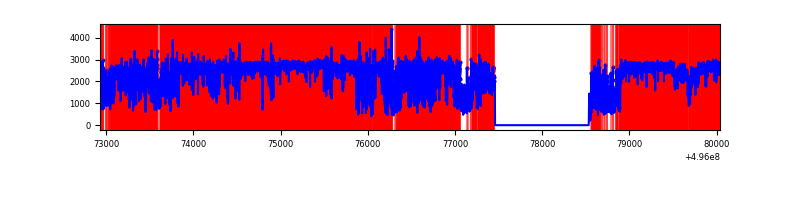 |
Top three noisy pixels from each quadrant. If the there are fewer than three noisy pixels in the level2.evt file, extra rows are filled as -1
| Pixel properties | Quadrant properties | ||||||
|---|---|---|---|---|---|---|---|
| Quadrant | DetID | PixID | Counts | Sigma | Mean | Median | Sigma |
| A | 15 | 174 | 444647 | 2806.64 | 636 | 619 | 158.2 |
| A | 0 | 8 | 28368 | 175.4 | 636 | 619 | 158.2 |
| A | 8 | 251 | 26306 | 162.36 | 636 | 619 | 158.2 |
| B | 0 | 213 | 492546 | 3685.3 | 629 | 607 | 133.5 |
| B | 2 | 249 | 312018 | 2332.89 | 629 | 607 | 133.5 |
| B | 5 | 185 | 183308 | 1368.68 | 629 | 607 | 133.5 |
| C | 1 | 241 | 560283 | 3397.35 | 607 | 600 | 164.7 |
| C | 13 | 3 | 546061 | 3311.02 | 607 | 600 | 164.7 |
| C | 15 | 233 | 345929 | 2096.19 | 607 | 600 | 164.7 |
| D | 8 | 176 | 10633367 | 112050.19 | 324 | 308 | 94.9 |
| D | 2 | 165 | 729059 | 7679.51 | 324 | 308 | 94.9 |
| D | 2 | 172 | 390127 | 4107.87 | 324 | 308 | 94.9 |
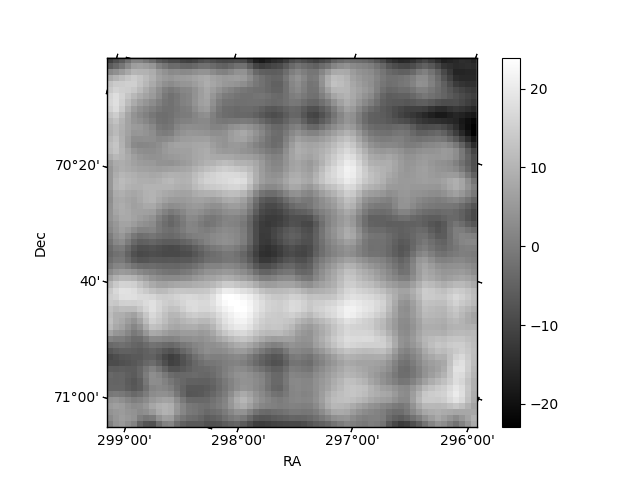
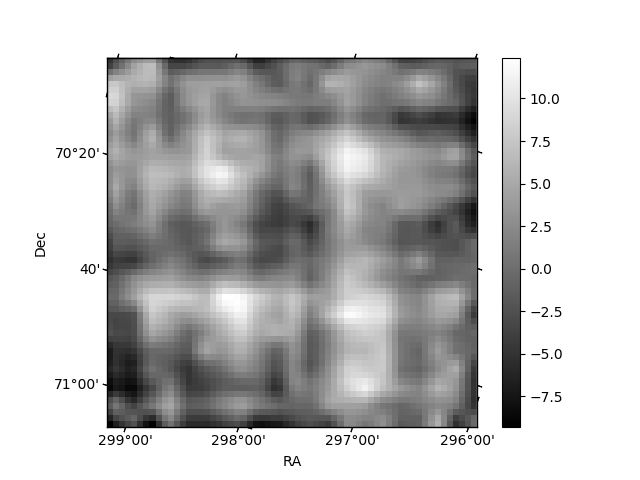
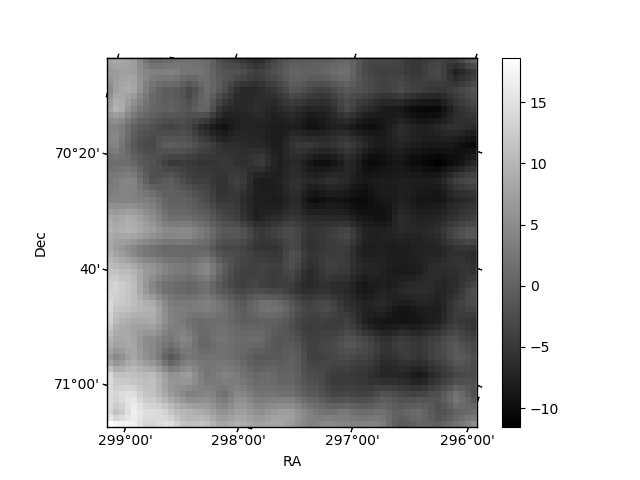
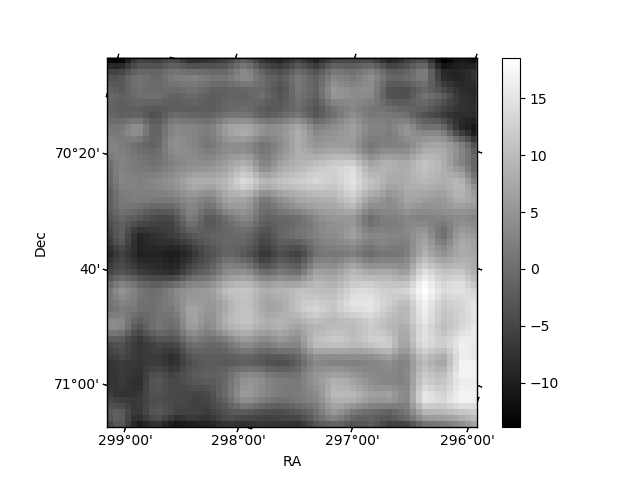
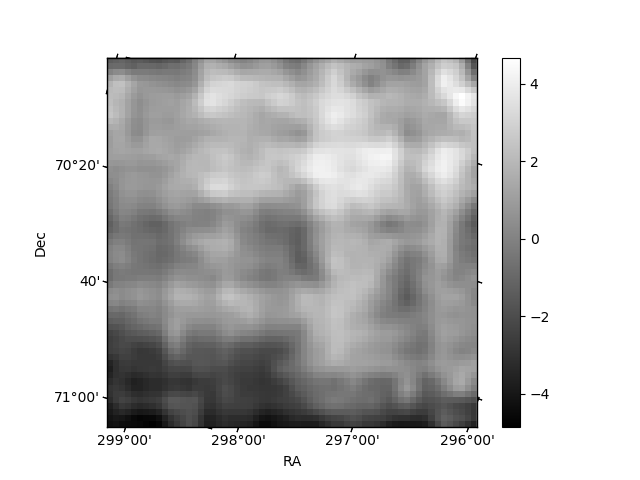
Histogram calculated using DETX and DETY for each event in the final _common_clean file
| Quadrant A | 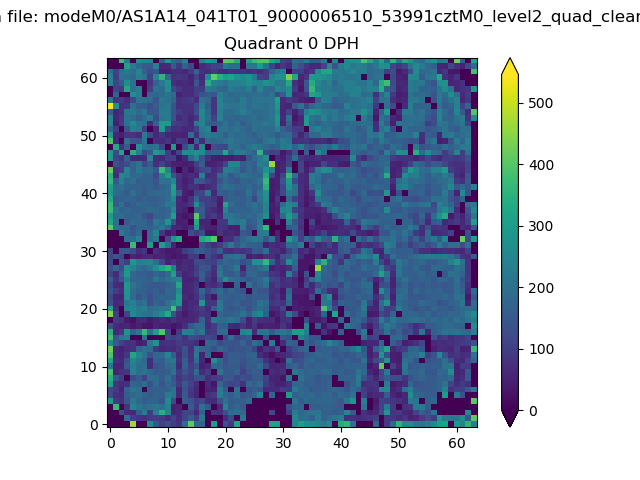 |
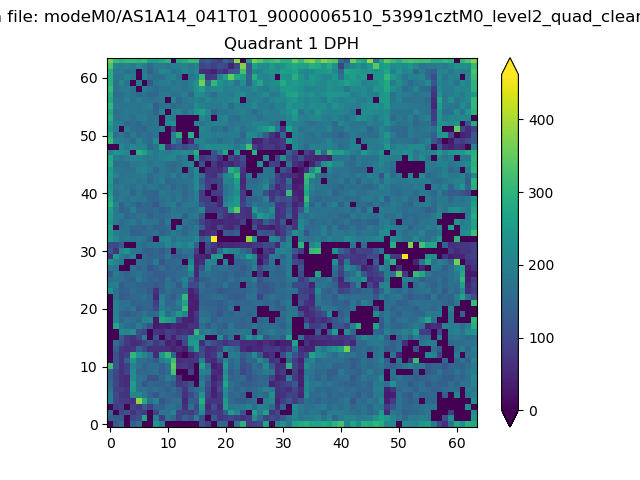 |
Quadrant B |
|---|---|---|---|
| Quadrant D | 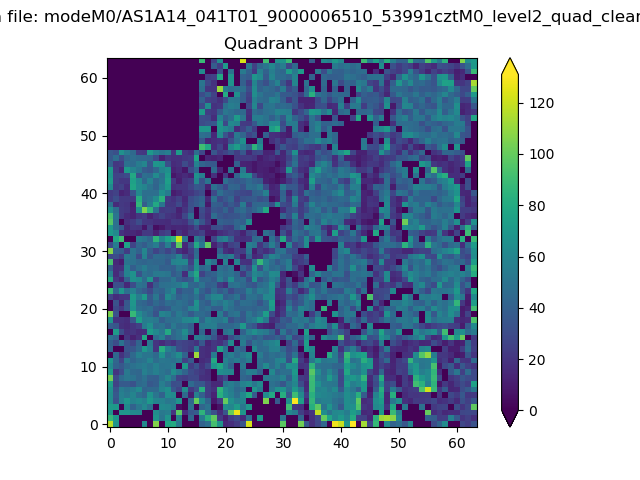 |
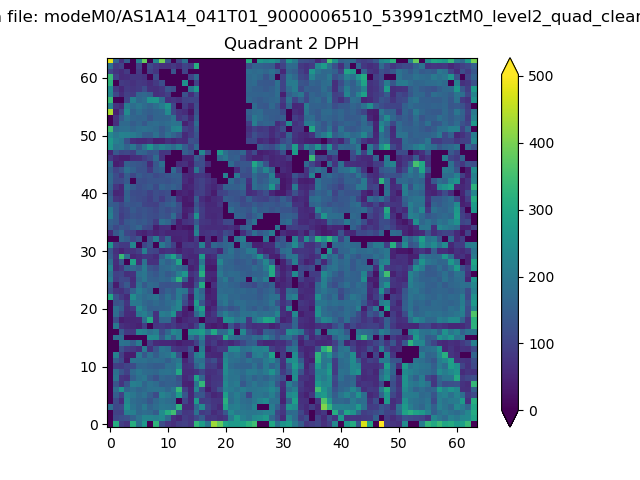 |
Quadrant C |
| Plot type | Count rate plots | Images |
|---|---|---|
| Comparison with Poisson distribution Blue bars denote a histogram of data divided into 1 sec bins. Red curve is a Poisson curve with rate = median count rate of data. |
 |
 |
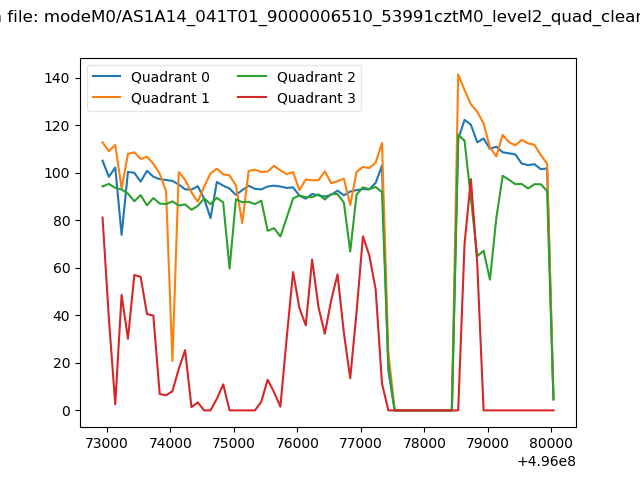
| Quadrant-wise count rates Data is divided into 100 sec bins |
 |
|
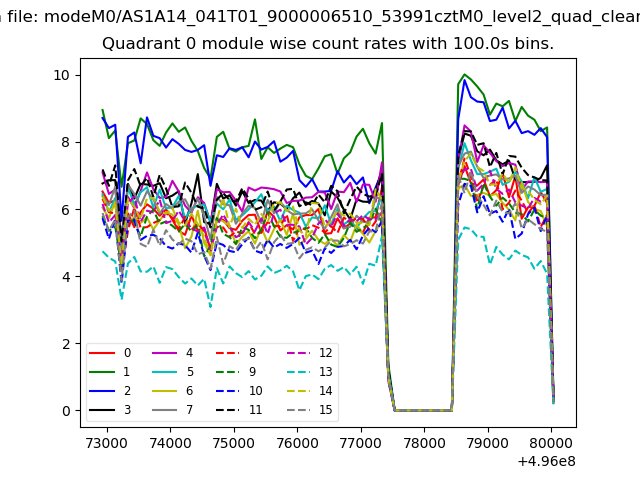
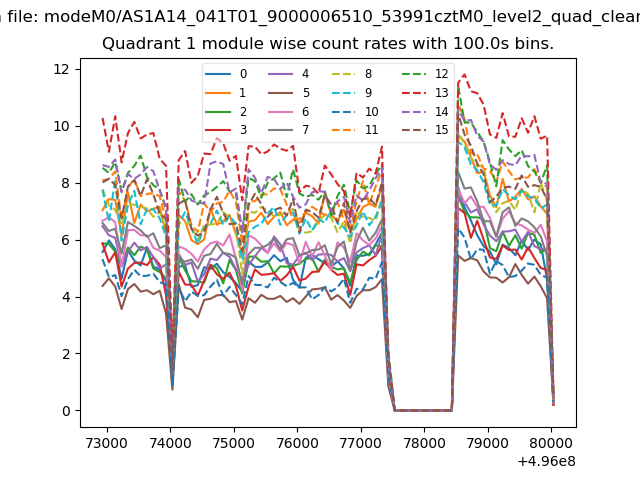
| Module-wise count rates for Quadrant A Data is divided into 100 sec bins |
 |
 |
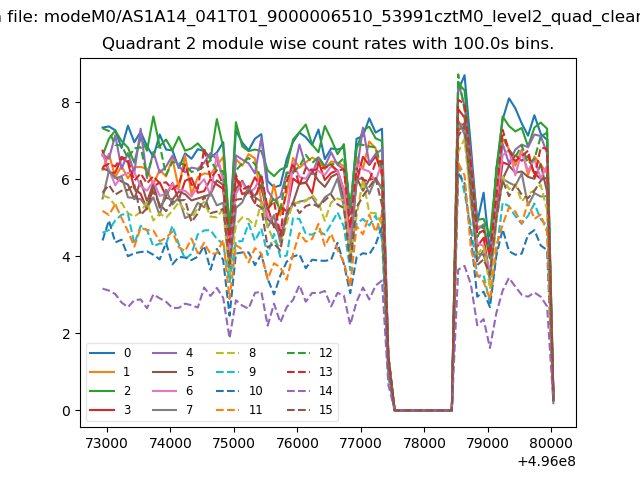
| Module-wise count rates for Quadrant B Data is divided into 100 sec bins |
 |
 |
| Module-wise count rates for Quadrant C Data is divided into 100 sec bins |
 |
 |
| Module-wise count rates for Quadrant D Data is divided into 100 sec bins |
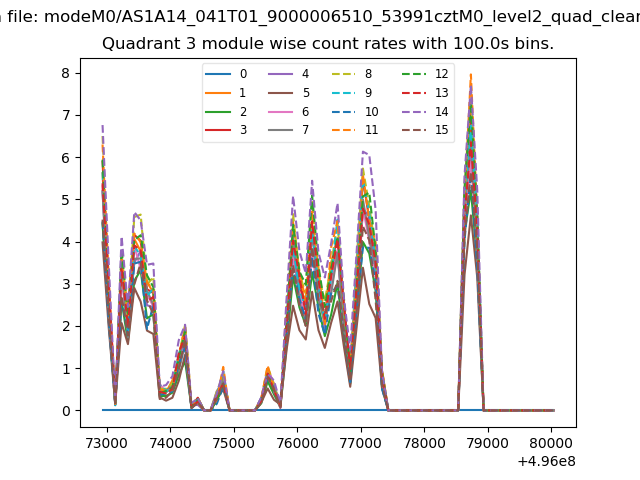 |
 |
| Parameter | Plot |
|---|---|
| CZT HV Monitor |  |
| D_VDD | 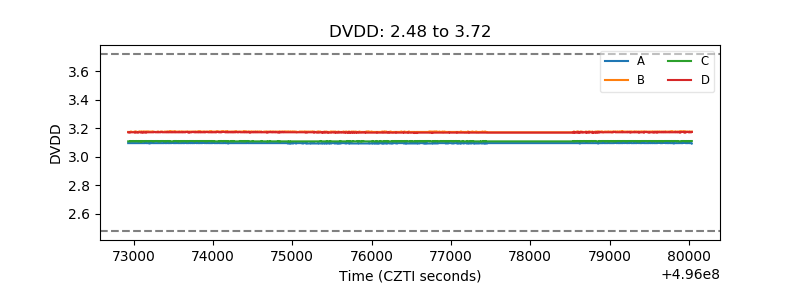 |
| Temperature 1 | 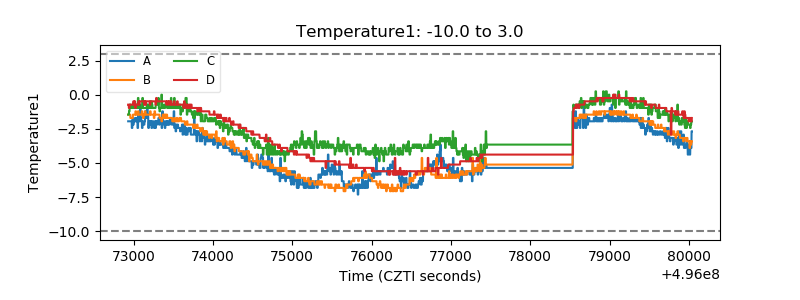 |
| Veto HV Monitor | 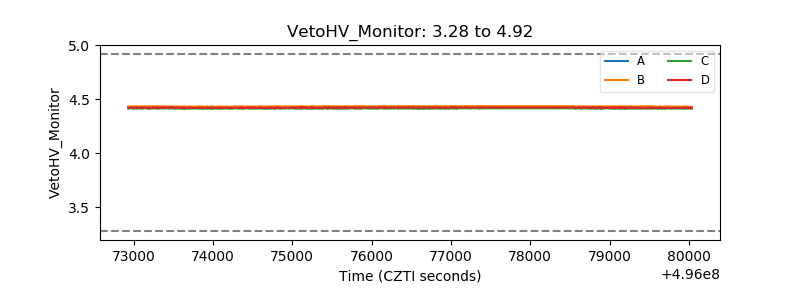 |
| Veto LLD | 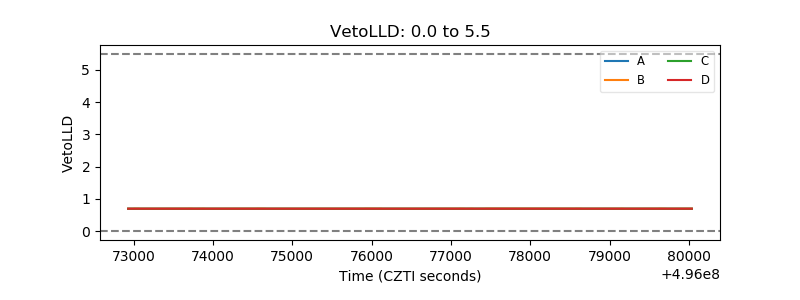 |
| Alpha Counter | 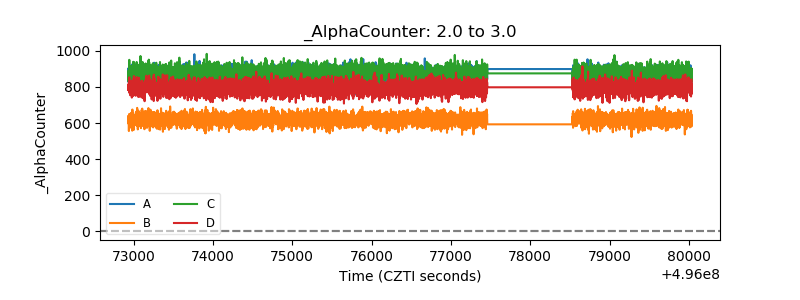 |
| _CPM_Rate | 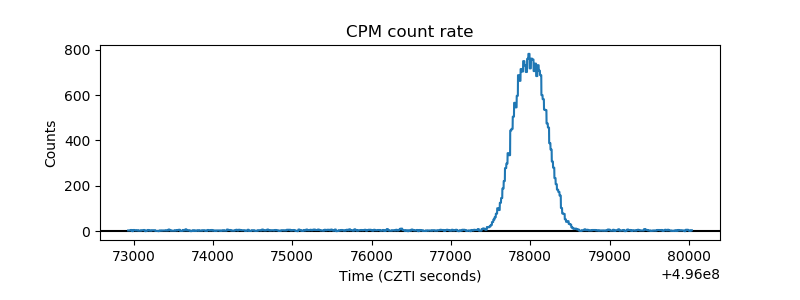 |
| CZT Counter | 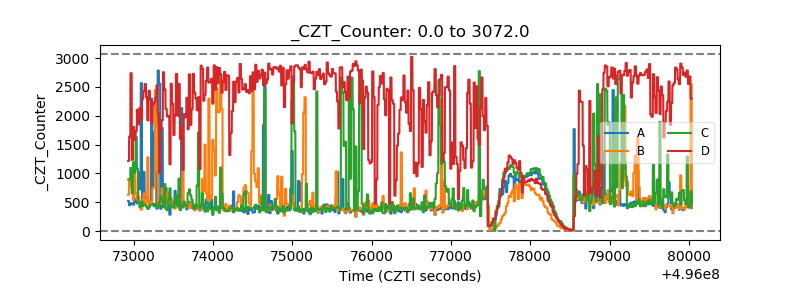 |
| +2.5 Volts monitor |  |
| +5 Volts monitor |  |
| _ROLL_ROT | 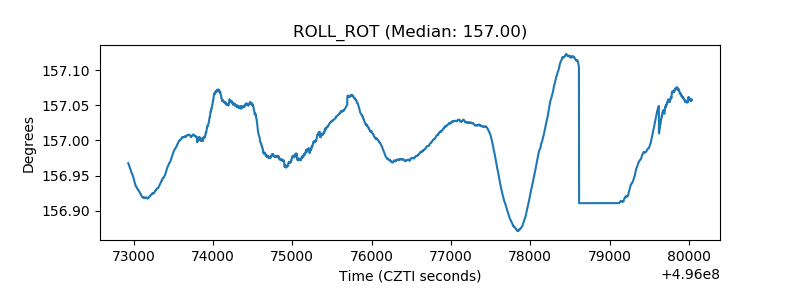 |
| _Roll_DEC | 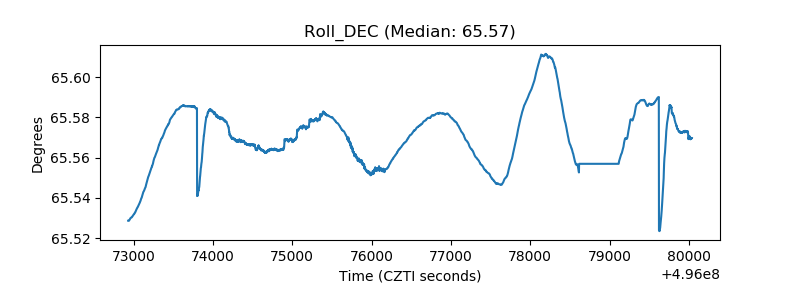 |
| _Roll_RA | 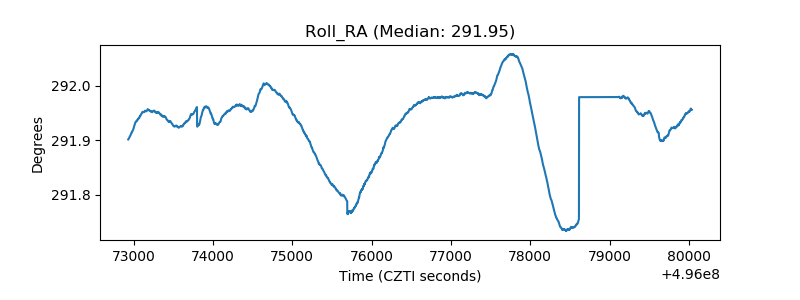 |
| Veto Counter | 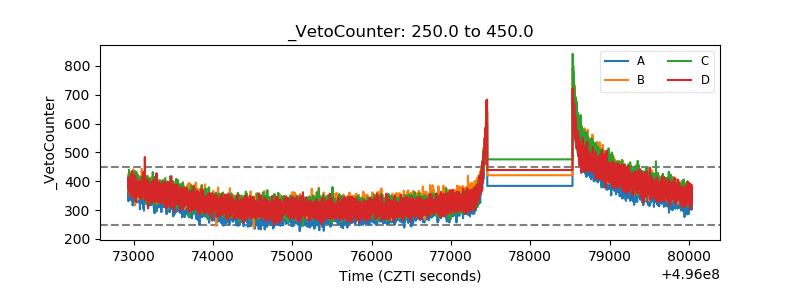 |