| Param | Original file | Final file |
|---|---|---|
| Filename | modeM0/AS1A14_041T01_9000006510_53992cztM0_level2.fits | modeM0/AS1A14_041T01_9000006510_53992cztM0_level2_quad_clean.evt |
| Size (bytes) | 639,639,360 | 75,179,520 |
| Size | 610.0 MB | 71.7 MB |
| Events in quadrant A | 2,978,998 | 577,837 |
| Events in quadrant B | 3,650,959 | 620,605 |
| Events in quadrant C | 3,367,055 | 548,511 |
| Events in quadrant D | 13,228,754 | 123,540 |
| Mode M9 | |||
|---|---|---|---|
| Quadrant | BADHDUFLAG | Total packets | Discarded packets |
| A | 0 | 12 | 0 |
| B | 0 | 12 | 0 |
| C | 0 | 12 | 0 |
| D | 0 | 12 | 0 |
| Mode SS | |||
|---|---|---|---|
| Quadrant | BADHDUFLAG | Total packets | Discarded packets |
| A | 0 | 118 | 0 |
| B | 0 | 118 | 0 |
| C | 0 | 118 | 0 |
| D | 0 | 118 | 0 |
| Mode M0 | |||
|---|---|---|---|
| Quadrant | BADHDUFLAG | Total packets | Discarded packets |
| A | 0 | 13081 | 1 |
| B | 0 | 15079 | 5 |
| C | 0 | 14128 | 1 |
| D | 0 | 43258 | 1 |
| Quadrant | Total seconds | Saturated seconds | Saturation percentage |
|---|---|---|---|
| A | 5805 | 125 | 2.153316% |
| B | 5804 | 215 | 3.704342% |
| C | 5804 | 133 | 2.291523% |
| D | 5805 | 4539 | 78.191214% |
Noise dominated data is calculated using 1-second bins in cleaned event files. If a bin has >2000 counts, and if more than 50% of those come from <1% of pixels, then it is considered to be noise-dominated and hence unusable.
| Quadrant | # 1 sec bins | Bins with >0 counts | Bins with >2000 counts | High rate bins dominated by noise | Noise dominated (total time) | Noise dominated (detector-on time) | Marked lightcurve |
|---|---|---|---|---|---|---|---|
| A | 6990 | 5806 | 120 | 120 | 1.72% | 2.07% | 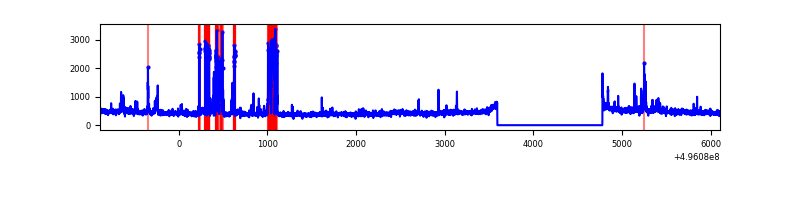 |
| B | 6989 | 5805 | 135 | 135 | 1.93% | 2.33% | 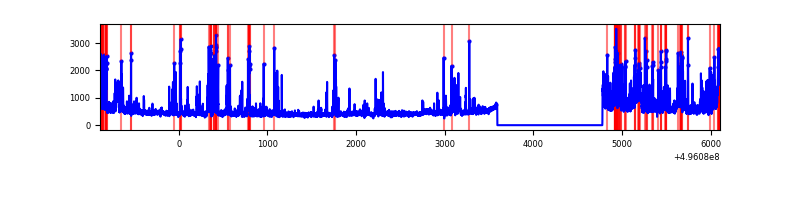 |
| C | 6989 | 5805 | 105 | 105 | 1.50% | 1.81% | 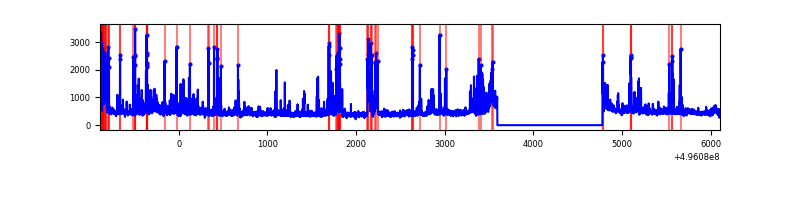 |
| D | 6990 | 5805 | 4384 | 4384 | 62.72% | 75.52% | 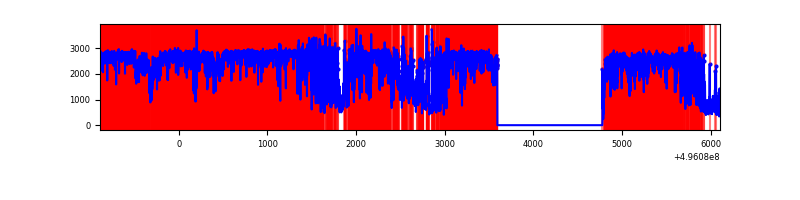 |
Top three noisy pixels from each quadrant. If the there are fewer than three noisy pixels in the level2.evt file, extra rows are filled as -1
| Pixel properties | Quadrant properties | ||||||
|---|---|---|---|---|---|---|---|
| Quadrant | DetID | PixID | Counts | Sigma | Mean | Median | Sigma |
| A | 15 | 174 | 485499 | 3147.33 | 613 | 597 | 154.1 |
| A | 14 | 239 | 24537 | 155.39 | 613 | 597 | 154.1 |
| A | 10 | 253 | 20378 | 128.39 | 613 | 597 | 154.1 |
| B | 0 | 213 | 421998 | 3194.78 | 613 | 591 | 131.9 |
| B | 0 | 155 | 201183 | 1520.73 | 613 | 591 | 131.9 |
| B | 4 | 81 | 137075 | 1034.72 | 613 | 591 | 131.9 |
| C | 14 | 80 | 275572 | 1655.43 | 606 | 602 | 166.1 |
| C | 13 | 3 | 209250 | 1256.15 | 606 | 602 | 166.1 |
| C | 15 | 233 | 93164 | 557.26 | 606 | 602 | 166.1 |
| D | 8 | 176 | 10697522 | 137338.95 | 270 | 257 | 77.9 |
| D | 2 | 172 | 552102 | 7084.97 | 270 | 257 | 77.9 |
| D | 2 | 165 | 243673 | 3125.14 | 270 | 257 | 77.9 |
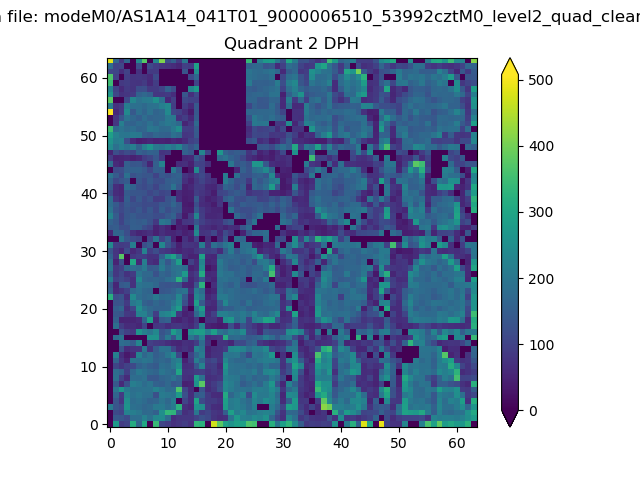
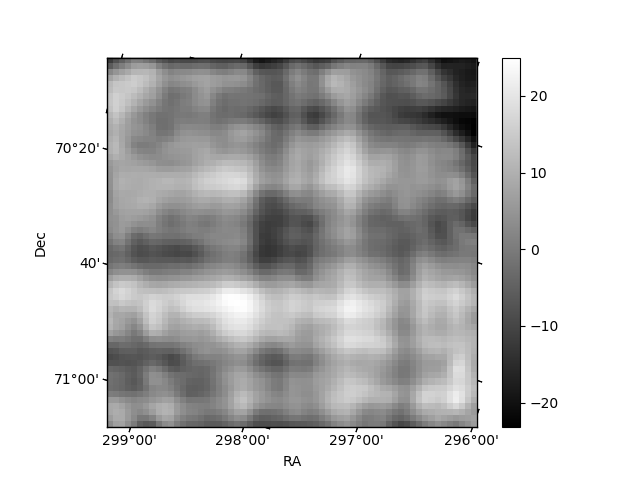
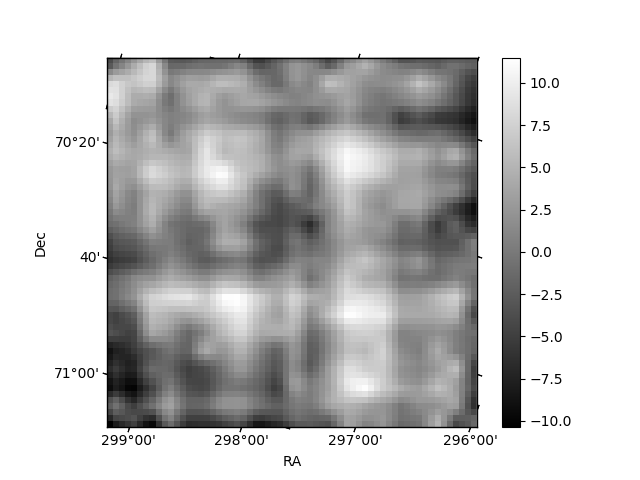
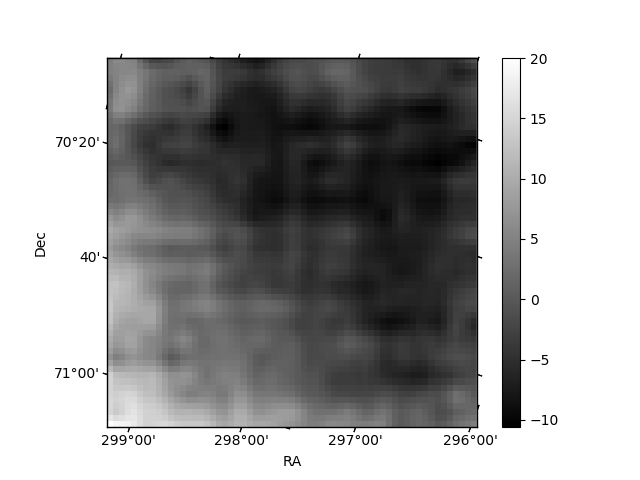
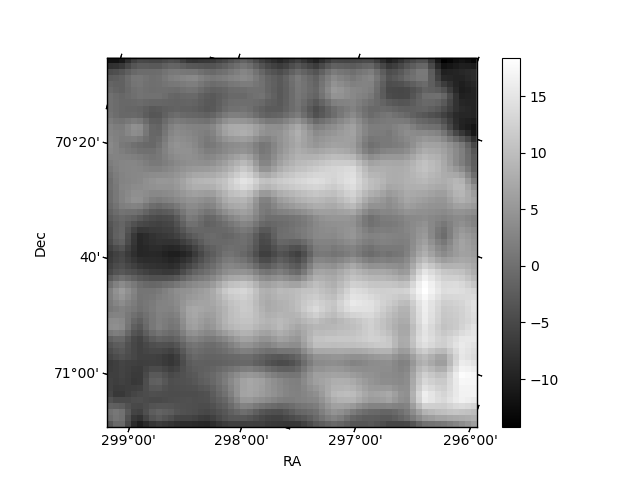
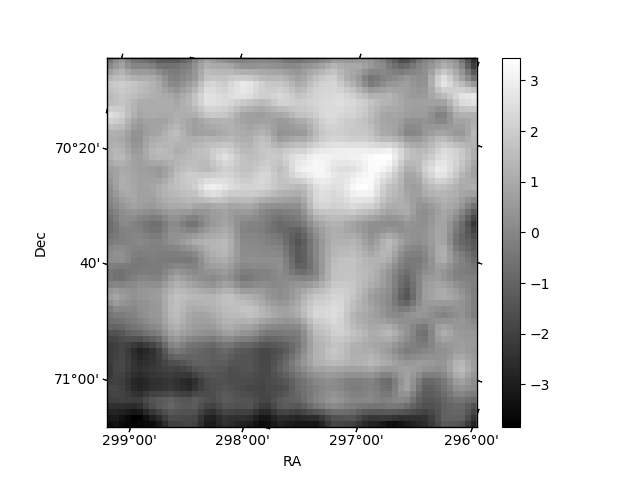
Histogram calculated using DETX and DETY for each event in the final _common_clean file
| Quadrant A | 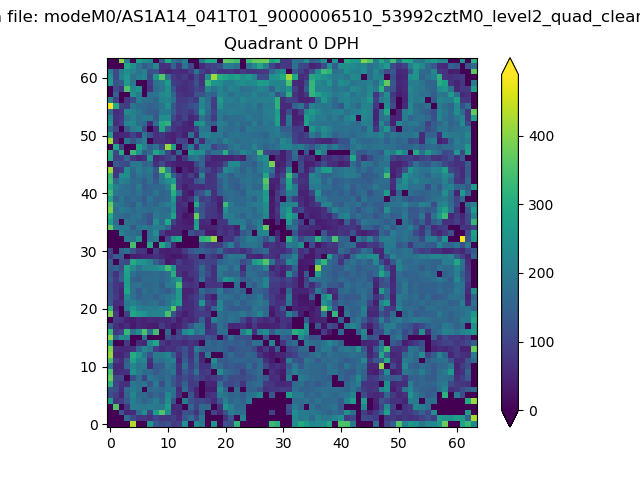 |
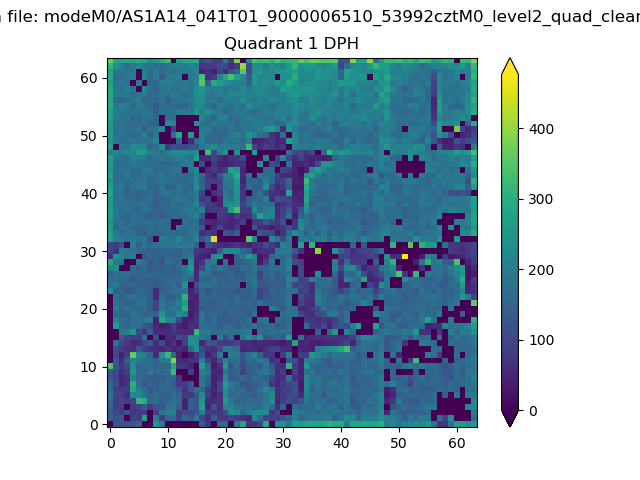 |
Quadrant B |
|---|---|---|---|
| Quadrant D | 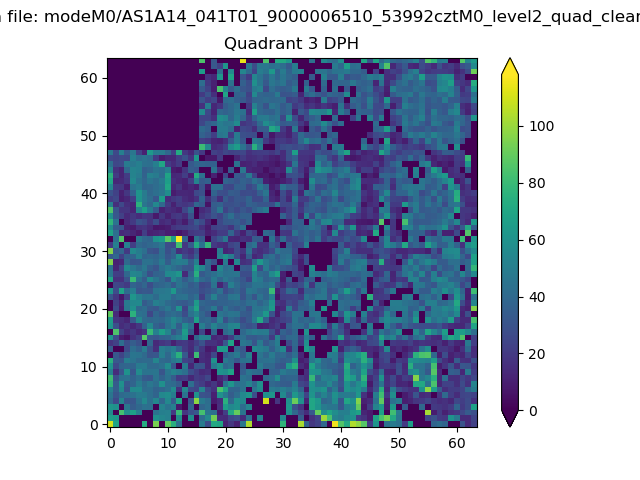 |
 |
Quadrant C |
| Plot type | Count rate plots | Images |
|---|---|---|
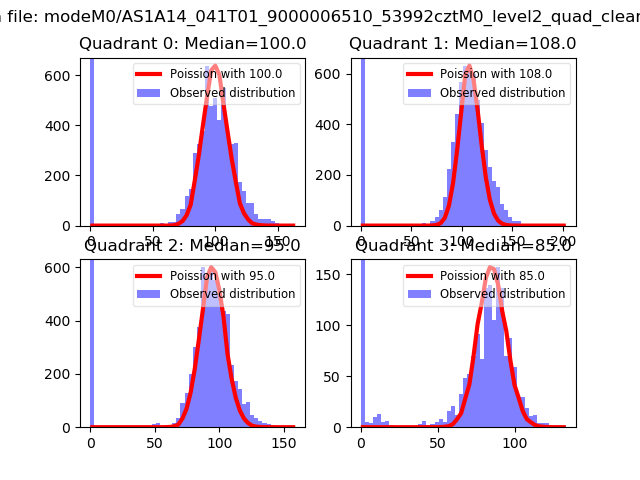
| Comparison with Poisson distribution Blue bars denote a histogram of data divided into 1 sec bins. Red curve is a Poisson curve with rate = median count rate of data. |
 |
 |
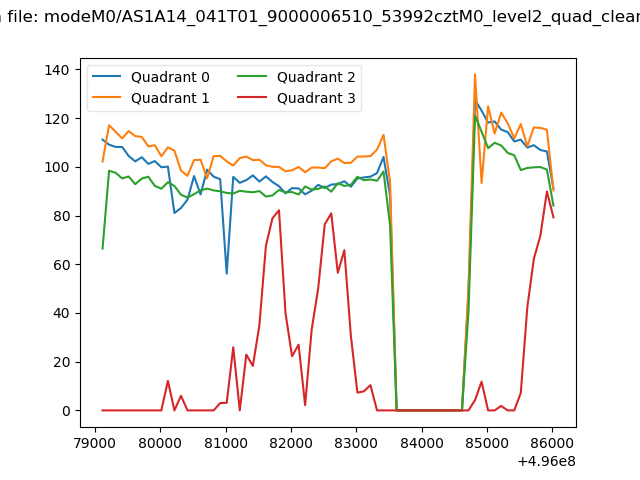
| Quadrant-wise count rates Data is divided into 100 sec bins |
 |
|
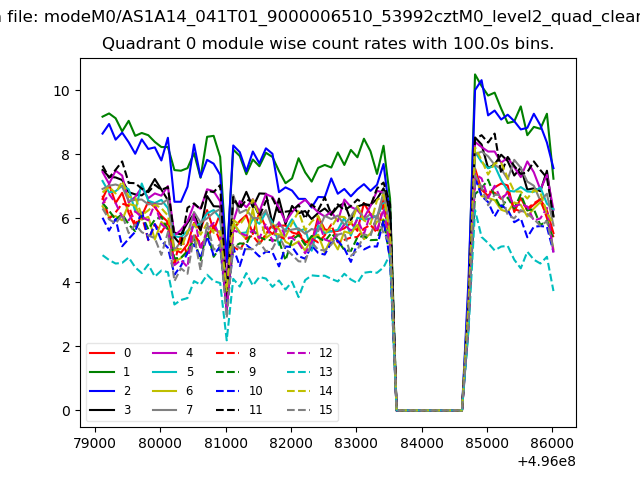
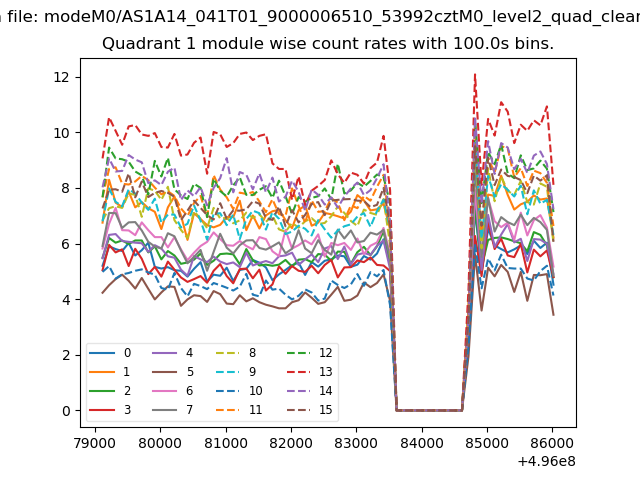
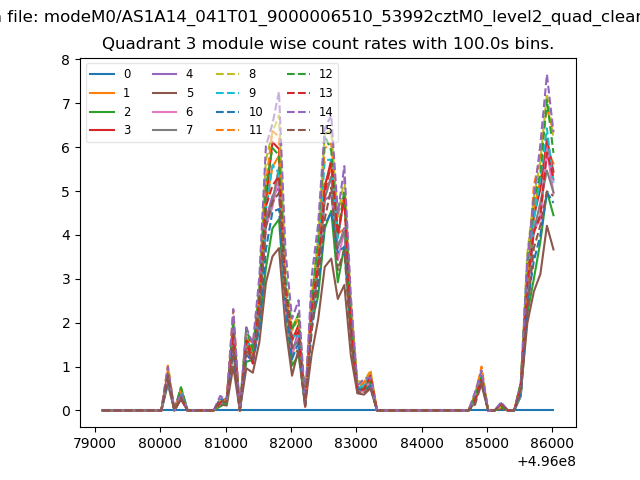
| Module-wise count rates for Quadrant A Data is divided into 100 sec bins |
 |
 |
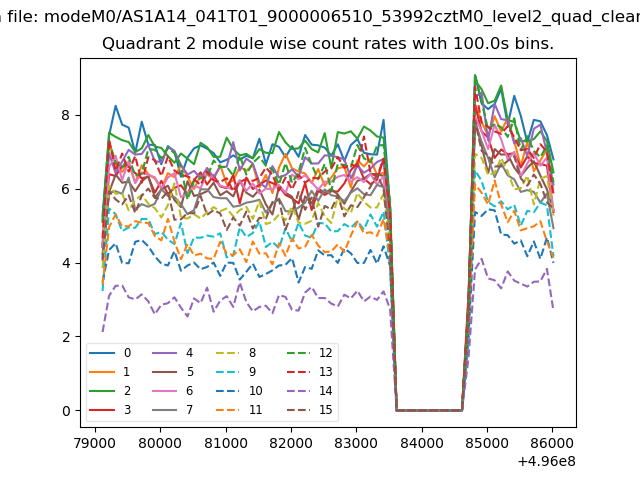
| Module-wise count rates for Quadrant B Data is divided into 100 sec bins |
 |
 |
| Module-wise count rates for Quadrant C Data is divided into 100 sec bins |
 |
 |
| Module-wise count rates for Quadrant D Data is divided into 100 sec bins |
 |
 |
| Parameter | Plot |
|---|---|
| CZT HV Monitor | 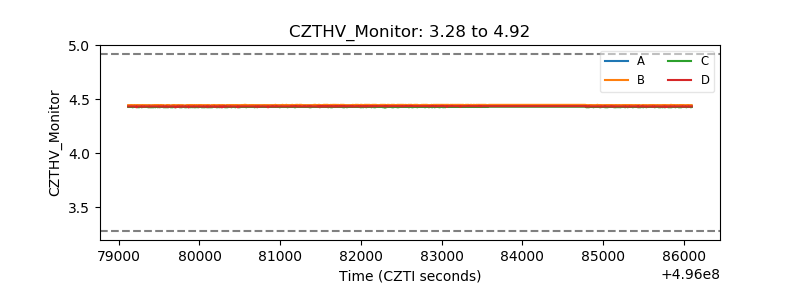 |
| D_VDD | 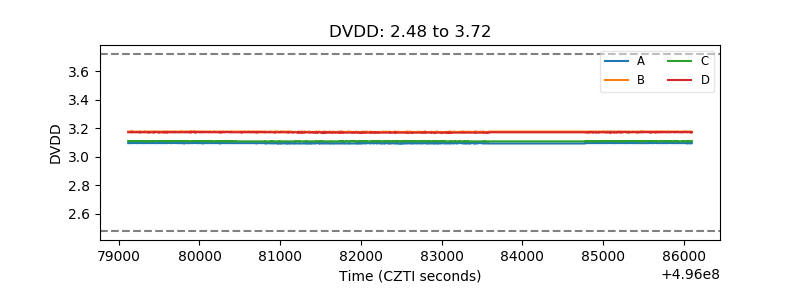 |
| Temperature 1 | 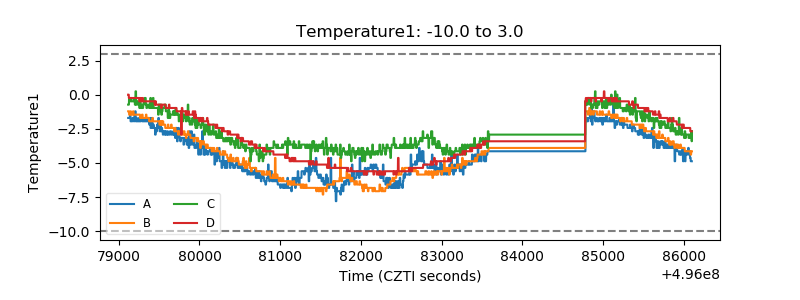 |
| Veto HV Monitor | 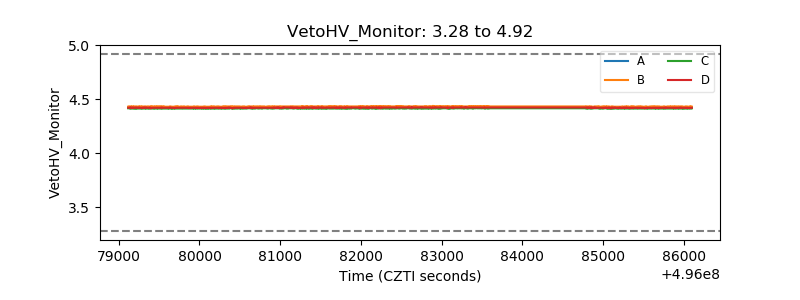 |
| Veto LLD | 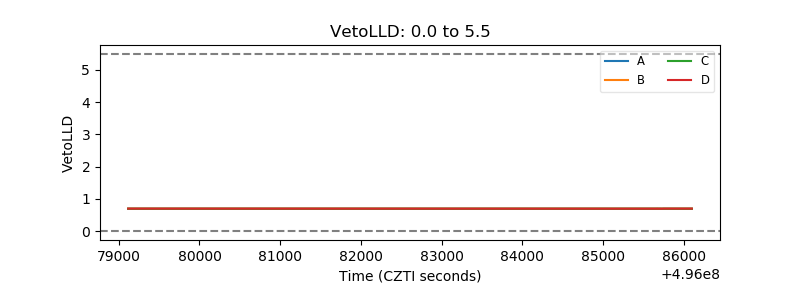 |
| Alpha Counter | 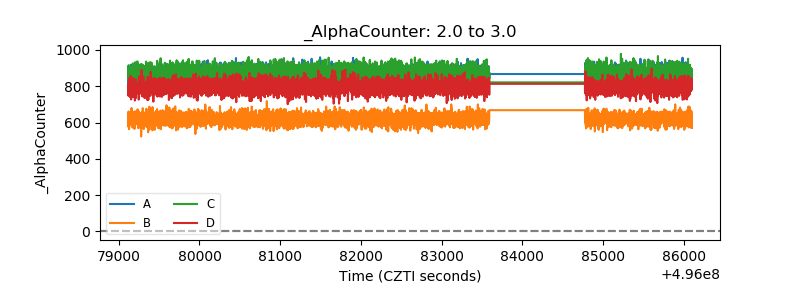 |
| _CPM_Rate | 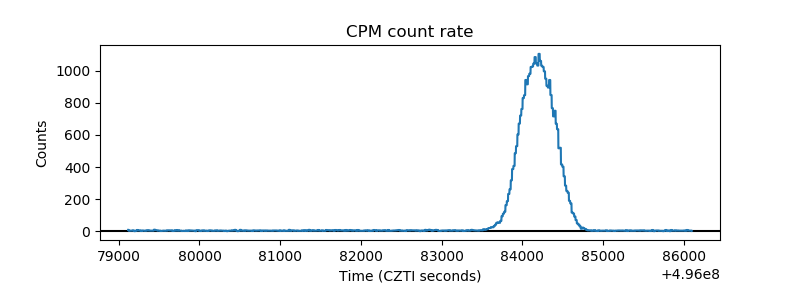 |
| CZT Counter | 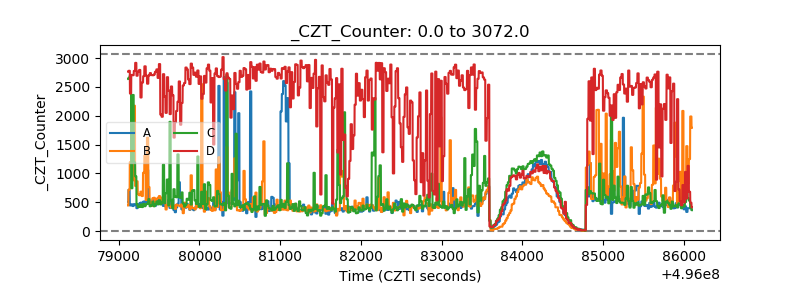 |
| +2.5 Volts monitor |  |
| +5 Volts monitor | 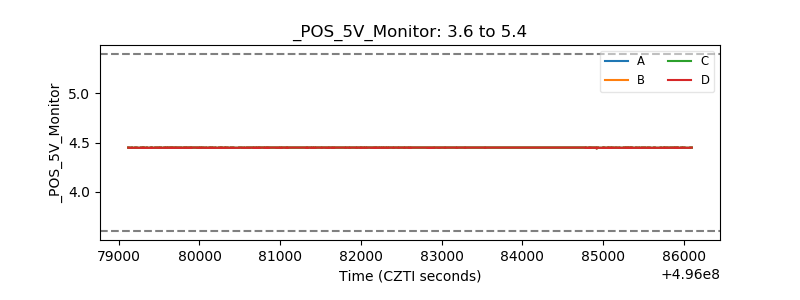 |
| _ROLL_ROT | 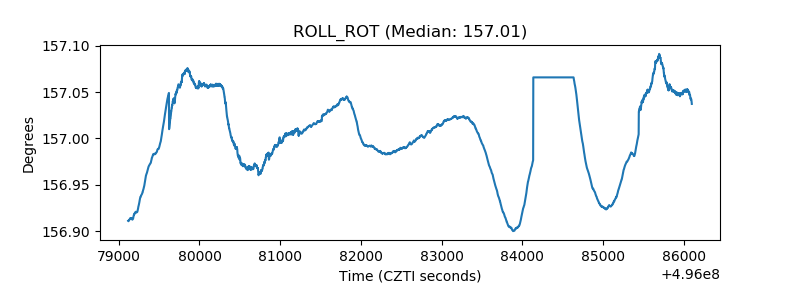 |
| _Roll_DEC | 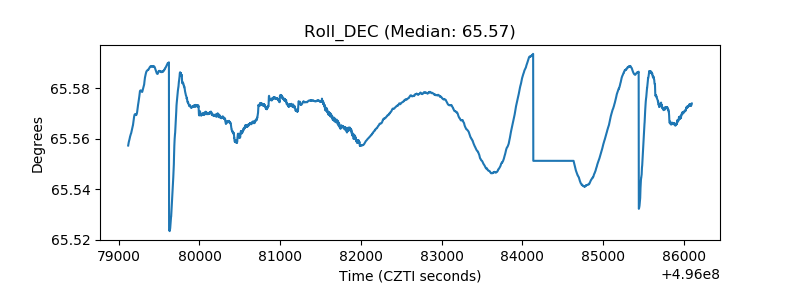 |
| _Roll_RA | 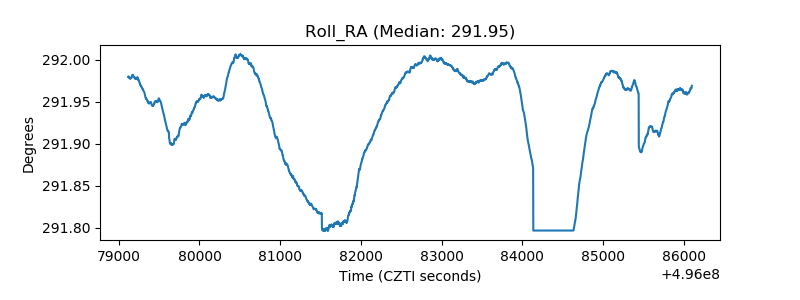 |
| Veto Counter | 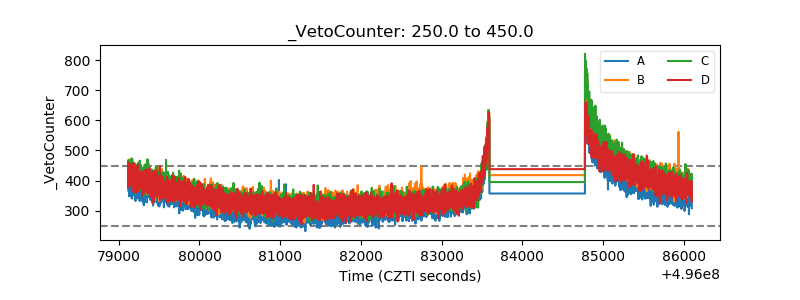 |