| Param | Original file | Final file |
|---|---|---|
| Filename | modeM0/AS1A14_041T01_9000006510_53994cztM0_level2.fits | modeM0/AS1A14_041T01_9000006510_53994cztM0_level2_quad_clean.evt |
| Size (bytes) | 809,498,880 | 75,337,920 |
| Size | 772.0 MB | 71.8 MB |
| Events in quadrant A | 3,166,916 | 634,352 |
| Events in quadrant B | 6,329,111 | 540,967 |
| Events in quadrant C | 6,112,674 | 511,171 |
| Events in quadrant D | 13,862,504 | 150,010 |
| Mode M9 | |||
|---|---|---|---|
| Quadrant | BADHDUFLAG | Total packets | Discarded packets |
| A | 0 | 12 | 0 |
| B | 0 | 12 | 0 |
| C | 0 | 12 | 0 |
| D | 0 | 12 | 0 |
| Mode SS | |||
|---|---|---|---|
| Quadrant | BADHDUFLAG | Total packets | Discarded packets |
| A | 0 | 130 | 0 |
| B | 0 | 130 | 0 |
| C | 0 | 130 | 0 |
| D | 0 | 130 | 0 |
| Mode M0 | |||
|---|---|---|---|
| Quadrant | BADHDUFLAG | Total packets | Discarded packets |
| A | 0 | 14116 | 2 |
| B | 0 | 23477 | 2 |
| C | 0 | 22764 | 7 |
| D | 0 | 45592 | 2 |
| Quadrant | Total seconds | Saturated seconds | Saturation percentage |
|---|---|---|---|
| A | 6368 | 80 | 1.256281% |
| B | 6368 | 1458 | 22.895729% |
| C | 6368 | 1193 | 18.734296% |
| D | 6368 | 4838 | 75.973618% |
Noise dominated data is calculated using 1-second bins in cleaned event files. If a bin has >2000 counts, and if more than 50% of those come from <1% of pixels, then it is considered to be noise-dominated and hence unusable.
| Quadrant | # 1 sec bins | Bins with >0 counts | Bins with >2000 counts | High rate bins dominated by noise | Noise dominated (total time) | Noise dominated (detector-on time) | Marked lightcurve |
|---|---|---|---|---|---|---|---|
| A | 7548 | 6369 | 51 | 51 | 0.68% | 0.80% | 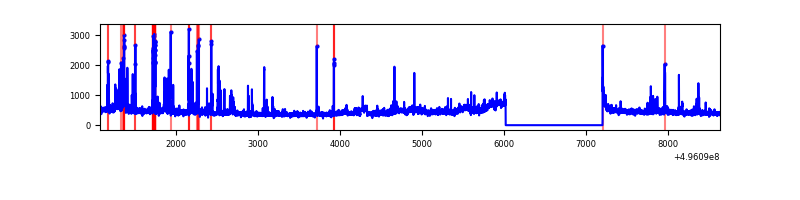 |
| B | 7548 | 6369 | 1115 | 1115 | 14.77% | 17.51% | 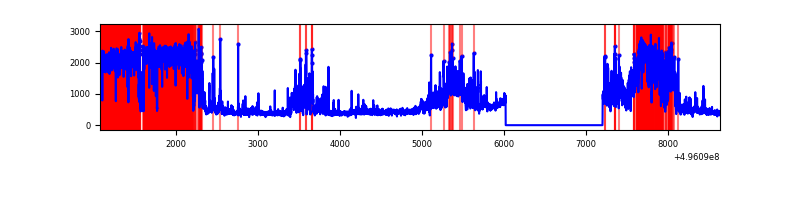 |
| C | 7547 | 6368 | 1112 | 1112 | 14.73% | 17.46% | 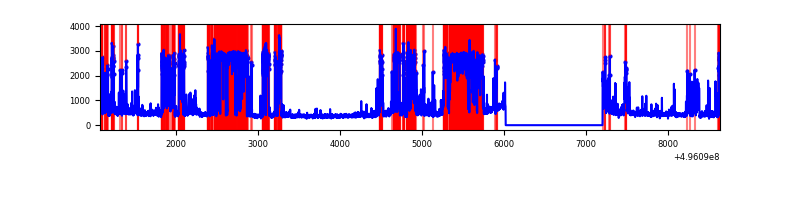 |
| D | 7548 | 6368 | 4353 | 4353 | 57.67% | 68.36% | 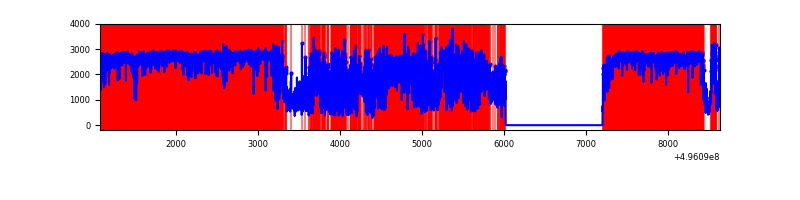 |
Top three noisy pixels from each quadrant. If the there are fewer than three noisy pixels in the level2.evt file, extra rows are filled as -1
| Pixel properties | Quadrant properties | ||||||
|---|---|---|---|---|---|---|---|
| Quadrant | DetID | PixID | Counts | Sigma | Mean | Median | Sigma |
| A | 15 | 174 | 296273 | 1763.89 | 674 | 655 | 167.6 |
| A | 4 | 3 | 84221 | 498.62 | 674 | 655 | 167.6 |
| A | 8 | 6 | 51022 | 300.53 | 674 | 655 | 167.6 |
| B | 4 | 81 | 3477394 | 27375.95 | 599 | 578 | 127.0 |
| B | 0 | 213 | 269657 | 2118.69 | 599 | 578 | 127.0 |
| B | 7 | 252 | 49538 | 385.5 | 599 | 578 | 127.0 |
| C | 1 | 241 | 3179829 | 18736.1 | 613 | 607 | 169.7 |
| C | 12 | 2 | 133350 | 782.29 | 613 | 607 | 169.7 |
| C | 14 | 80 | 105164 | 616.19 | 613 | 607 | 169.7 |
| D | 8 | 176 | 11448393 | 129776.21 | 304 | 289 | 88.2 |
| D | 2 | 165 | 833609 | 9446.55 | 304 | 289 | 88.2 |
| D | 6 | 239 | 199527 | 2258.57 | 304 | 289 | 88.2 |
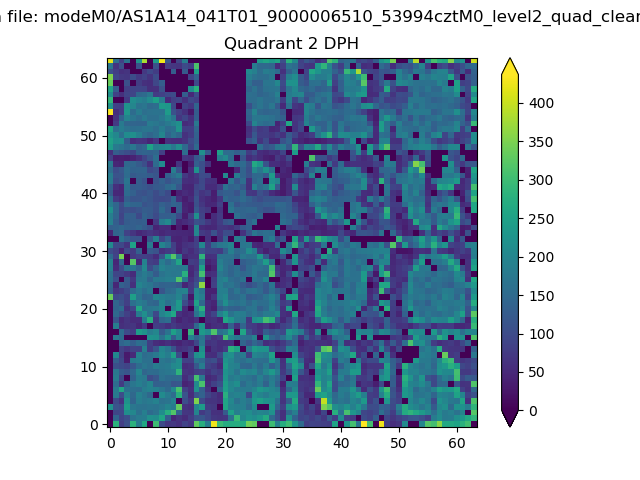
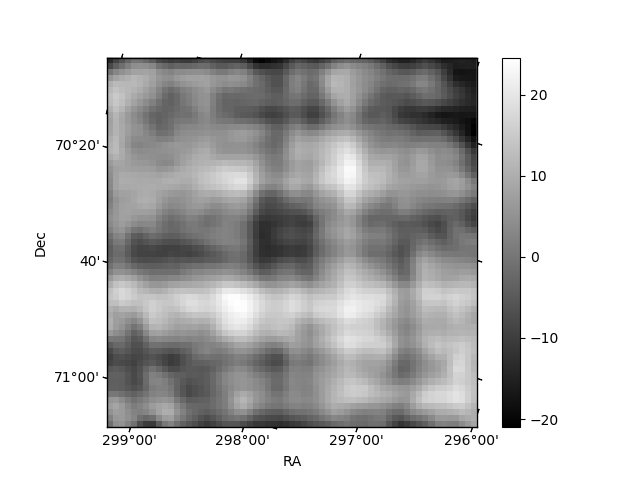
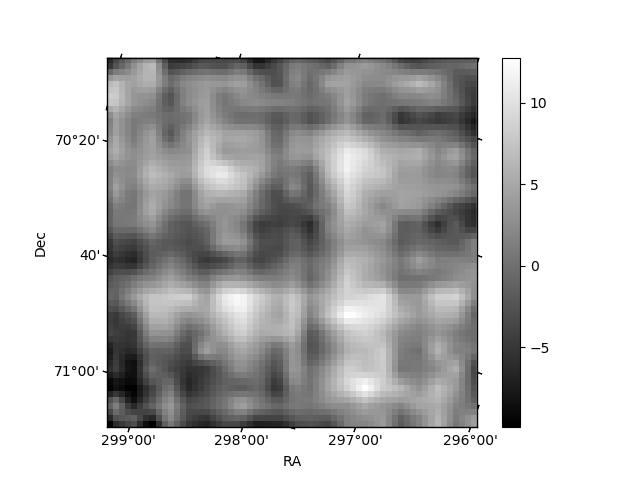
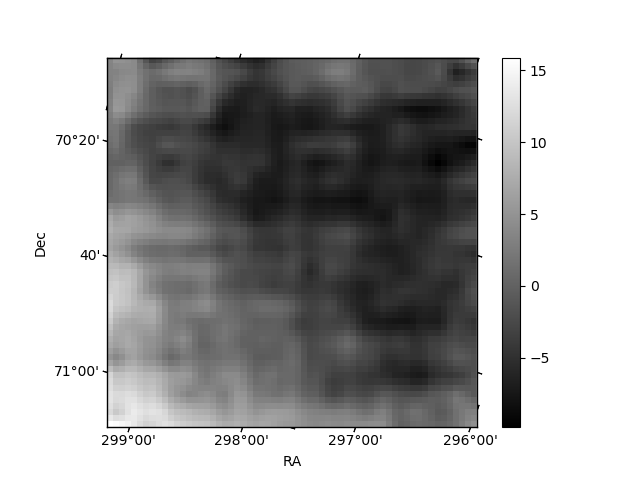
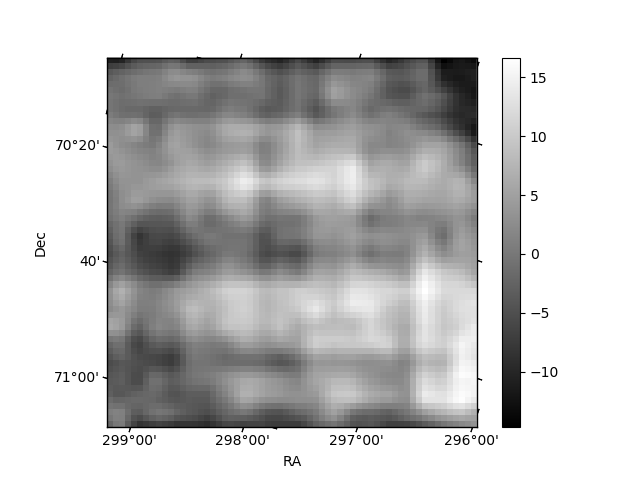
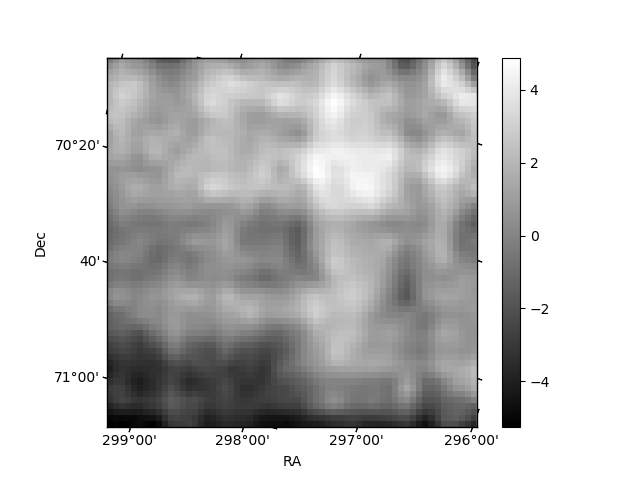
Histogram calculated using DETX and DETY for each event in the final _common_clean file
| Quadrant A | 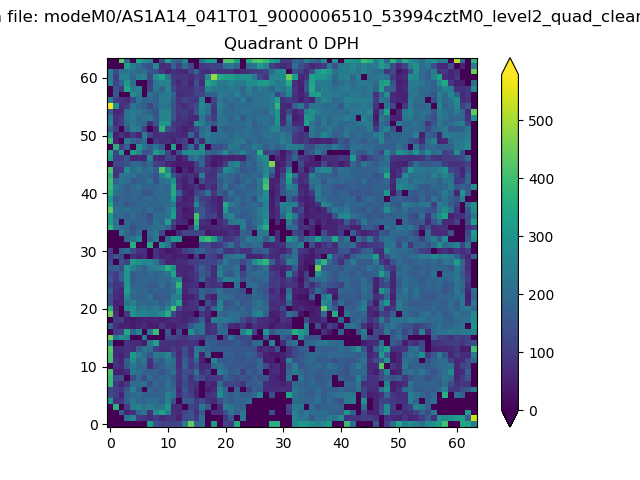 |
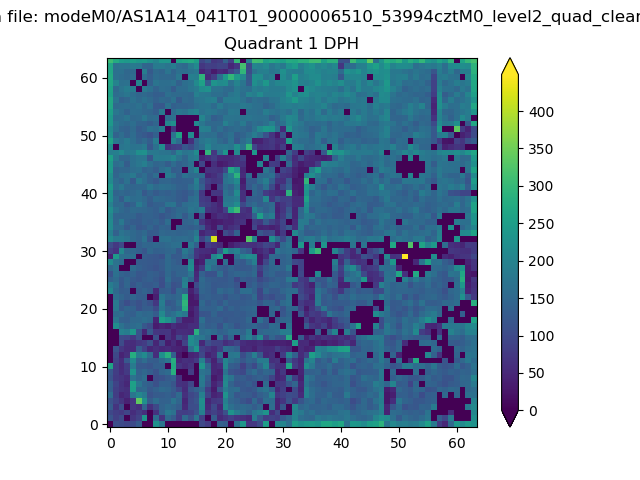 |
Quadrant B |
|---|---|---|---|
| Quadrant D | 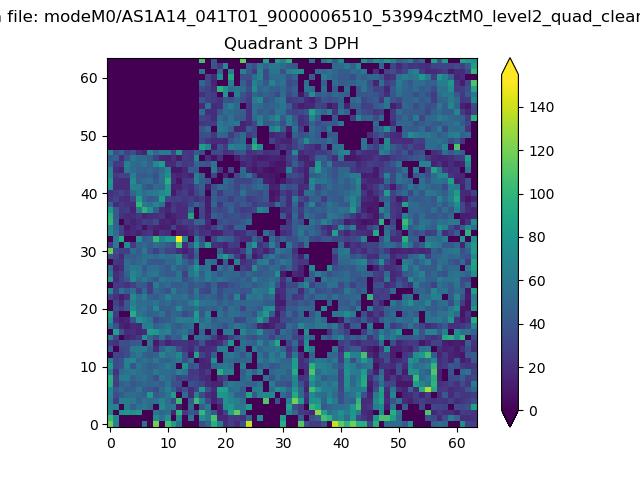 |
 |
Quadrant C |
| Plot type | Count rate plots | Images |
|---|---|---|
| Comparison with Poisson distribution Blue bars denote a histogram of data divided into 1 sec bins. Red curve is a Poisson curve with rate = median count rate of data. |
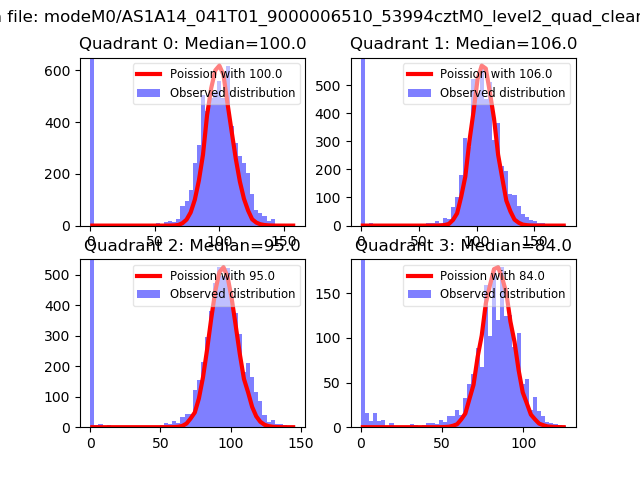 |
 |
| Quadrant-wise count rates Data is divided into 100 sec bins |
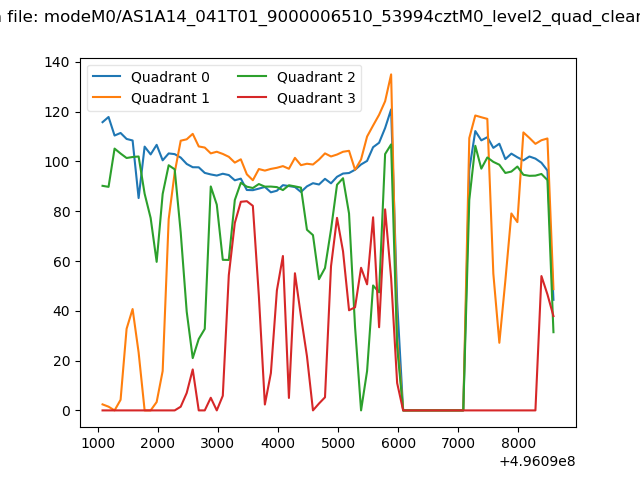 |
|
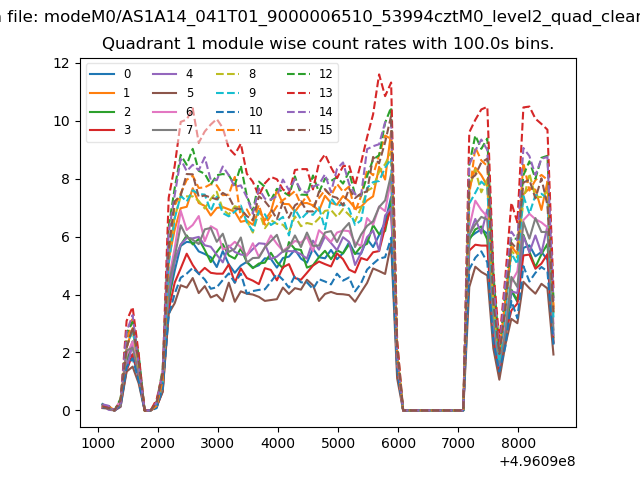
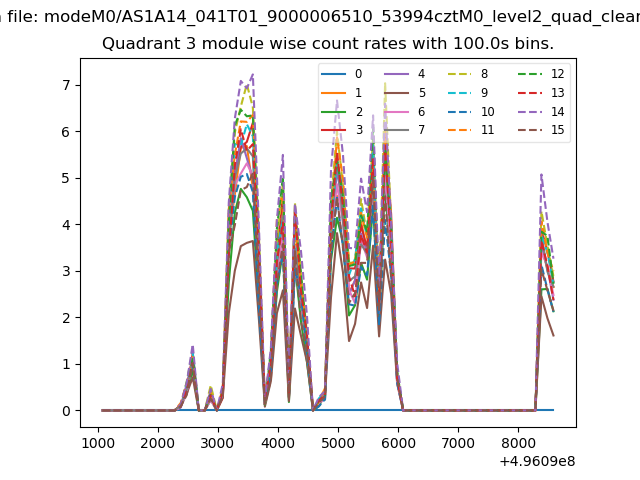
| Module-wise count rates for Quadrant A Data is divided into 100 sec bins |
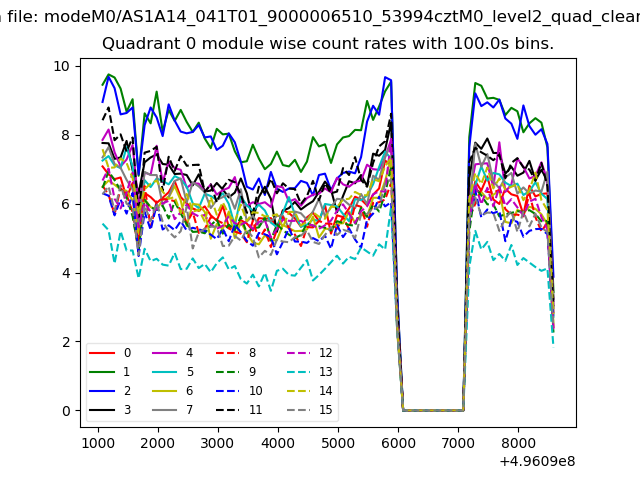 |
 |
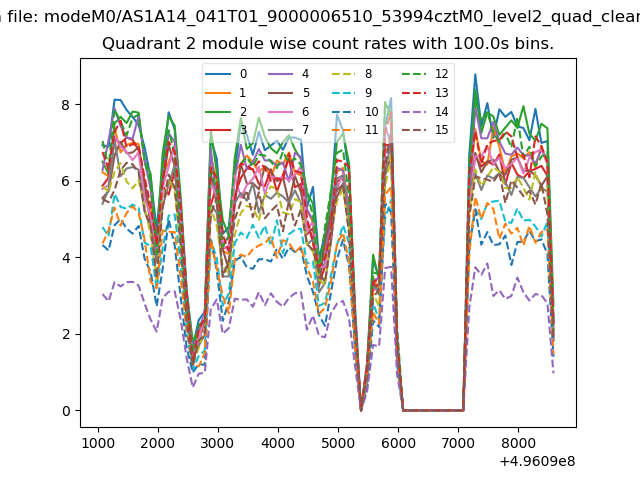
| Module-wise count rates for Quadrant B Data is divided into 100 sec bins |
 |
 |
| Module-wise count rates for Quadrant C Data is divided into 100 sec bins |
 |
 |
| Module-wise count rates for Quadrant D Data is divided into 100 sec bins |
 |
 |
| Parameter | Plot |
|---|---|
| CZT HV Monitor | 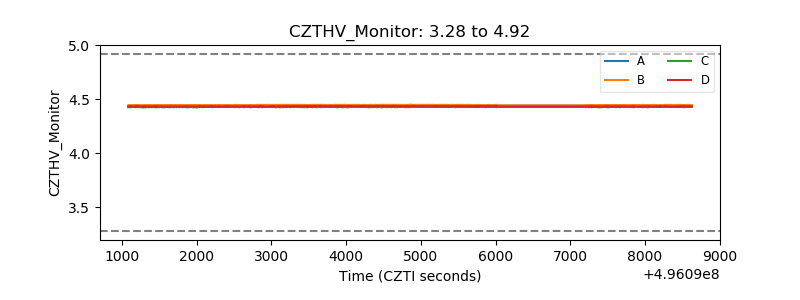 |
| D_VDD | 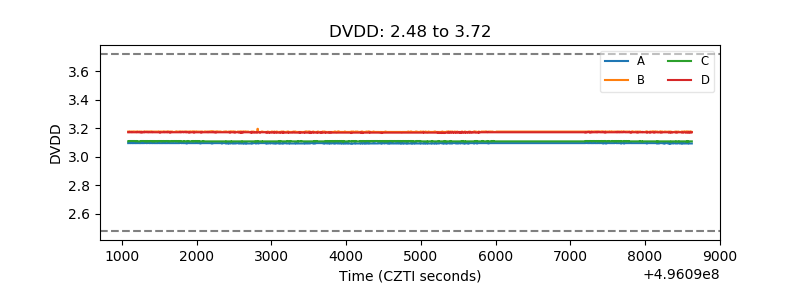 |
| Temperature 1 | 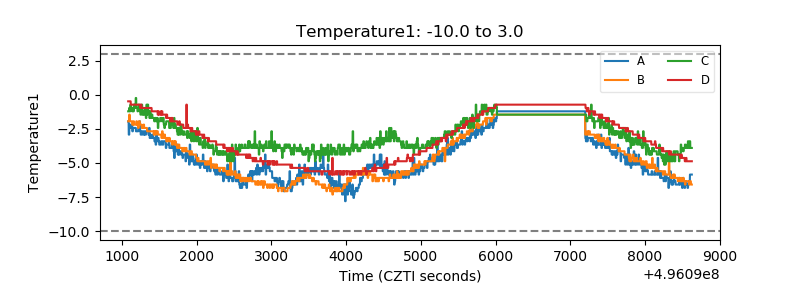 |
| Veto HV Monitor | 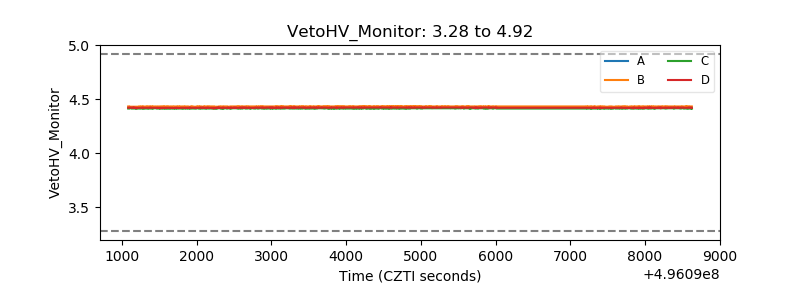 |
| Veto LLD | 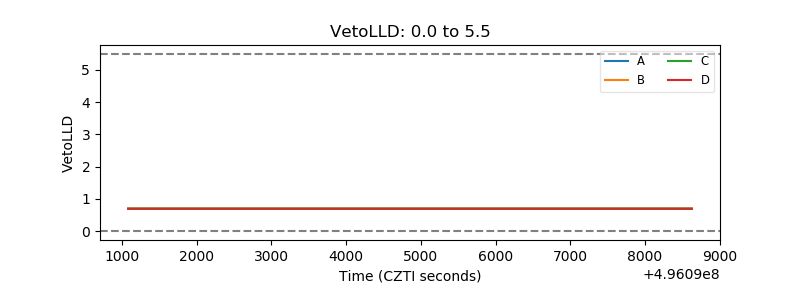 |
| Alpha Counter | 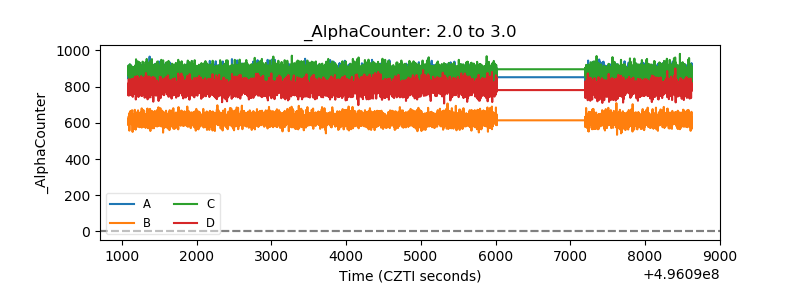 |
| _CPM_Rate | 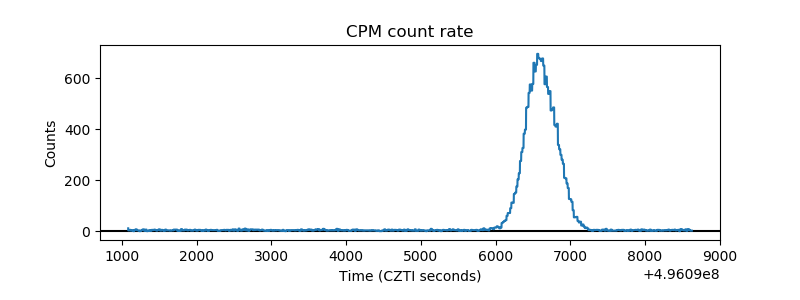 |
| CZT Counter | 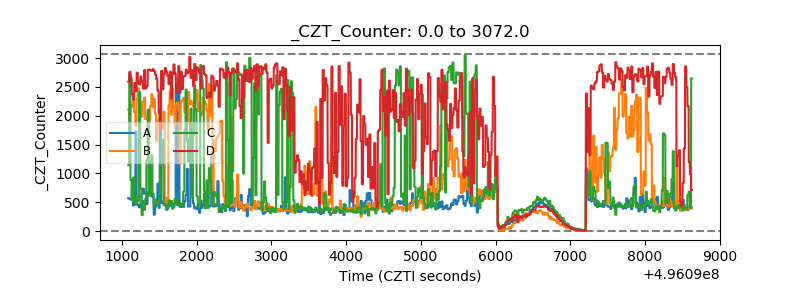 |
| +2.5 Volts monitor |  |
| +5 Volts monitor |  |
| _ROLL_ROT | 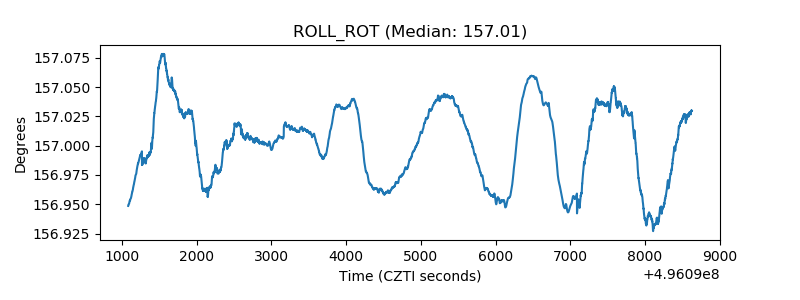 |
| _Roll_DEC | 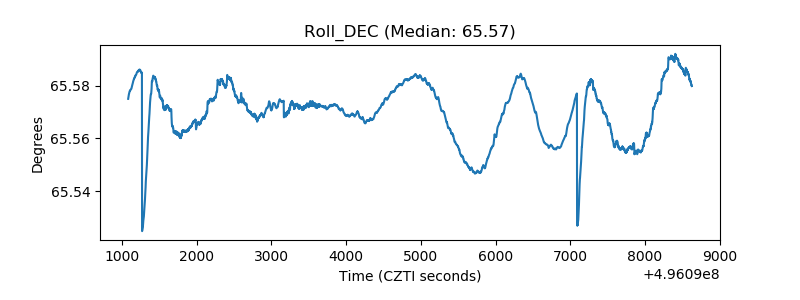 |
| _Roll_RA | 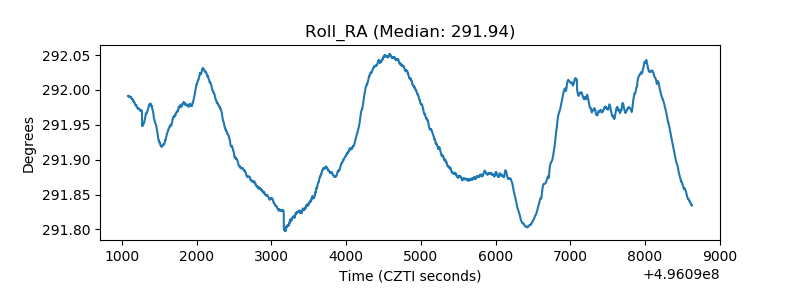 |
| Veto Counter | 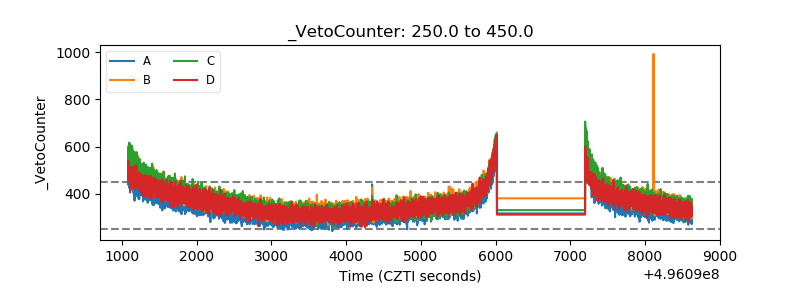 |