| Param | Original file | Final file |
|---|---|---|
| Filename | modeM0/AS1A14_041T01_9000006510_53995cztM0_level2.fits | modeM0/AS1A14_041T01_9000006510_53995cztM0_level2_quad_clean.evt |
| Size (bytes) | 738,406,080 | 83,116,800 |
| Size | 704.2 MB | 79.3 MB |
| Events in quadrant A | 3,229,463 | 630,121 |
| Events in quadrant B | 6,655,026 | 612,273 |
| Events in quadrant C | 4,202,203 | 582,210 |
| Events in quadrant D | 12,738,020 | 235,003 |
| Mode M9 | |||
|---|---|---|---|
| Quadrant | BADHDUFLAG | Total packets | Discarded packets |
| A | 0 | 11 | 0 |
| B | 0 | 11 | 0 |
| C | 0 | 11 | 0 |
| D | 0 | 11 | 0 |
| Mode SS | |||
|---|---|---|---|
| Quadrant | BADHDUFLAG | Total packets | Discarded packets |
| A | 0 | 132 | 0 |
| B | 0 | 132 | 0 |
| C | 0 | 132 | 0 |
| D | 0 | 132 | 0 |
| Mode M0 | |||
|---|---|---|---|
| Quadrant | BADHDUFLAG | Total packets | Discarded packets |
| A | 0 | 14540 | 2 |
| B | 0 | 24466 | 2 |
| C | 0 | 17439 | 2 |
| D | 0 | 42416 | 7 |
| Quadrant | Total seconds | Saturated seconds | Saturation percentage |
|---|---|---|---|
| A | 6554 | 115 | 1.754654% |
| B | 6554 | 1113 | 16.981996% |
| C | 6554 | 344 | 5.248703% |
| D | 6554 | 4031 | 61.504425% |
Noise dominated data is calculated using 1-second bins in cleaned event files. If a bin has >2000 counts, and if more than 50% of those come from <1% of pixels, then it is considered to be noise-dominated and hence unusable.
| Quadrant | # 1 sec bins | Bins with >0 counts | Bins with >2000 counts | High rate bins dominated by noise | Noise dominated (total time) | Noise dominated (detector-on time) | Marked lightcurve |
|---|---|---|---|---|---|---|---|
| A | 7624 | 6555 | 79 | 79 | 1.04% | 1.21% | 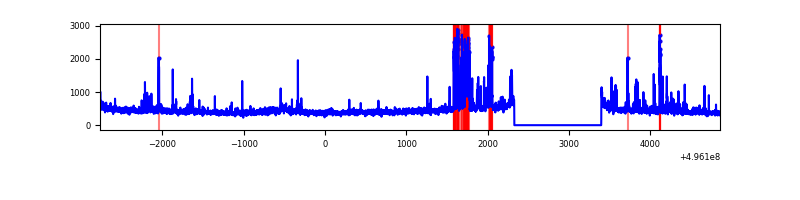 |
| B | 7624 | 6554 | 706 | 706 | 9.26% | 10.77% | 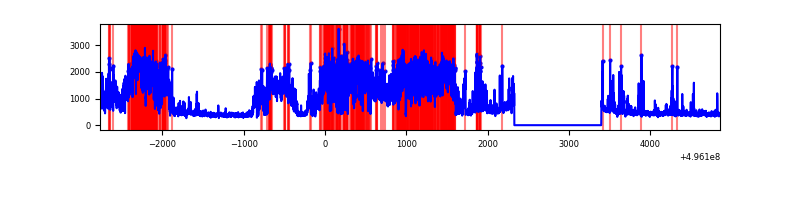 |
| C | 7624 | 6555 | 336 | 336 | 4.41% | 5.13% | 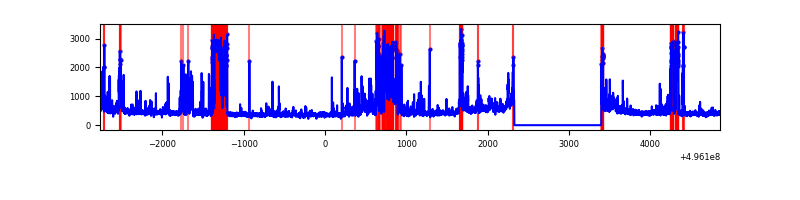 |
| D | 7623 | 6554 | 3621 | 3621 | 47.50% | 55.25% | 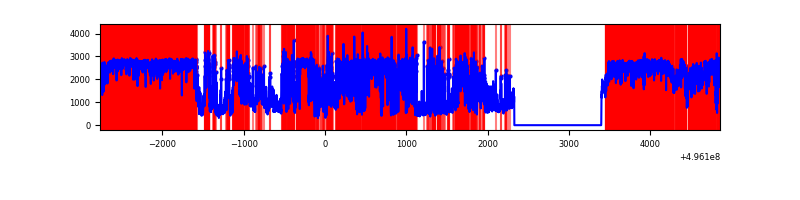 |
Top three noisy pixels from each quadrant. If the there are fewer than three noisy pixels in the level2.evt file, extra rows are filled as -1
| Pixel properties | Quadrant properties | ||||||
|---|---|---|---|---|---|---|---|
| Quadrant | DetID | PixID | Counts | Sigma | Mean | Median | Sigma |
| A | 15 | 174 | 340112 | 2011.64 | 677 | 659 | 168.7 |
| A | 4 | 249 | 102766 | 605.1 | 677 | 659 | 168.7 |
| A | 4 | 3 | 60646 | 355.49 | 677 | 659 | 168.7 |
| B | 4 | 81 | 3439275 | 24730.4 | 655 | 633 | 139.0 |
| B | 0 | 213 | 333303 | 2392.53 | 655 | 633 | 139.0 |
| B | 2 | 249 | 116478 | 833.15 | 655 | 633 | 139.0 |
| C | 1 | 241 | 619801 | 3421.56 | 657 | 651 | 181.0 |
| C | 10 | 171 | 557998 | 3080.03 | 657 | 651 | 181.0 |
| C | 12 | 249 | 130409 | 717.07 | 657 | 651 | 181.0 |
| D | 8 | 176 | 9467616 | 88020.38 | 374 | 356 | 107.6 |
| D | 2 | 165 | 1171603 | 10889.49 | 374 | 356 | 107.6 |
| D | 5 | 113 | 196414 | 1822.82 | 374 | 356 | 107.6 |
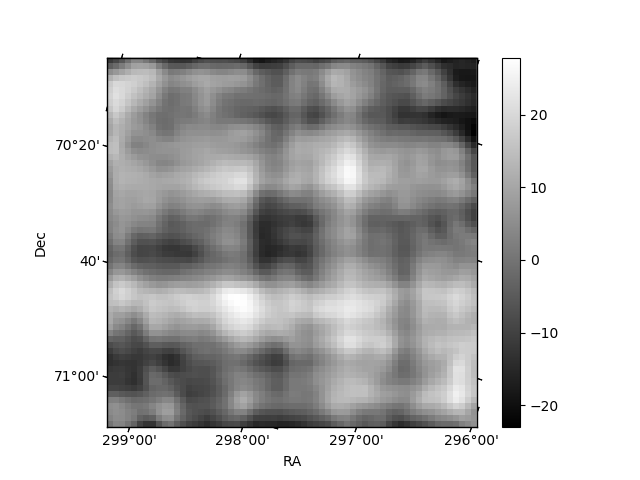
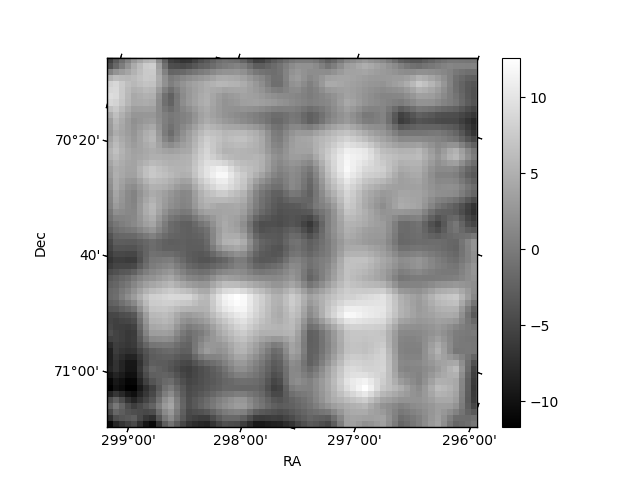
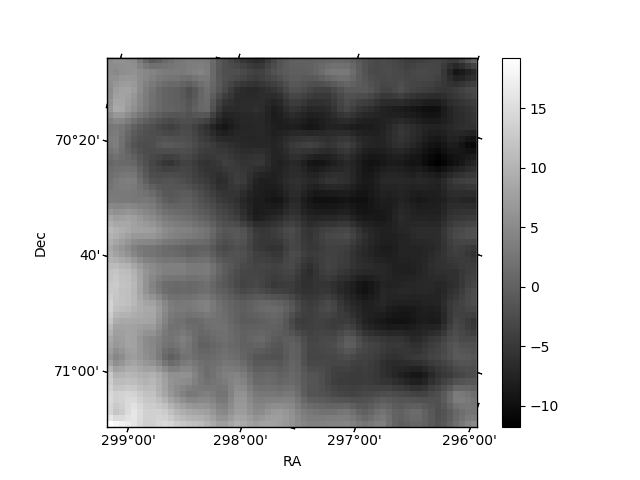
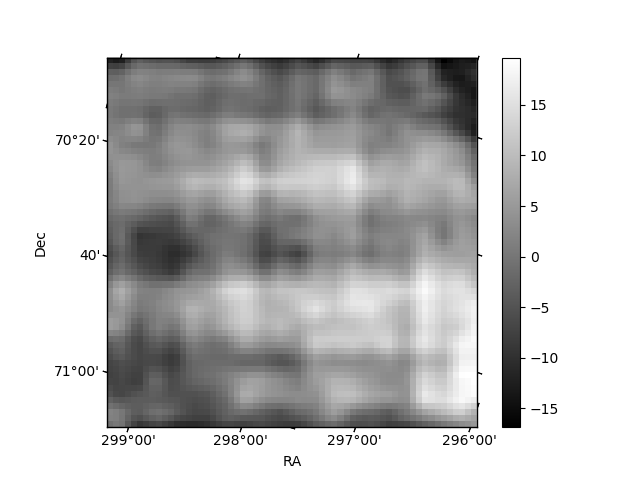
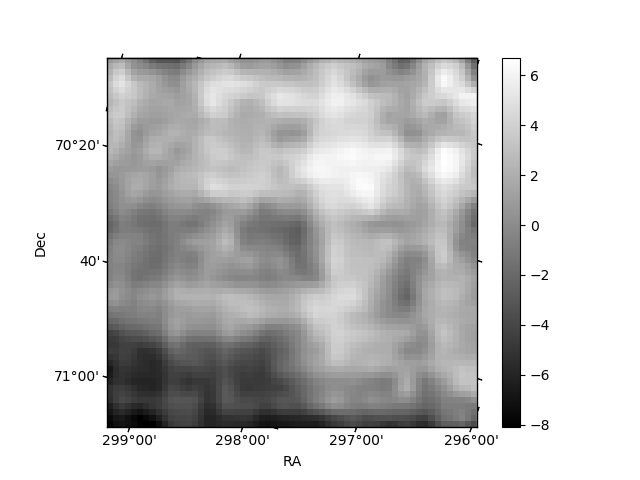
Histogram calculated using DETX and DETY for each event in the final _common_clean file
| Quadrant A | 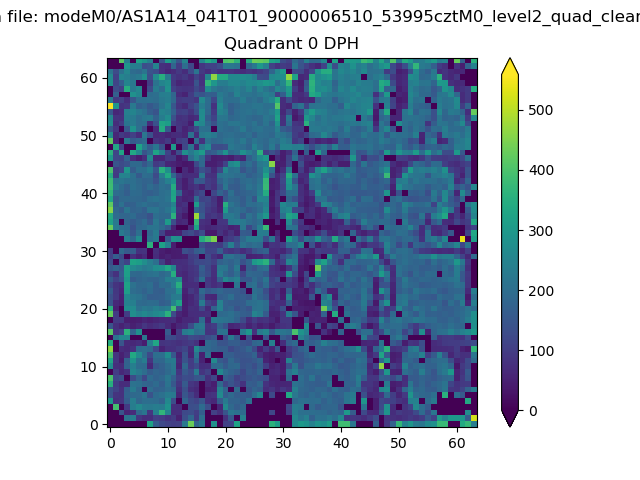 |
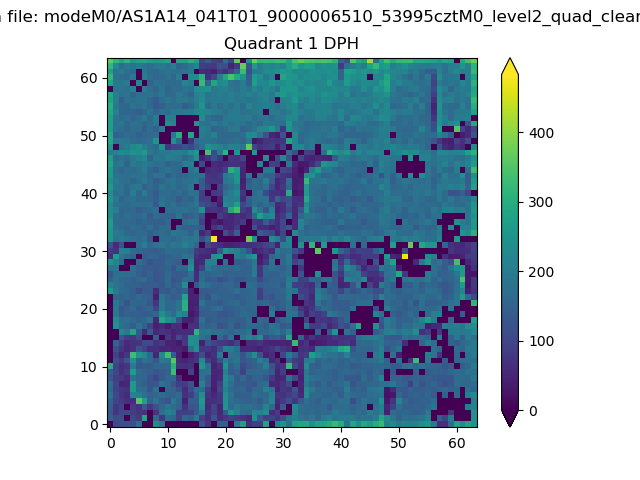 |
Quadrant B |
|---|---|---|---|
| Quadrant D | 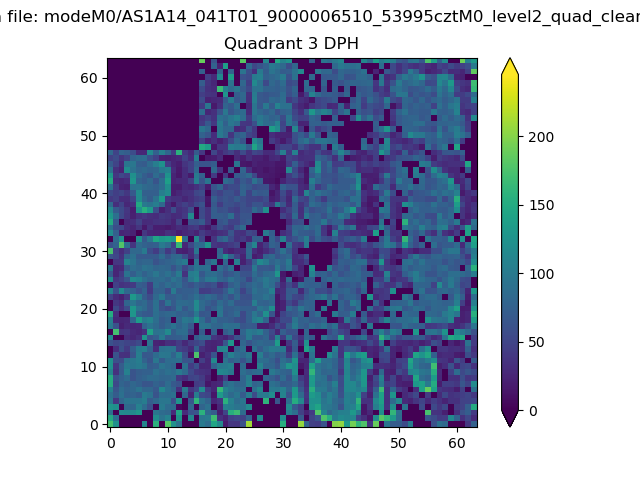 |
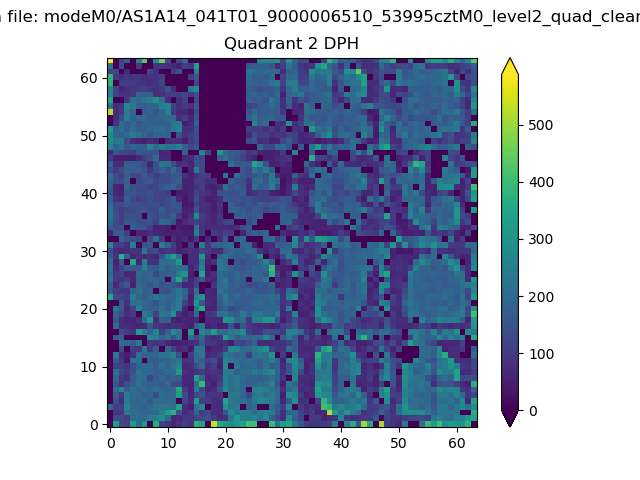 |
Quadrant C |
| Plot type | Count rate plots | Images |
|---|---|---|
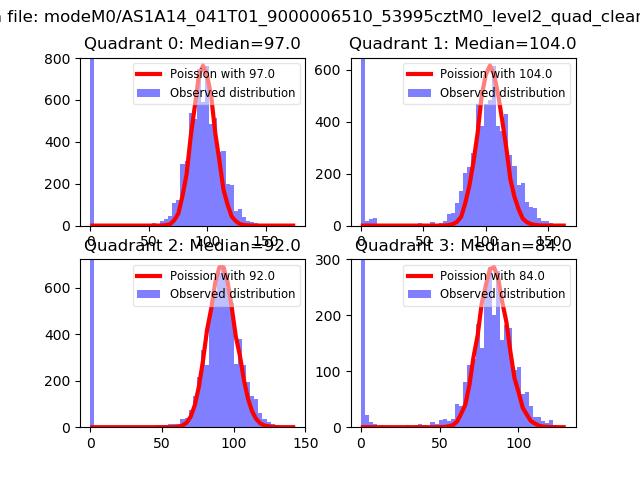
| Comparison with Poisson distribution Blue bars denote a histogram of data divided into 1 sec bins. Red curve is a Poisson curve with rate = median count rate of data. |
 |
 |
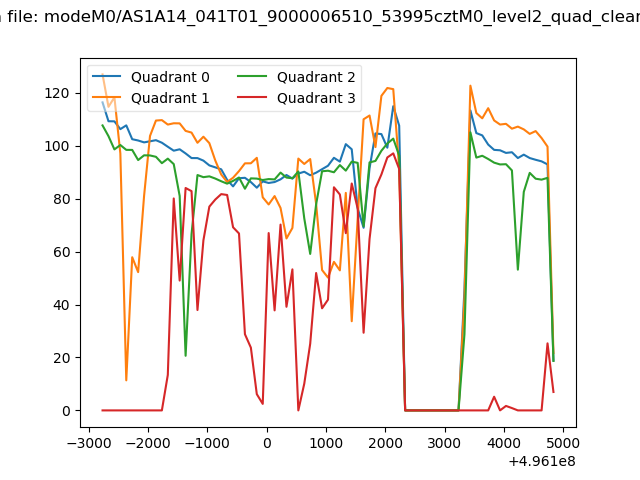
| Quadrant-wise count rates Data is divided into 100 sec bins |
 |
|
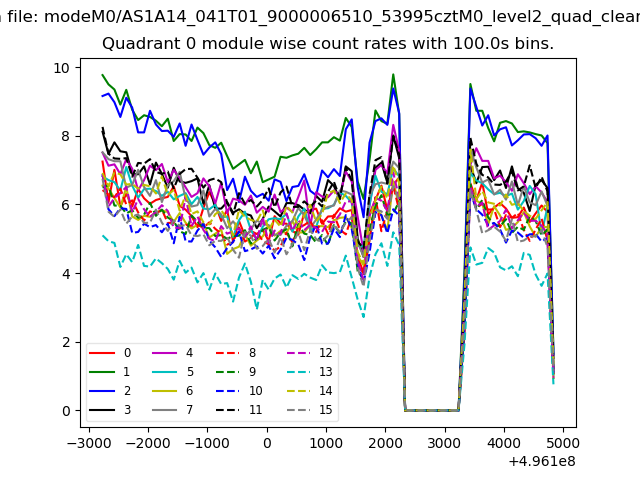
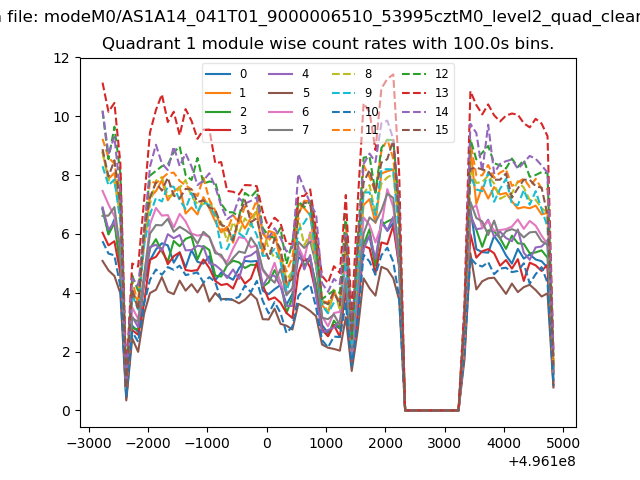
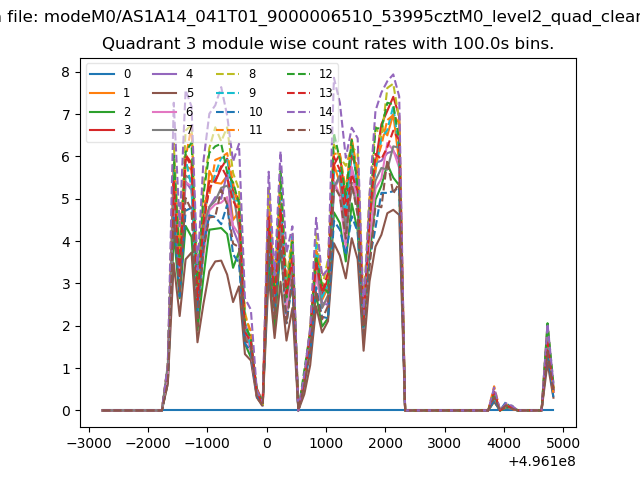
| Module-wise count rates for Quadrant A Data is divided into 100 sec bins |
 |
 |
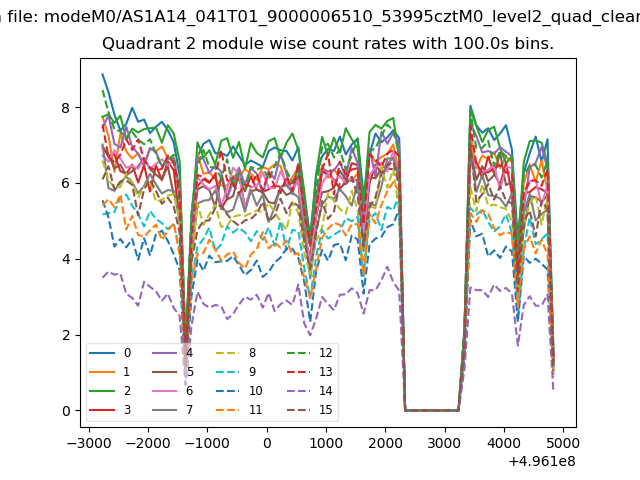
| Module-wise count rates for Quadrant B Data is divided into 100 sec bins |
 |
 |
| Module-wise count rates for Quadrant C Data is divided into 100 sec bins |
 |
 |
| Module-wise count rates for Quadrant D Data is divided into 100 sec bins |
 |
 |
| Parameter | Plot |
|---|---|
| CZT HV Monitor | 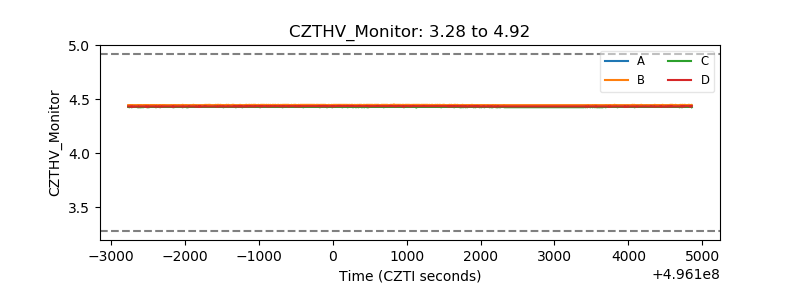 |
| D_VDD | 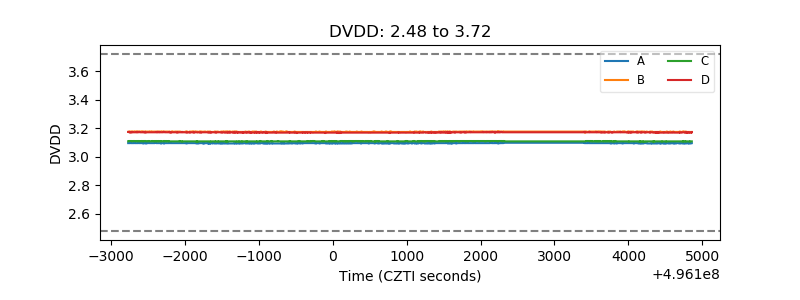 |
| Temperature 1 | 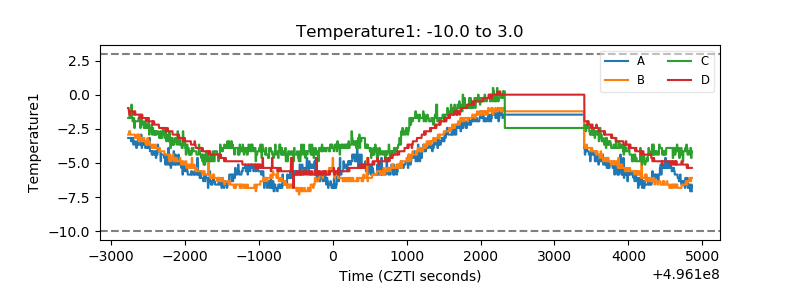 |
| Veto HV Monitor | 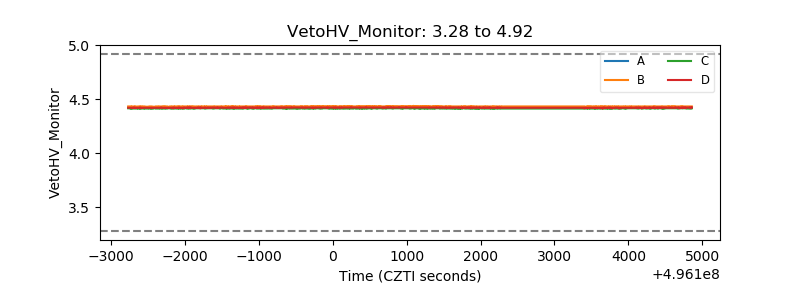 |
| Veto LLD | 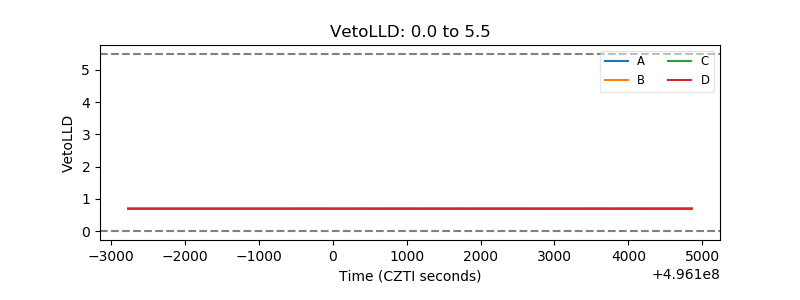 |
| Alpha Counter | 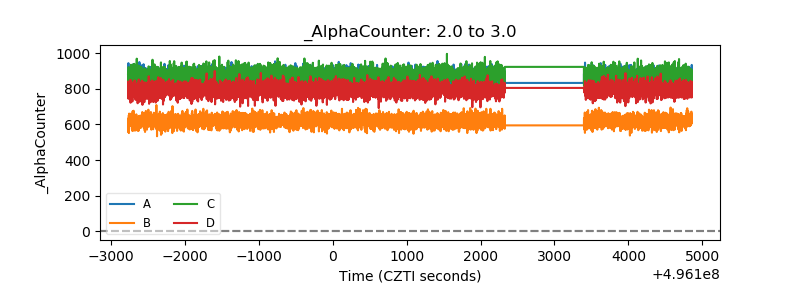 |
| _CPM_Rate | 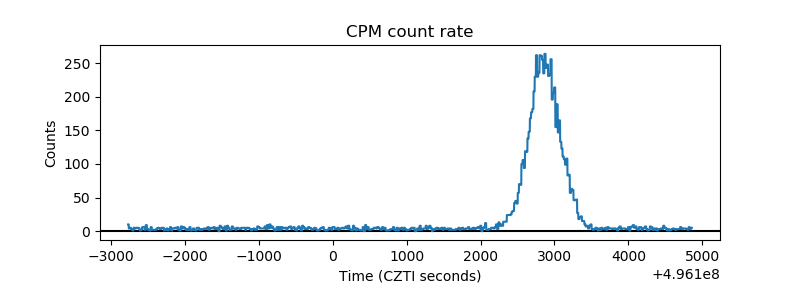 |
| CZT Counter | 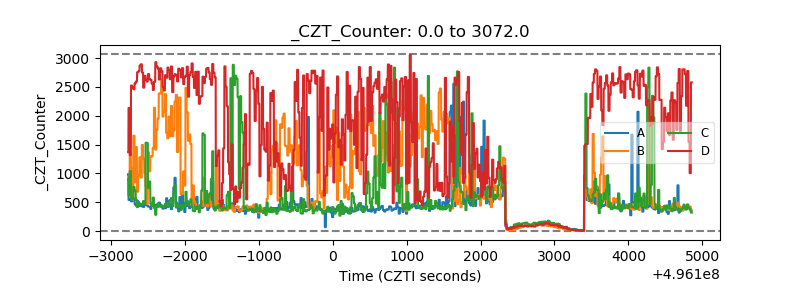 |
| +2.5 Volts monitor |  |
| +5 Volts monitor |  |
| _ROLL_ROT | 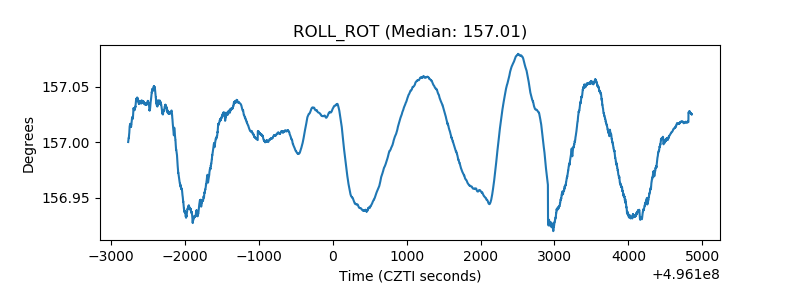 |
| _Roll_DEC | 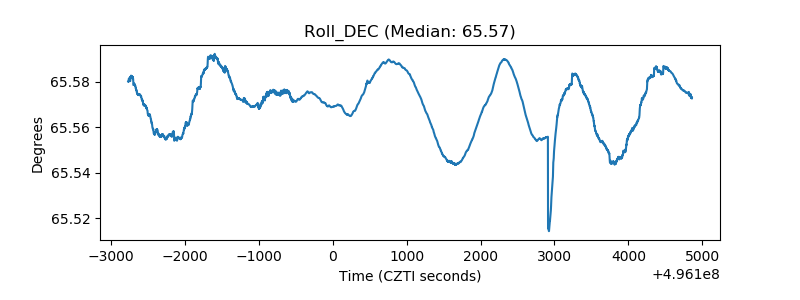 |
| _Roll_RA | 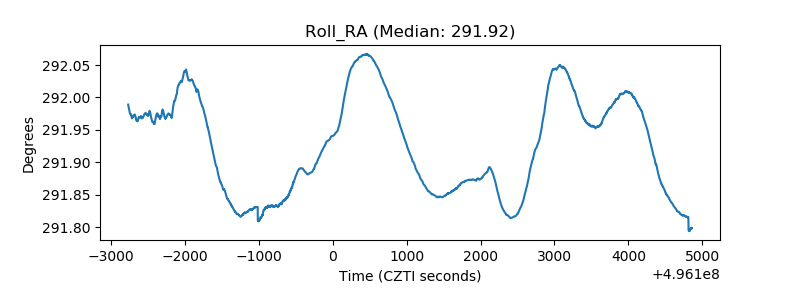 |
| Veto Counter | 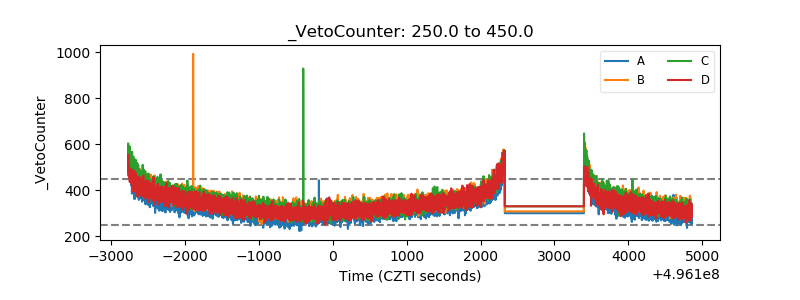 |