| Param | Original file | Final file |
|---|---|---|
| Filename | modeM0/AS1A14_041T01_9000006510_53998cztM0_level2.fits | modeM0/AS1A14_041T01_9000006510_53998cztM0_level2_quad_clean.evt |
| Size (bytes) | 647,089,920 | 105,048,000 |
| Size | 617.1 MB | 100.2 MB |
| Events in quadrant A | 3,720,261 | 701,895 |
| Events in quadrant B | 3,787,178 | 777,734 |
| Events in quadrant C | 7,725,804 | 651,970 |
| Events in quadrant D | 8,122,410 | 512,930 |
| Mode SS | |||
|---|---|---|---|
| Quadrant | BADHDUFLAG | Total packets | Discarded packets |
| A | 0 | 154 | 0 |
| B | 0 | 154 | 0 |
| C | 0 | 154 | 0 |
| D | 0 | 154 | 0 |
| Mode M0 | |||
|---|---|---|---|
| Quadrant | BADHDUFLAG | Total packets | Discarded packets |
| A | 0 | 17053 | 0 |
| B | 0 | 16963 | 0 |
| C | 0 | 28357 | 2 |
| D | 0 | 29826 | 0 |
| Quadrant | Total seconds | Saturated seconds | Saturation percentage |
|---|---|---|---|
| A | 7707 | 160 | 2.076035% |
| B | 7708 | 75 | 0.973015% |
| C | 7707 | 466 | 6.046451% |
| D | 7707 | 1592 | 20.656546% |
Noise dominated data is calculated using 1-second bins in cleaned event files. If a bin has >2000 counts, and if more than 50% of those come from <1% of pixels, then it is considered to be noise-dominated and hence unusable.
| Quadrant | # 1 sec bins | Bins with >0 counts | Bins with >2000 counts | High rate bins dominated by noise | Noise dominated (total time) | Noise dominated (detector-on time) | Marked lightcurve |
|---|---|---|---|---|---|---|---|
| A | 7707 | 7707 | 147 | 147 | 1.91% | 1.91% |  |
| B | 7708 | 7708 | 40 | 40 | 0.52% | 0.52% |  |
| C | 7707 | 7707 | 515 | 515 | 6.68% | 6.68% |  |
| D | 7707 | 7707 | 1615 | 1615 | 20.95% | 20.95% |  |
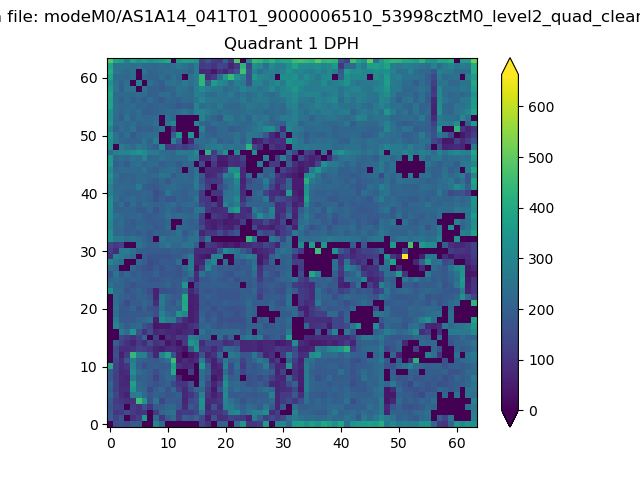
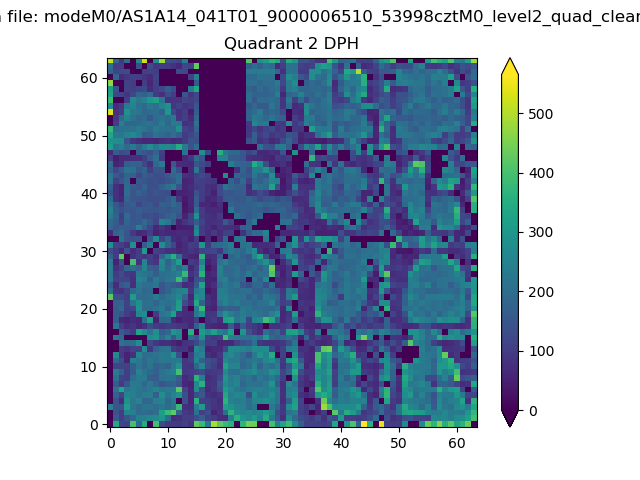
Top three noisy pixels from each quadrant. If the there are fewer than three noisy pixels in the level2.evt file, extra rows are filled as -1
| Pixel properties | Quadrant properties | ||||||
|---|---|---|---|---|---|---|---|
| Quadrant | DetID | PixID | Counts | Sigma | Mean | Median | Sigma |
| A | 15 | 174 | 516836 | 2665.72 | 782 | 761 | 193.6 |
| A | 4 | 249 | 46142 | 234.41 | 782 | 761 | 193.6 |
| A | 0 | 8 | 27755 | 139.43 | 782 | 761 | 193.6 |
| B | 0 | 213 | 251119 | 1475.72 | 793 | 763 | 169.7 |
| B | 7 | 0 | 193044 | 1133.4 | 793 | 763 | 169.7 |
| B | 4 | 81 | 44903 | 260.18 | 793 | 763 | 169.7 |
| C | 10 | 171 | 2722441 | 13056.68 | 761 | 755 | 208.5 |
| C | 14 | 80 | 780575 | 3741.01 | 761 | 755 | 208.5 |
| C | 1 | 241 | 561444 | 2689.78 | 761 | 755 | 208.5 |
| D | 8 | 176 | 3877039 | 20054.05 | 676 | 646 | 193.3 |
| D | 2 | 165 | 662287 | 3422.92 | 676 | 646 | 193.3 |
| D | 6 | 239 | 354889 | 1832.63 | 676 | 646 | 193.3 |
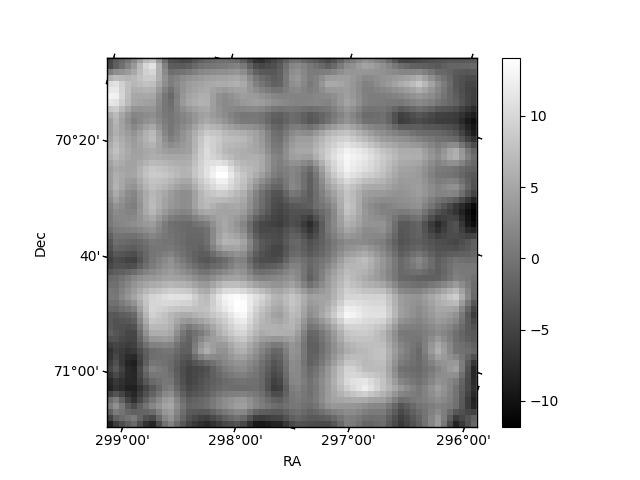
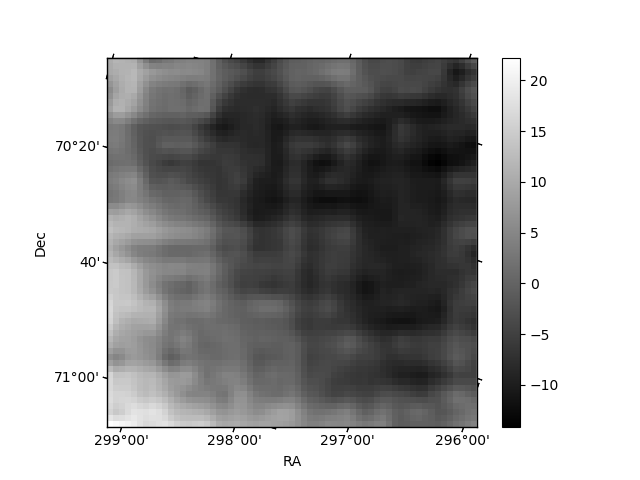
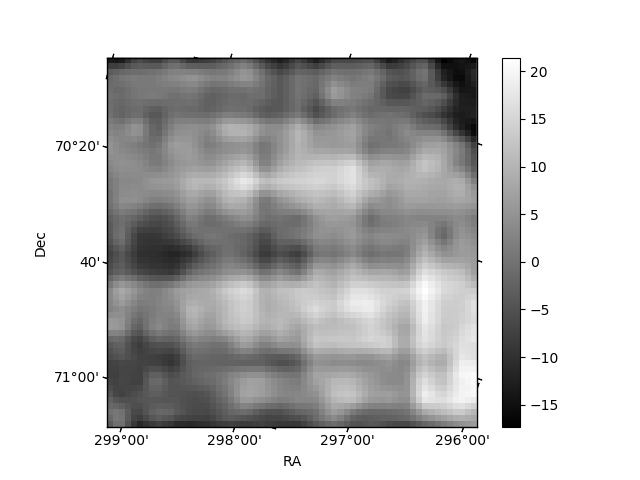
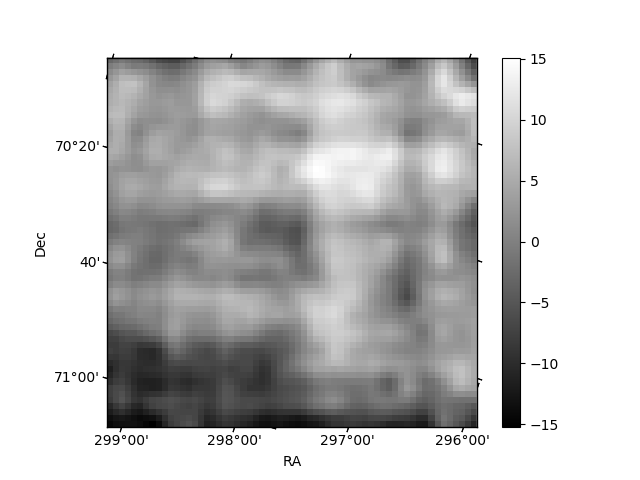
Histogram calculated using DETX and DETY for each event in the final _common_clean file
| Quadrant A | 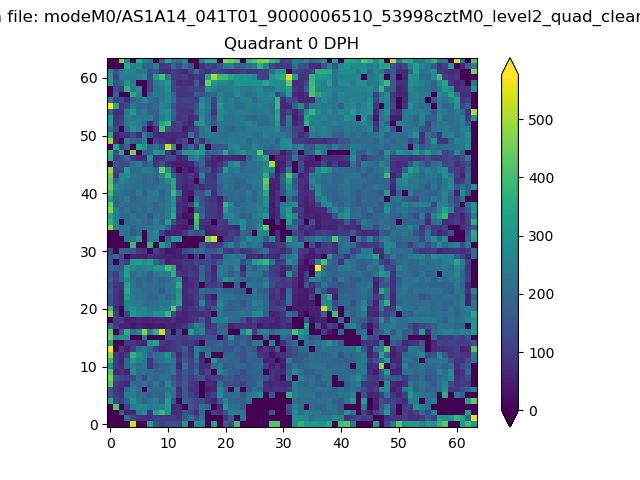 |
 |
Quadrant B |
|---|---|---|---|
| Quadrant D | 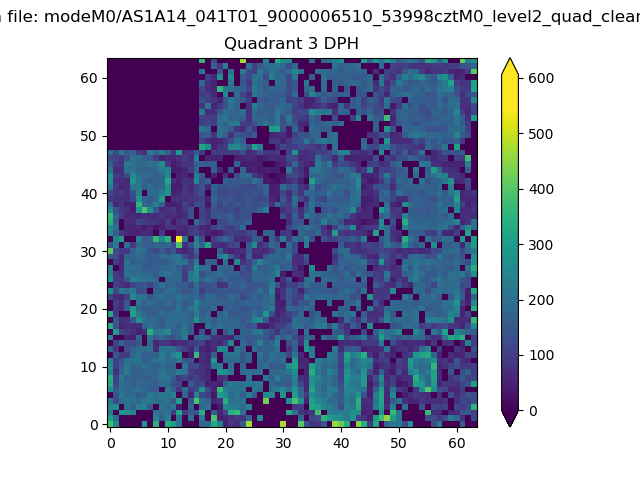 |
 |
Quadrant C |
| Plot type | Count rate plots | Images |
|---|---|---|
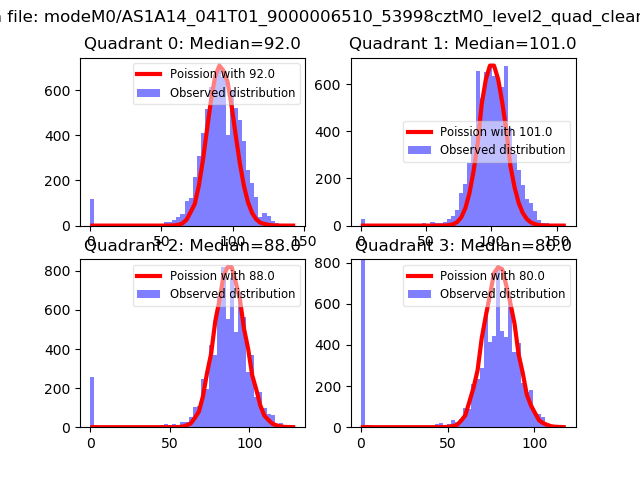
| Comparison with Poisson distribution Blue bars denote a histogram of data divided into 1 sec bins. Red curve is a Poisson curve with rate = median count rate of data. |
 |
 |
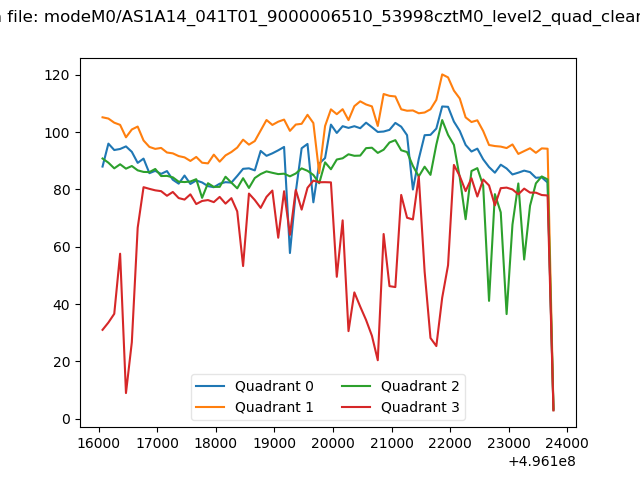
| Quadrant-wise count rates Data is divided into 100 sec bins |
 |
|
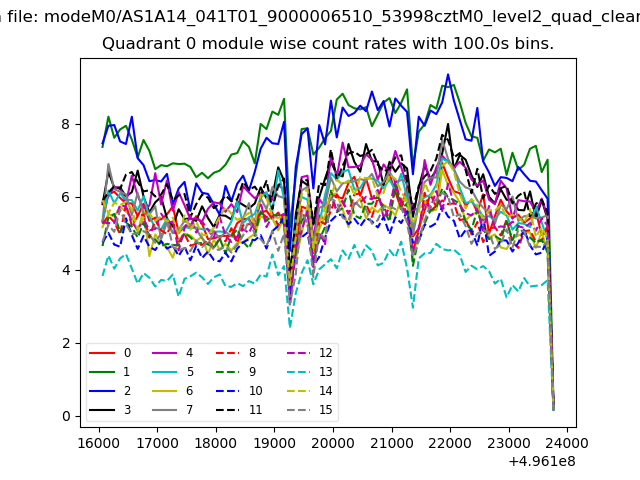
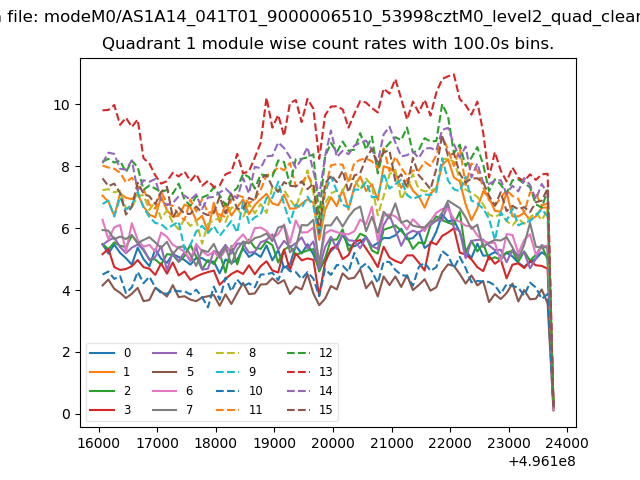
| Module-wise count rates for Quadrant A Data is divided into 100 sec bins |
 |
 |
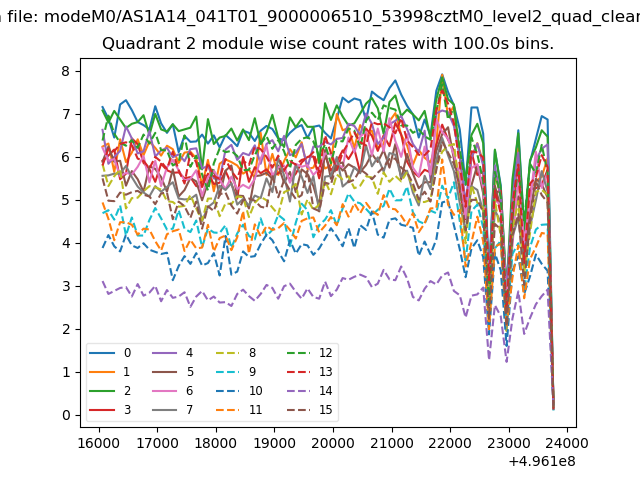
| Module-wise count rates for Quadrant B Data is divided into 100 sec bins |
 |
 |
| Module-wise count rates for Quadrant C Data is divided into 100 sec bins |
 |
 |
| Module-wise count rates for Quadrant D Data is divided into 100 sec bins |
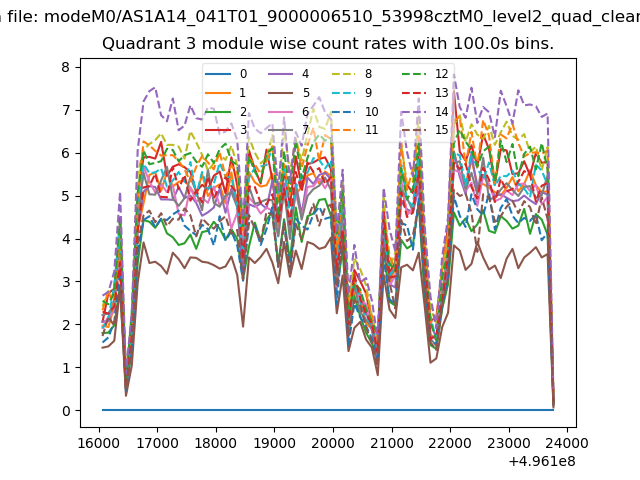 |
 |
| Parameter | Plot |
|---|---|
| CZT HV Monitor | 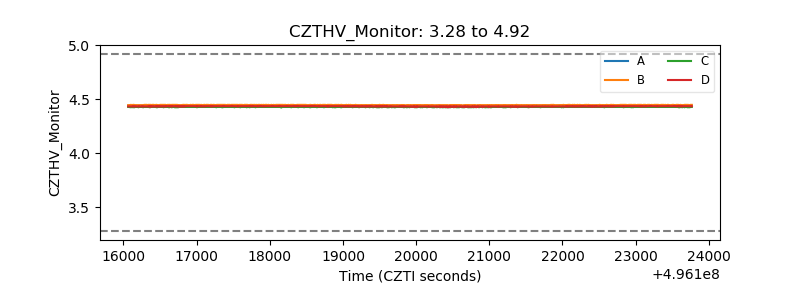 |
| D_VDD | 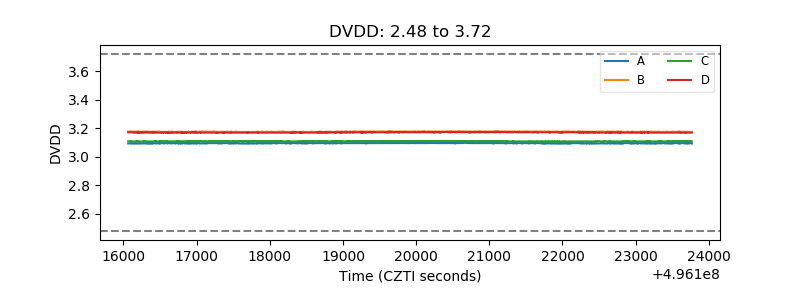 |
| Temperature 1 | 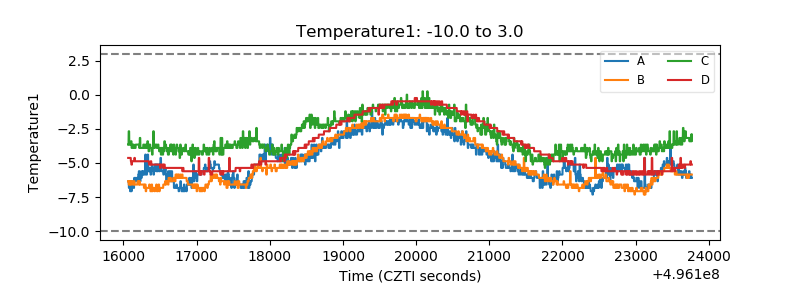 |
| Veto HV Monitor | 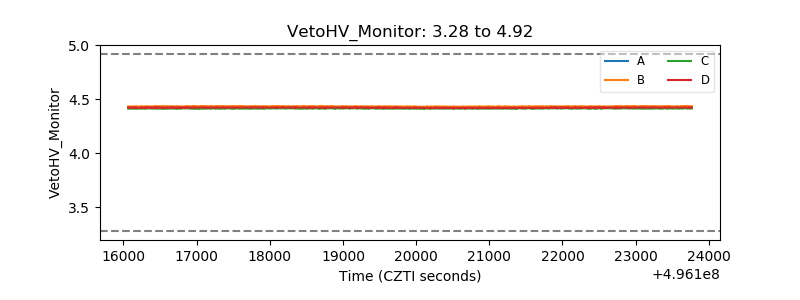 |
| Veto LLD | 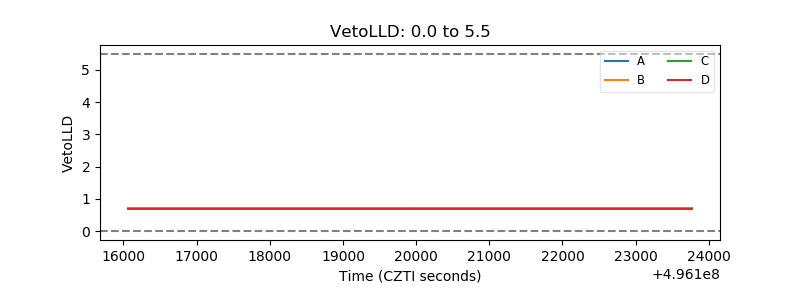 |
| Alpha Counter | 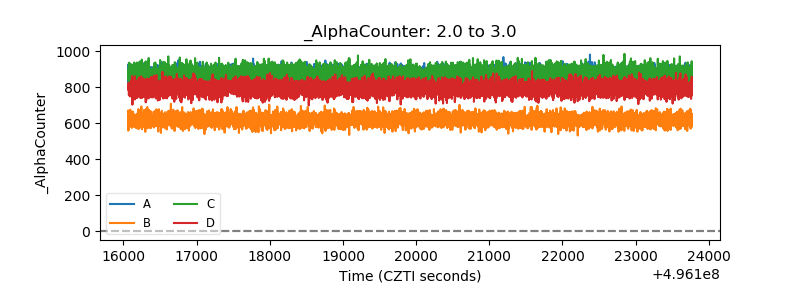 |
| _CPM_Rate | 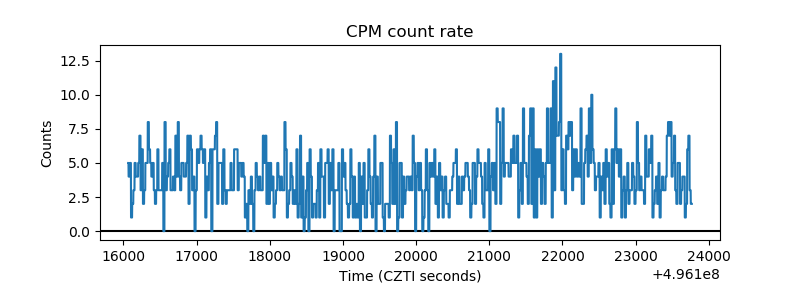 |
| CZT Counter | 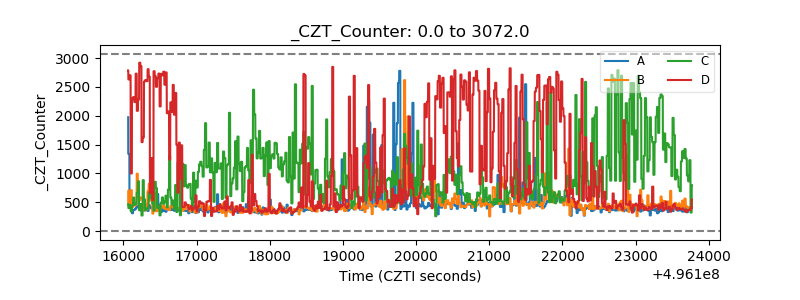 |
| +2.5 Volts monitor |  |
| +5 Volts monitor |  |
| _ROLL_ROT | 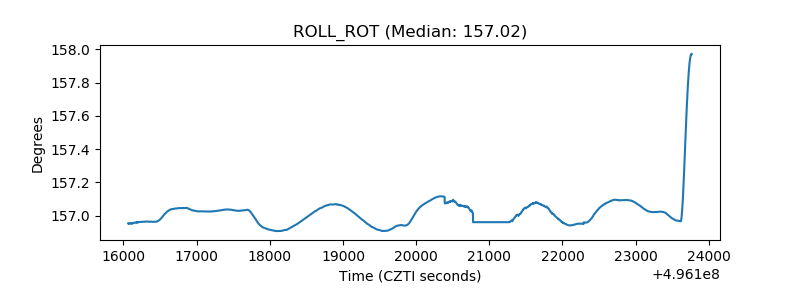 |
| _Roll_DEC | 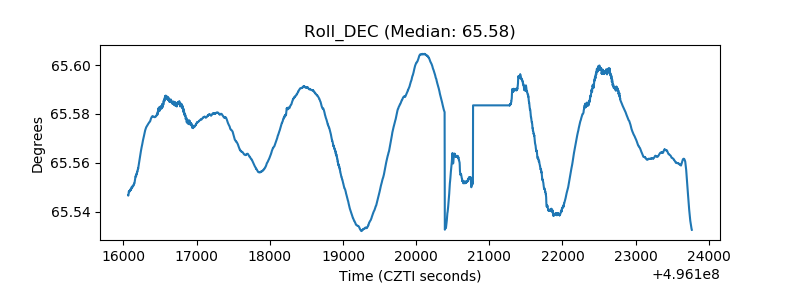 |
| _Roll_RA | 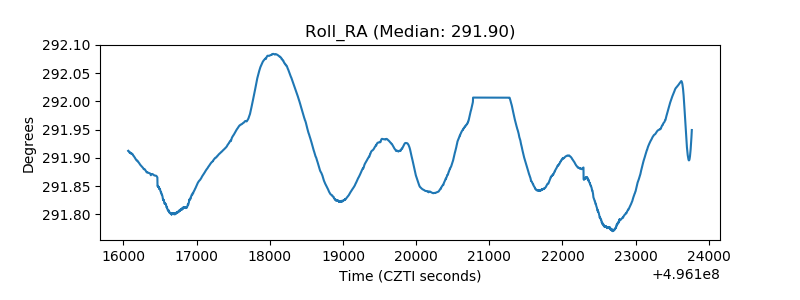 |
| Veto Counter | 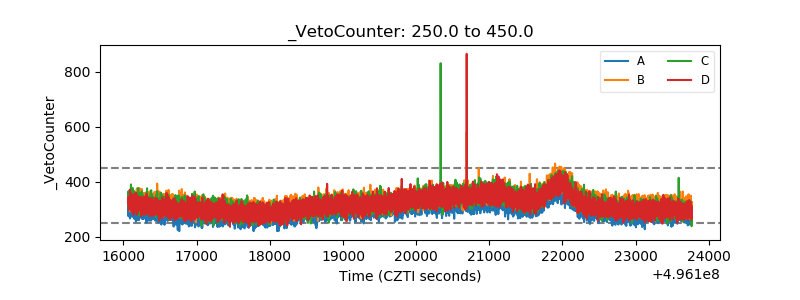 |