| Param | Original file | Final file |
|---|---|---|
| Filename | modeM0/AS1A14_041T01_9000006510_53999cztM0_level2.fits | modeM0/AS1A14_041T01_9000006510_53999cztM0_level2_quad_clean.evt |
| Size (bytes) | 760,953,600 | 120,216,960 |
| Size | 725.7 MB | 114.6 MB |
| Events in quadrant A | 4,297,041 | 811,832 |
| Events in quadrant B | 5,241,332 | 871,990 |
| Events in quadrant C | 9,390,430 | 731,504 |
| Events in quadrant D | 8,559,006 | 614,407 |
| Mode SS | |||
|---|---|---|---|
| Quadrant | BADHDUFLAG | Total packets | Discarded packets |
| A | 0 | 176 | 0 |
| B | 0 | 176 | 0 |
| C | 0 | 176 | 0 |
| D | 0 | 176 | 0 |
| Mode M0 | |||
|---|---|---|---|
| Quadrant | BADHDUFLAG | Total packets | Discarded packets |
| A | 0 | 19246 | 0 |
| B | 0 | 21729 | 0 |
| C | 0 | 34052 | 0 |
| D | 0 | 31849 | 0 |
| Quadrant | Total seconds | Saturated seconds | Saturation percentage |
|---|---|---|---|
| A | 8784 | 105 | 1.195355% |
| B | 8785 | 365 | 4.154809% |
| C | 8785 | 848 | 9.652817% |
| D | 8784 | 1489 | 16.951275% |
Noise dominated data is calculated using 1-second bins in cleaned event files. If a bin has >2000 counts, and if more than 50% of those come from <1% of pixels, then it is considered to be noise-dominated and hence unusable.
| Quadrant | # 1 sec bins | Bins with >0 counts | Bins with >2000 counts | High rate bins dominated by noise | Noise dominated (total time) | Noise dominated (detector-on time) | Marked lightcurve |
|---|---|---|---|---|---|---|---|
| A | 8784 | 8784 | 92 | 92 | 1.05% | 1.05% | 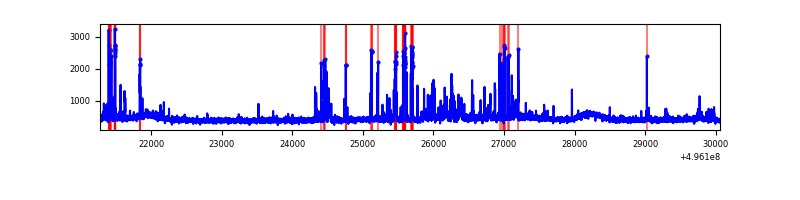 |
| B | 8785 | 8785 | 211 | 211 | 2.40% | 2.40% | 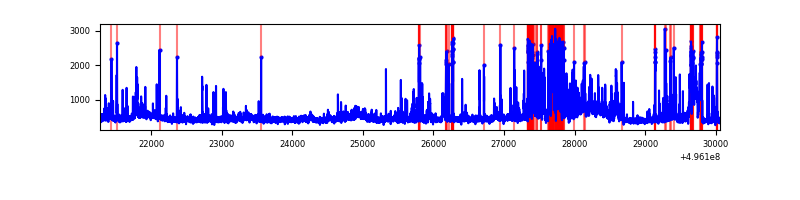 |
| C | 8785 | 8785 | 840 | 840 | 9.56% | 9.56% | 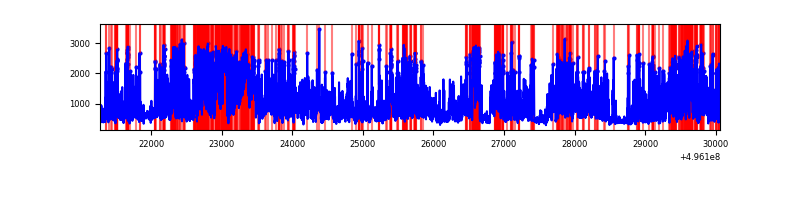 |
| D | 8784 | 8784 | 1493 | 1493 | 17.00% | 17.00% | 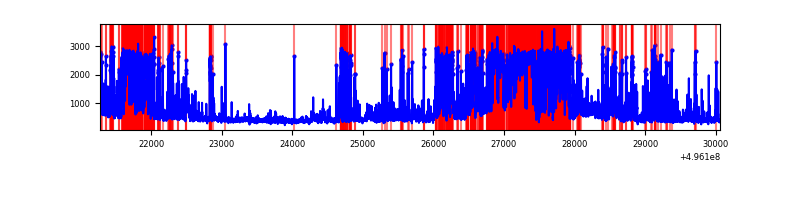 |
Top three noisy pixels from each quadrant. If the there are fewer than three noisy pixels in the level2.evt file, extra rows are filled as -1
| Pixel properties | Quadrant properties | ||||||
|---|---|---|---|---|---|---|---|
| Quadrant | DetID | PixID | Counts | Sigma | Mean | Median | Sigma |
| A | 15 | 174 | 423896 | 1859.96 | 920 | 896 | 227.4 |
| A | 0 | 8 | 96682 | 421.18 | 920 | 896 | 227.4 |
| A | 14 | 239 | 40827 | 175.58 | 920 | 896 | 227.4 |
| B | 5 | 250 | 1120663 | 5744.69 | 916 | 883 | 194.9 |
| B | 7 | 0 | 154667 | 788.94 | 916 | 883 | 194.9 |
| B | 5 | 185 | 64203 | 324.84 | 916 | 883 | 194.9 |
| C | 10 | 171 | 2956501 | 12432.96 | 876 | 869 | 237.7 |
| C | 1 | 241 | 819476 | 3443.5 | 876 | 869 | 237.7 |
| C | 14 | 80 | 800898 | 3365.35 | 876 | 869 | 237.7 |
| D | 8 | 176 | 3695811 | 16134.79 | 812 | 777 | 229.0 |
| D | 3 | 12 | 531818 | 2318.85 | 812 | 777 | 229.0 |
| D | 6 | 239 | 206643 | 898.94 | 812 | 777 | 229.0 |
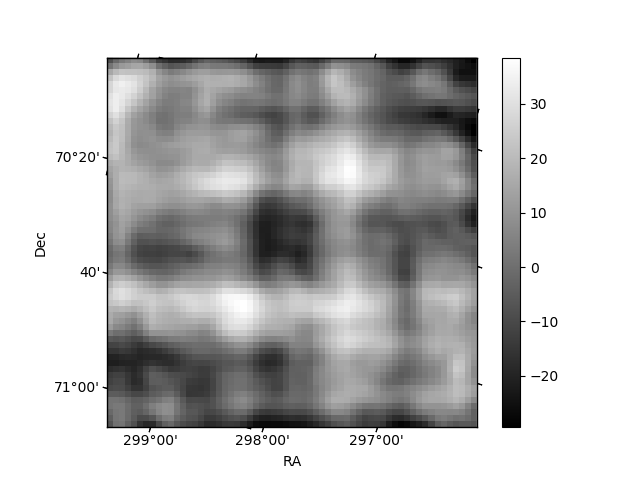
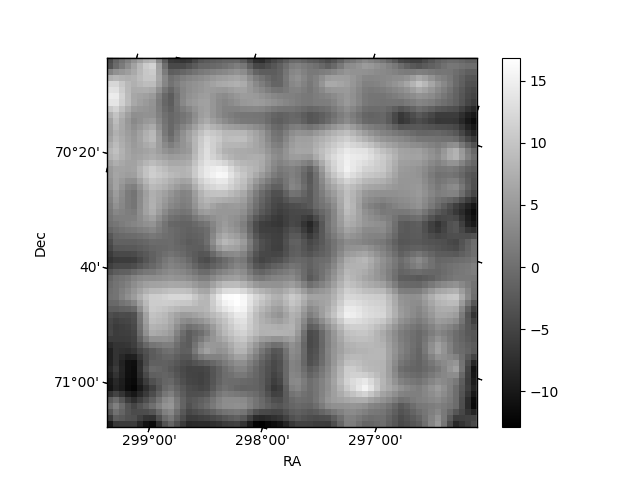
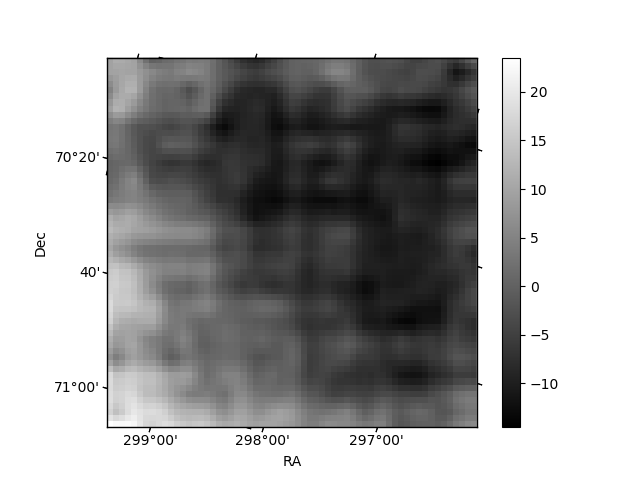
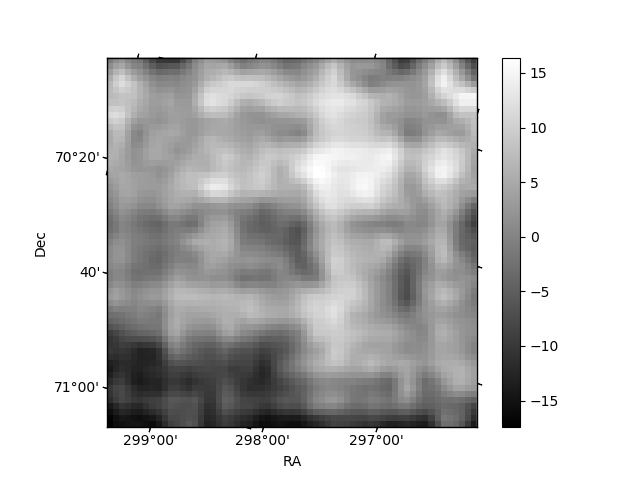
Histogram calculated using DETX and DETY for each event in the final _common_clean file
| Quadrant A | 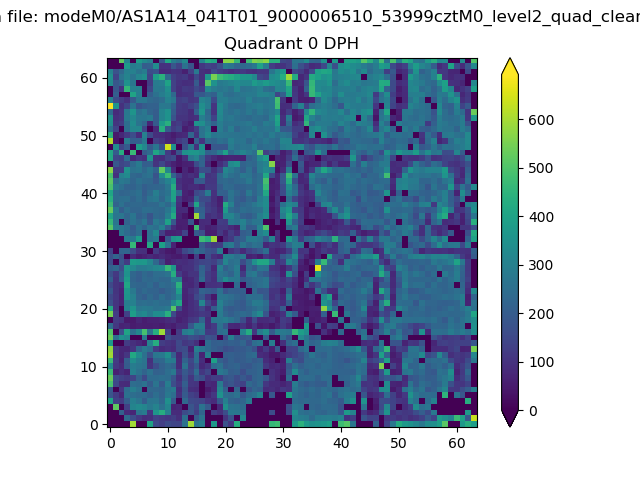 |
 |
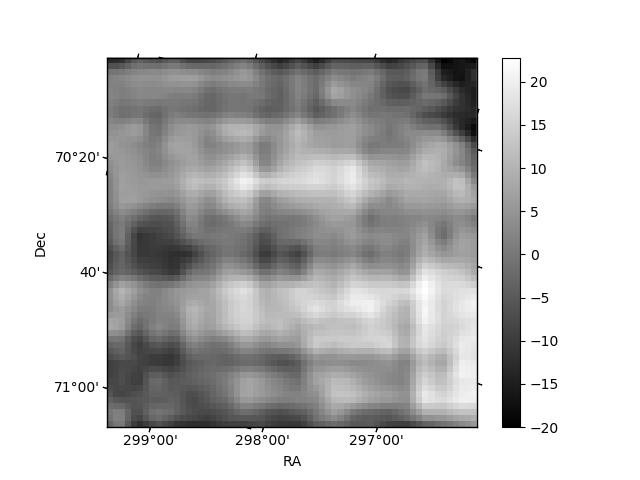
Quadrant B |
|---|---|---|---|
| Quadrant D | 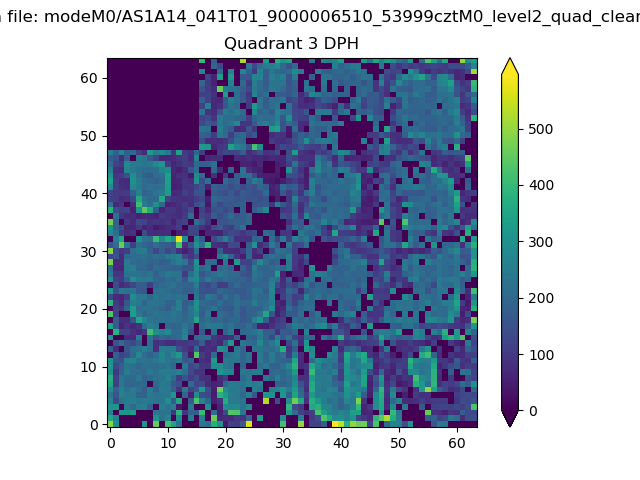 |
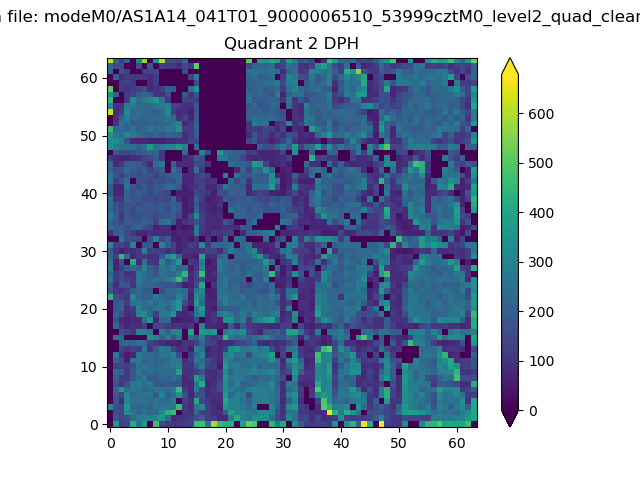 |
Quadrant C |
| Plot type | Count rate plots | Images |
|---|---|---|
| Comparison with Poisson distribution Blue bars denote a histogram of data divided into 1 sec bins. Red curve is a Poisson curve with rate = median count rate of data. |
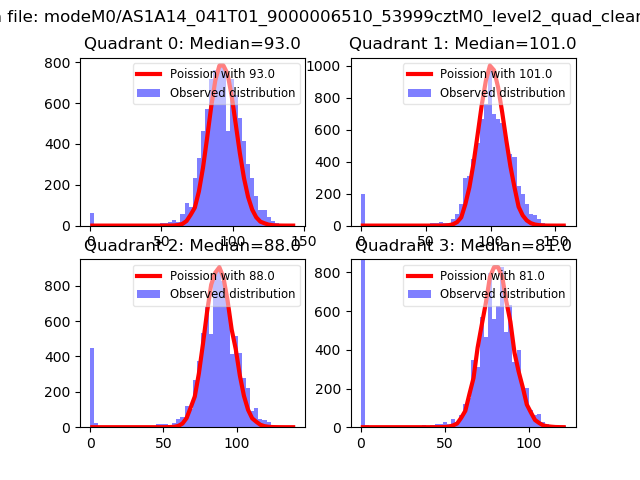 |
 |
| Quadrant-wise count rates Data is divided into 100 sec bins |
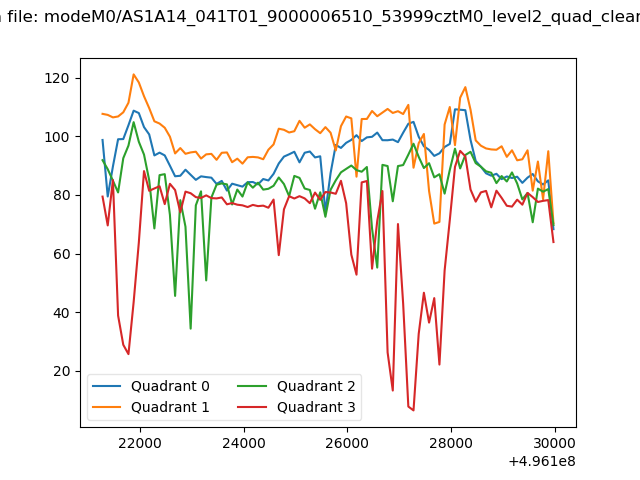 |
|
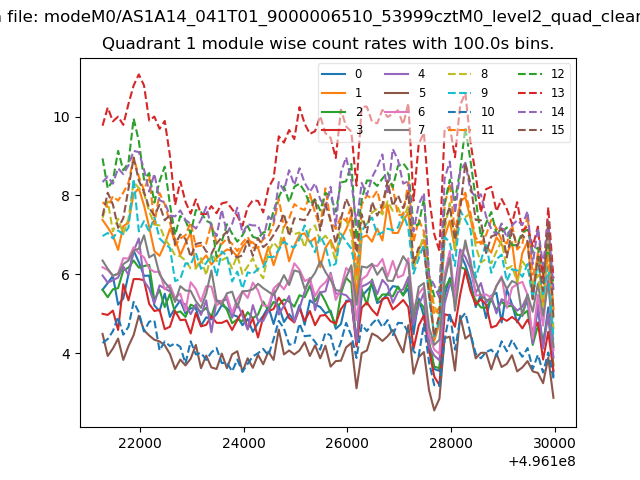
| Module-wise count rates for Quadrant A Data is divided into 100 sec bins |
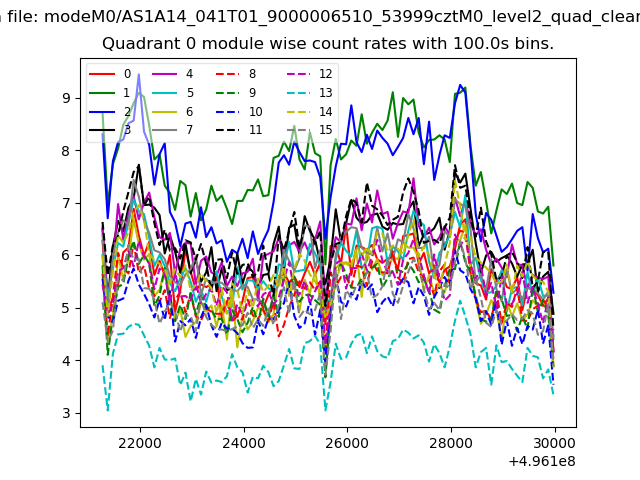 |
 |
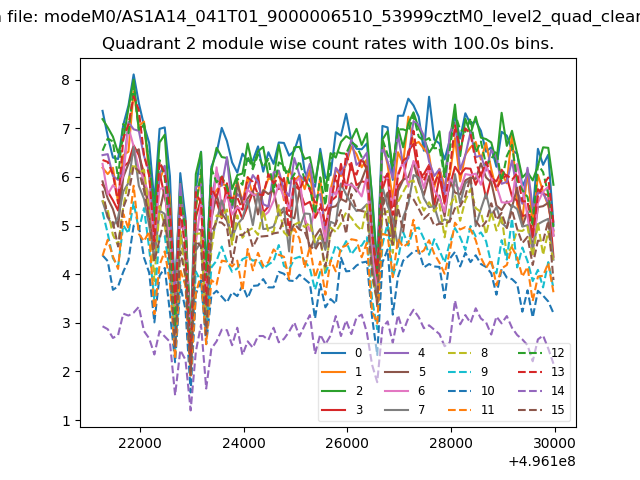
| Module-wise count rates for Quadrant B Data is divided into 100 sec bins |
 |
 |
| Module-wise count rates for Quadrant C Data is divided into 100 sec bins |
 |
 |
| Module-wise count rates for Quadrant D Data is divided into 100 sec bins |
 |
 |
| Parameter | Plot |
|---|---|
| CZT HV Monitor |  |
| D_VDD | 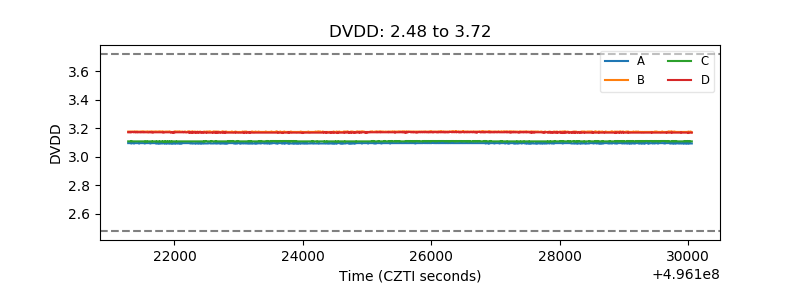 |
| Temperature 1 | 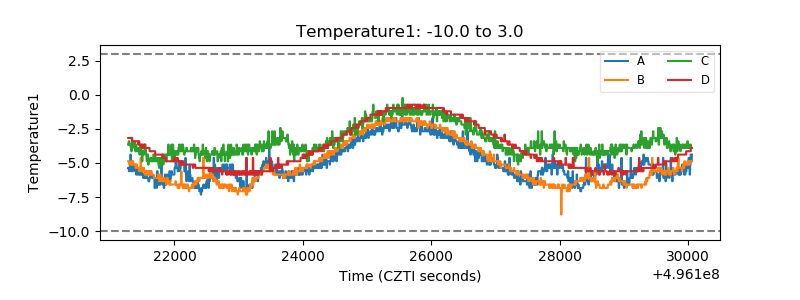 |
| Veto HV Monitor | 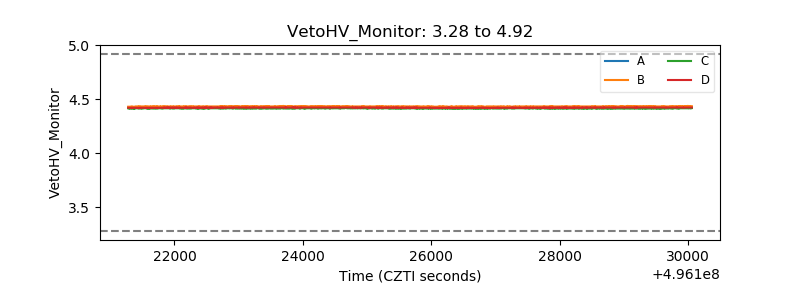 |
| Veto LLD | 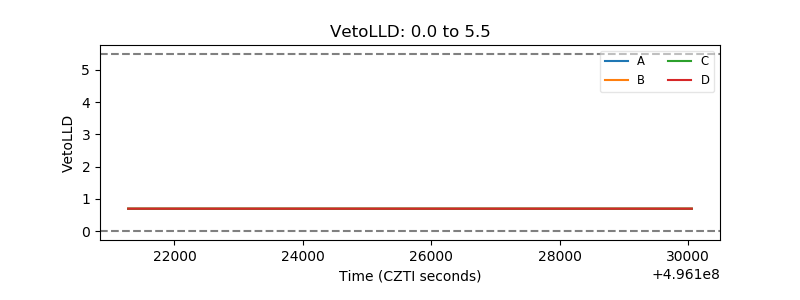 |
| Alpha Counter | 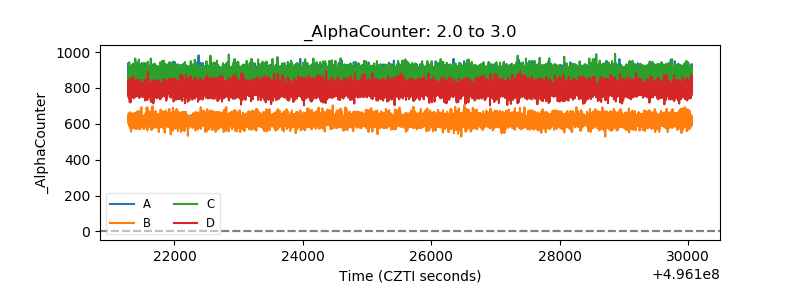 |
| _CPM_Rate | 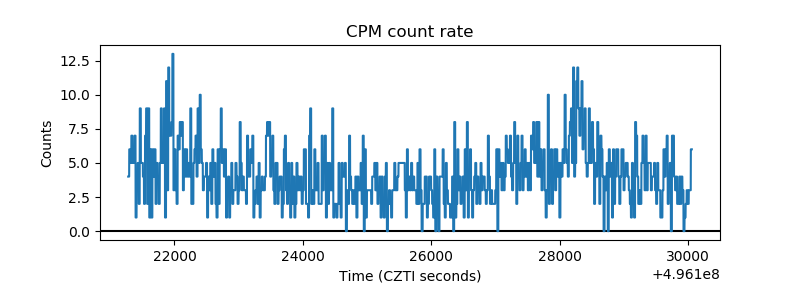 |
| CZT Counter | 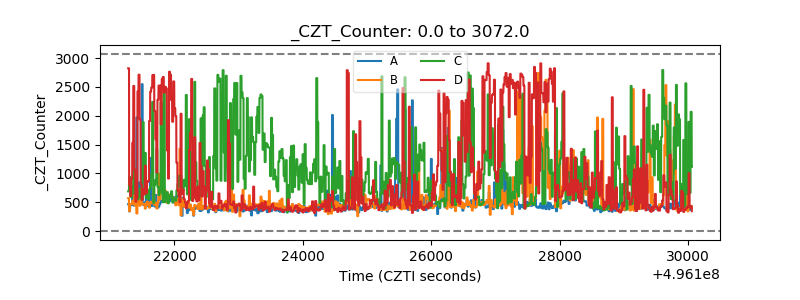 |
| +2.5 Volts monitor | 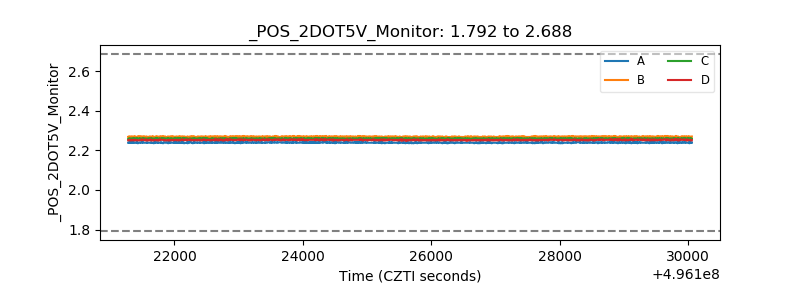 |
| +5 Volts monitor | 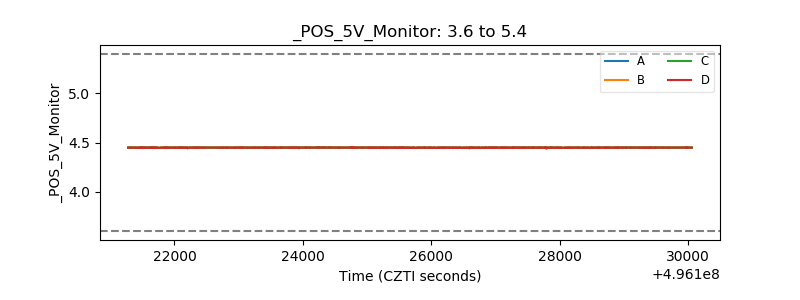 |
| _ROLL_ROT | 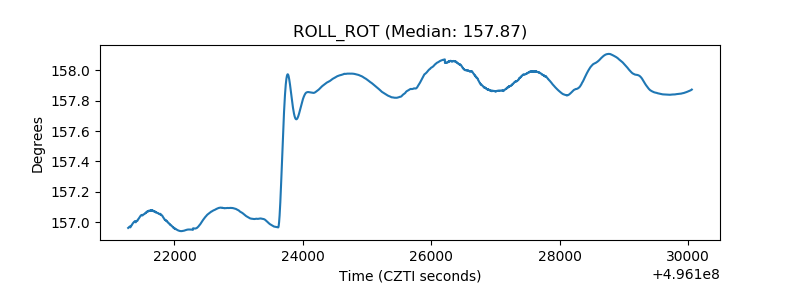 |
| _Roll_DEC | 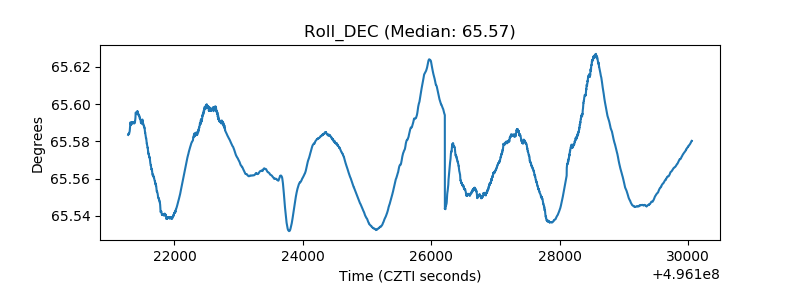 |
| _Roll_RA | 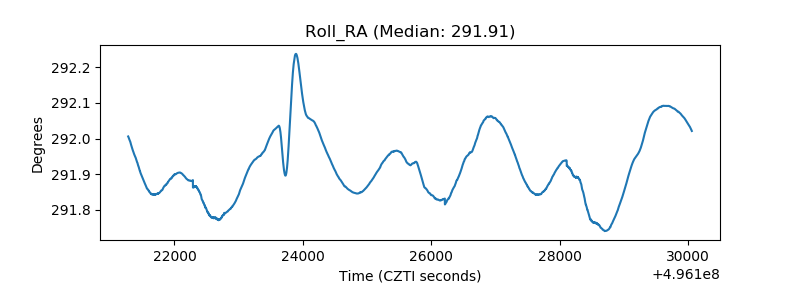 |
| Veto Counter | 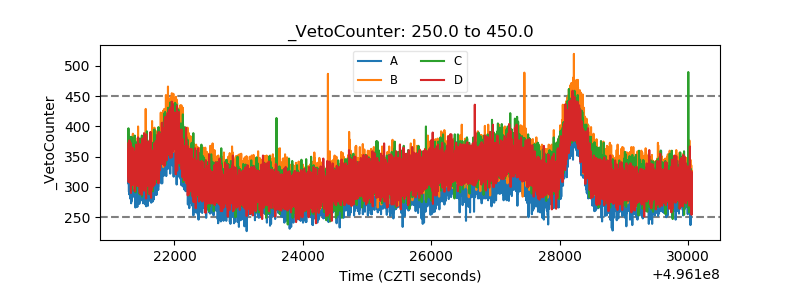 |