| Param | Original file | Final file |
|---|---|---|
| Filename | modeM0/AS1A14_041T01_9000006510_54002cztM0_level2.fits | modeM0/AS1A14_041T01_9000006510_54002cztM0_level2_quad_clean.evt |
| Size (bytes) | 1,349,994,240 | 191,975,040 |
| Size | 1.3 GB | 183.1 MB |
| Events in quadrant A | 8,723,283 | 1,311,948 |
| Events in quadrant B | 12,384,937 | 1,280,507 |
| Events in quadrant C | 11,598,593 | 1,238,803 |
| Events in quadrant D | 16,124,410 | 961,190 |
| Mode M9 | |||
|---|---|---|---|
| Quadrant | BADHDUFLAG | Total packets | Discarded packets |
| A | 0 | 6 | 0 |
| B | 0 | 6 | 0 |
| C | 0 | 6 | 0 |
| D | 0 | 6 | 0 |
| Mode SS | |||
|---|---|---|---|
| Quadrant | BADHDUFLAG | Total packets | Discarded packets |
| A | 0 | 300 | 0 |
| B | 0 | 300 | 0 |
| C | 0 | 300 | 0 |
| D | 0 | 300 | 0 |
| Mode M0 | |||
|---|---|---|---|
| Quadrant | BADHDUFLAG | Total packets | Discarded packets |
| A | 0 | 36582 | 4 |
| B | 0 | 46997 | 4 |
| C | 0 | 44854 | 4 |
| D | 0 | 58461 | 4 |
| Quadrant | Total seconds | Saturated seconds | Saturation percentage |
|---|---|---|---|
| A | 14766 | 713 | 4.828660% |
| B | 14767 | 2186 | 14.803278% |
| C | 14767 | 905 | 6.128530% |
| D | 14767 | 2999 | 20.308797% |
Noise dominated data is calculated using 1-second bins in cleaned event files. If a bin has >2000 counts, and if more than 50% of those come from <1% of pixels, then it is considered to be noise-dominated and hence unusable.
| Quadrant | # 1 sec bins | Bins with >0 counts | Bins with >2000 counts | High rate bins dominated by noise | Noise dominated (total time) | Noise dominated (detector-on time) | Marked lightcurve |
|---|---|---|---|---|---|---|---|
| A | 15331 | 14767 | 436 | 436 | 2.84% | 2.95% | 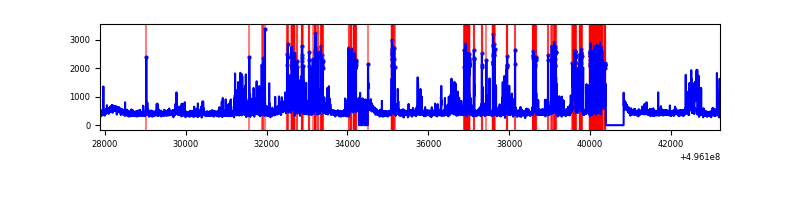 |
| B | 15332 | 14767 | 1612 | 1612 | 10.51% | 10.92% | 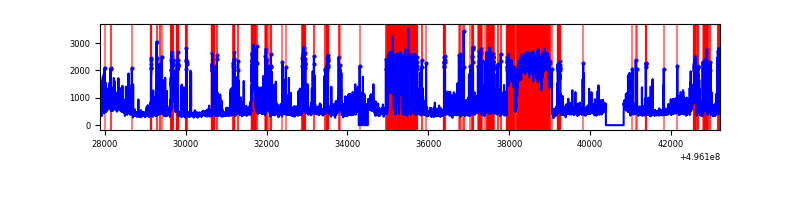 |
| C | 15332 | 14769 | 702 | 702 | 4.58% | 4.75% | 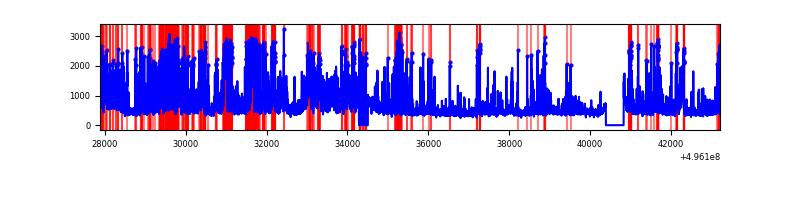 |
| D | 15331 | 14769 | 2950 | 2950 | 19.24% | 19.97% | 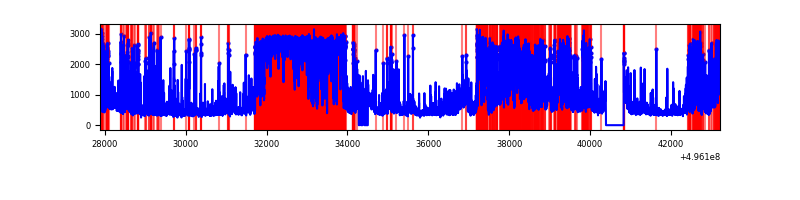 |
Top three noisy pixels from each quadrant. If the there are fewer than three noisy pixels in the level2.evt file, extra rows are filled as -1
| Pixel properties | Quadrant properties | ||||||
|---|---|---|---|---|---|---|---|
| Quadrant | DetID | PixID | Counts | Sigma | Mean | Median | Sigma |
| A | 15 | 174 | 1852480 | 4911.89 | 1550 | 1510 | 376.8 |
| A | 4 | 249 | 203998 | 537.34 | 1550 | 1510 | 376.8 |
| A | 0 | 8 | 194533 | 512.22 | 1550 | 1510 | 376.8 |
| B | 5 | 250 | 2625252 | 8187.51 | 1497 | 1444 | 320.5 |
| B | 4 | 81 | 2311771 | 7209.3 | 1497 | 1444 | 320.5 |
| B | 5 | 185 | 584769 | 1820.25 | 1497 | 1444 | 320.5 |
| C | 10 | 171 | 2825603 | 6914.26 | 1498 | 1485 | 408.4 |
| C | 1 | 241 | 1082387 | 2646.36 | 1498 | 1485 | 408.4 |
| C | 12 | 252 | 353481 | 861.79 | 1498 | 1485 | 408.4 |
| D | 8 | 176 | 7633264 | 19849.57 | 1365 | 1303 | 384.5 |
| D | 2 | 172 | 852678 | 2214.3 | 1365 | 1303 | 384.5 |
| D | 3 | 12 | 716604 | 1860.39 | 1365 | 1303 | 384.5 |
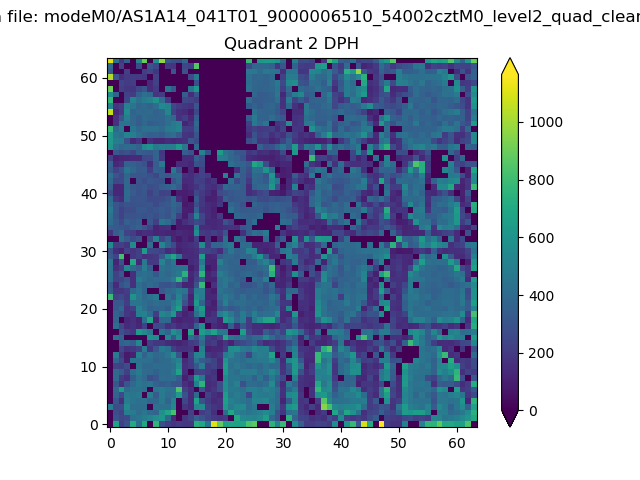
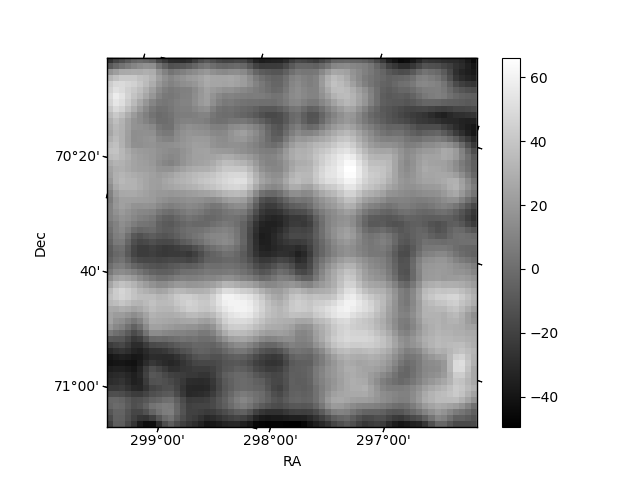
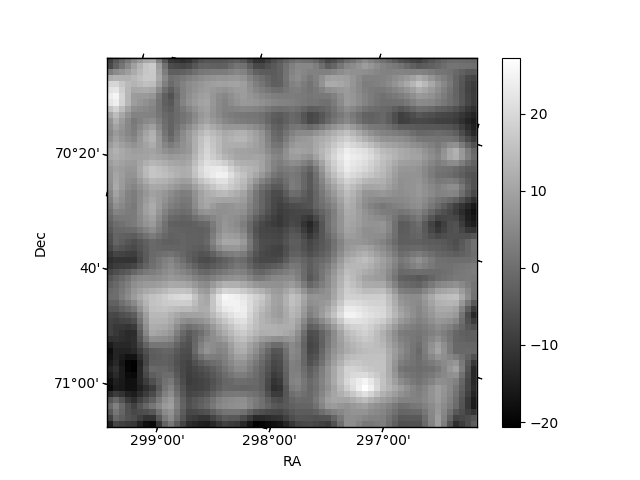
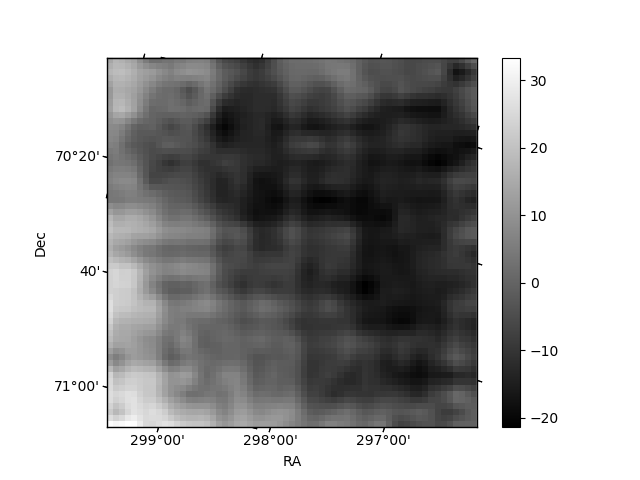
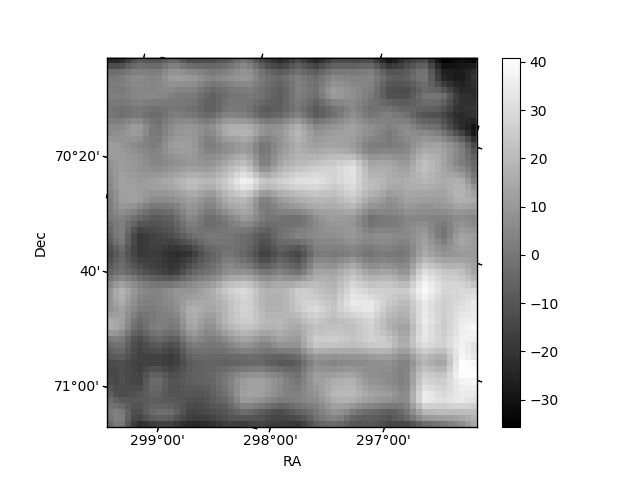
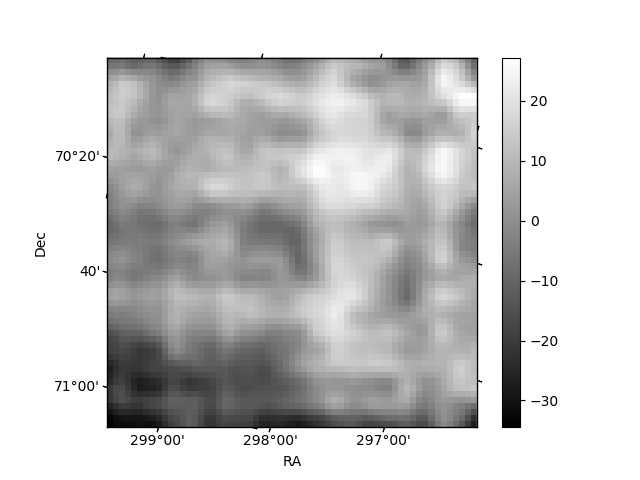
Histogram calculated using DETX and DETY for each event in the final _common_clean file
| Quadrant A | 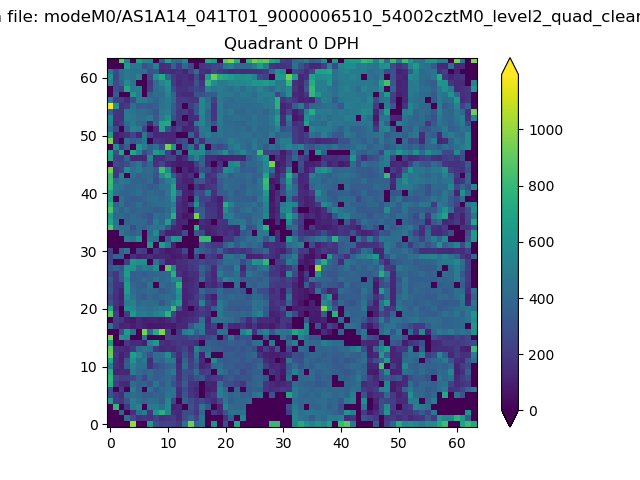 |
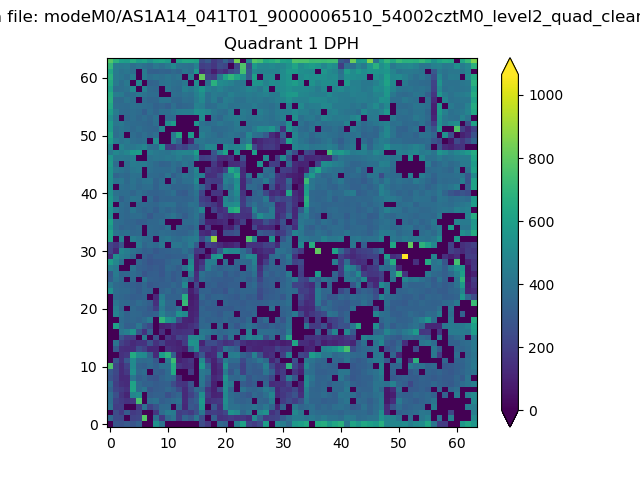 |
Quadrant B |
|---|---|---|---|
| Quadrant D | 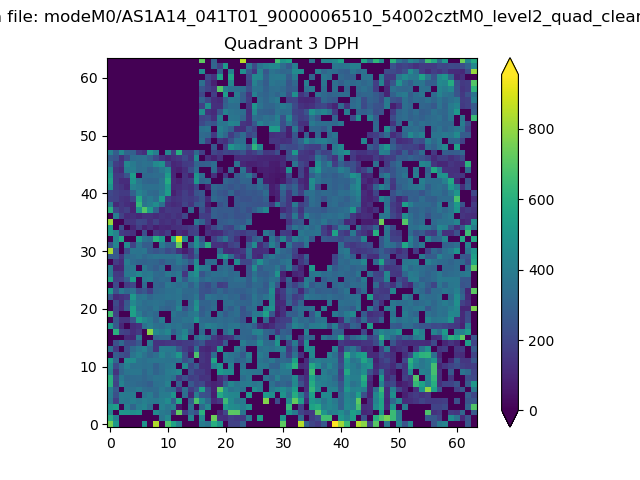 |
 |
Quadrant C |
| Plot type | Count rate plots | Images |
|---|---|---|
| Comparison with Poisson distribution Blue bars denote a histogram of data divided into 1 sec bins. Red curve is a Poisson curve with rate = median count rate of data. |
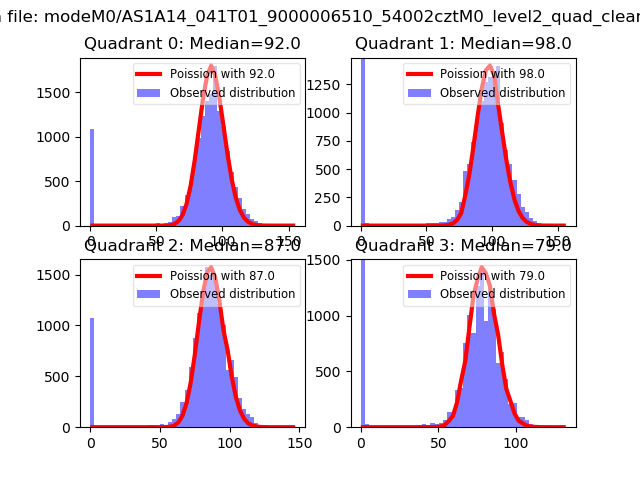 |
 |
| Quadrant-wise count rates Data is divided into 100 sec bins |
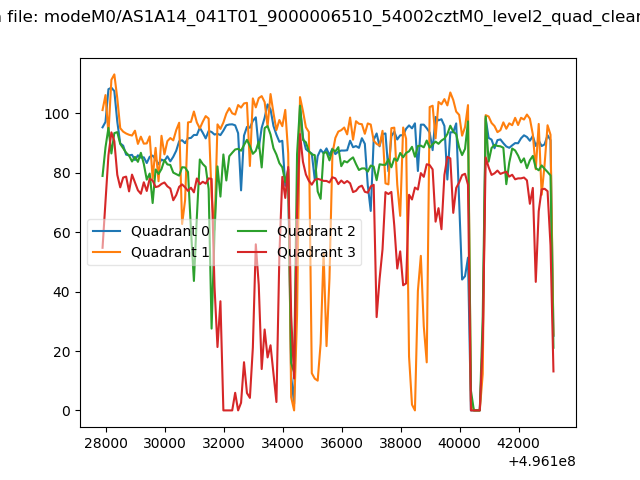 |
|
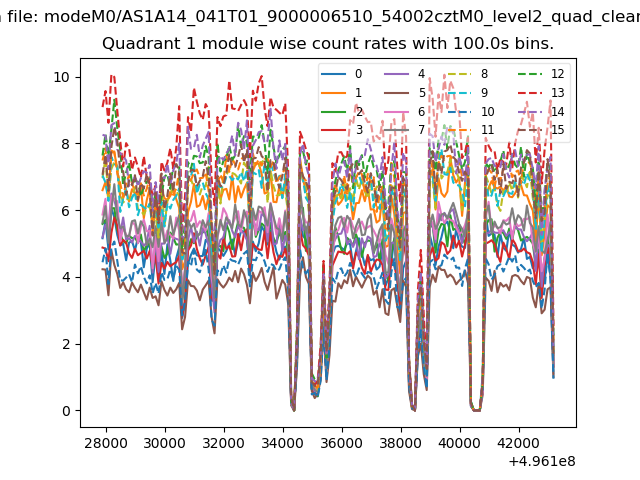
| Module-wise count rates for Quadrant A Data is divided into 100 sec bins |
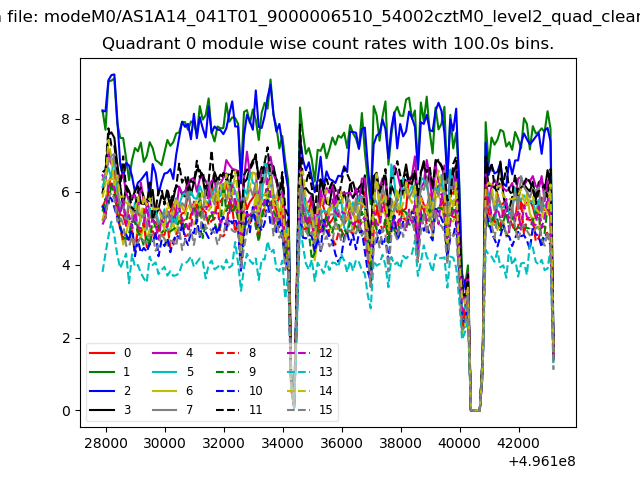 |
 |
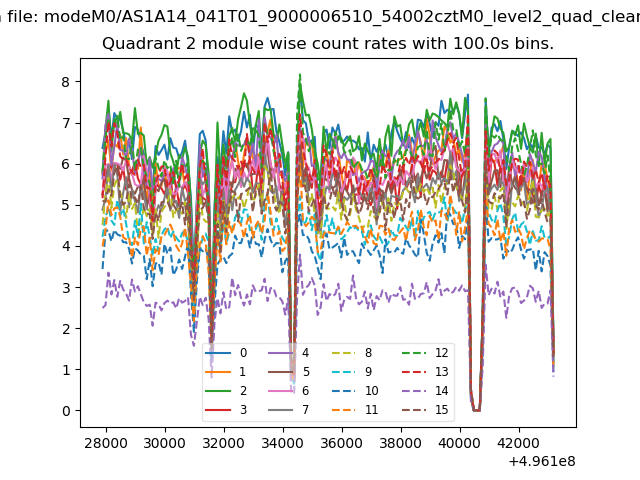
| Module-wise count rates for Quadrant B Data is divided into 100 sec bins |
 |
 |
| Module-wise count rates for Quadrant C Data is divided into 100 sec bins |
 |
 |
| Module-wise count rates for Quadrant D Data is divided into 100 sec bins |
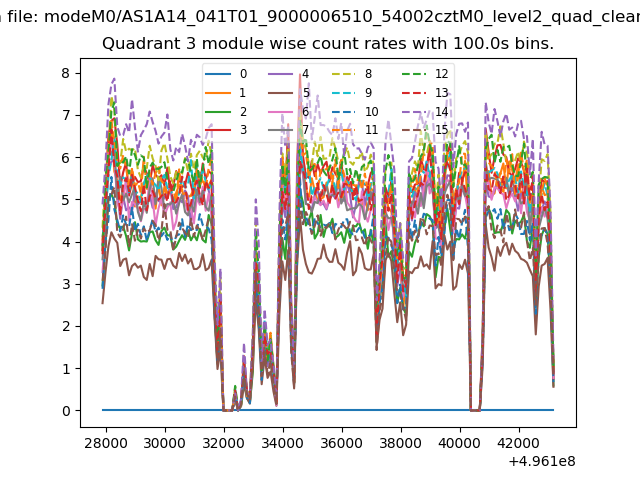 |
 |
| Parameter | Plot |
|---|---|
| CZT HV Monitor | 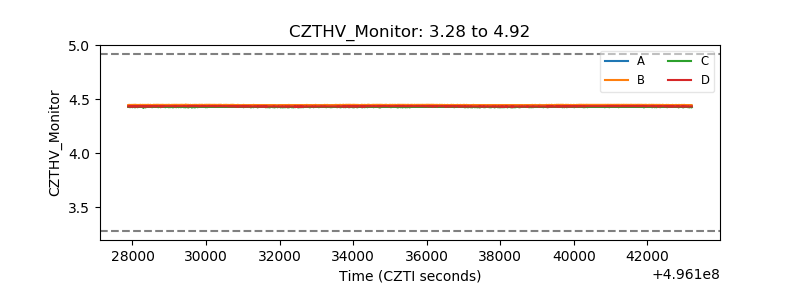 |
| D_VDD | 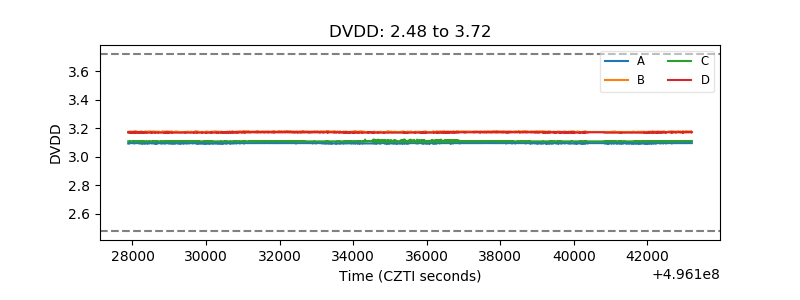 |
| Temperature 1 | 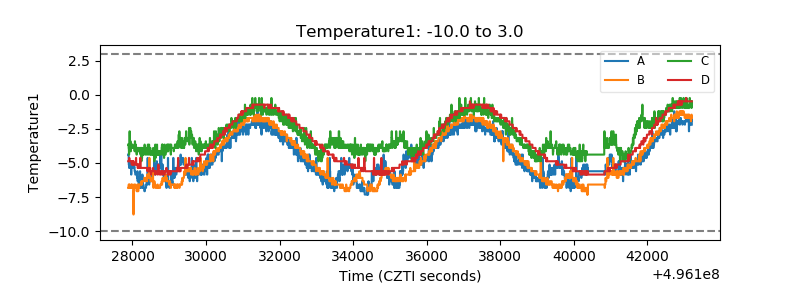 |
| Veto HV Monitor | 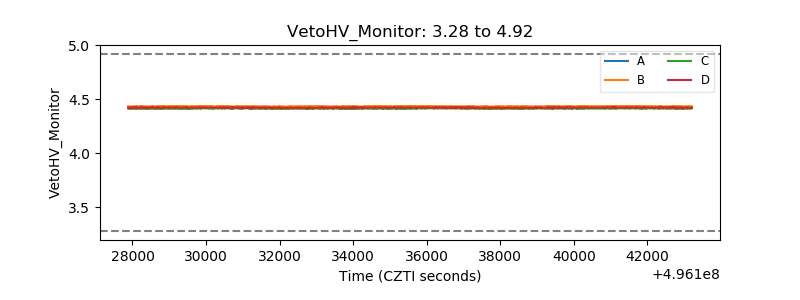 |
| Veto LLD | 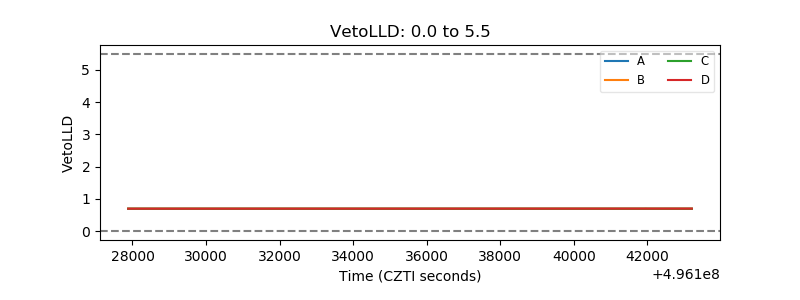 |
| Alpha Counter | 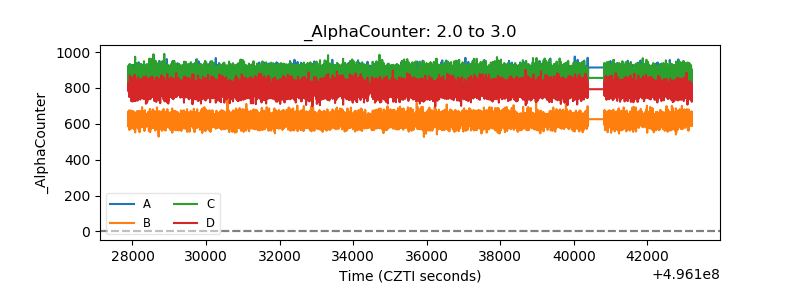 |
| _CPM_Rate | 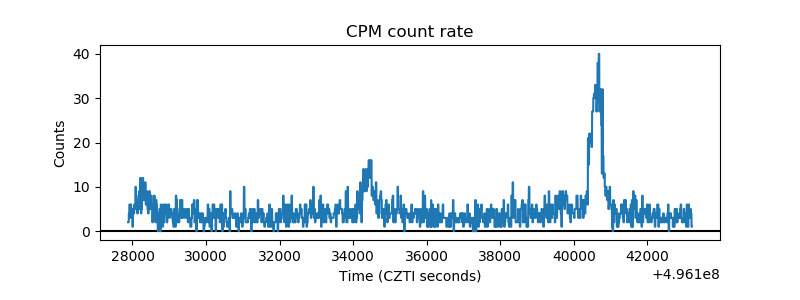 |
| CZT Counter | 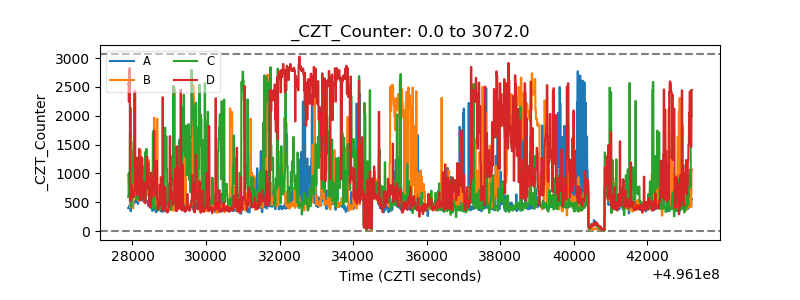 |
| +2.5 Volts monitor |  |
| +5 Volts monitor |  |
| _ROLL_ROT | 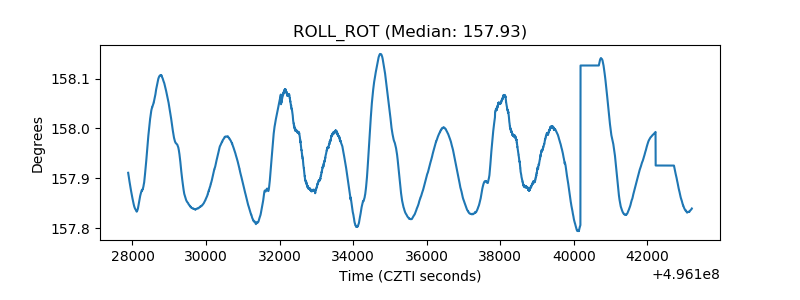 |
| _Roll_DEC | 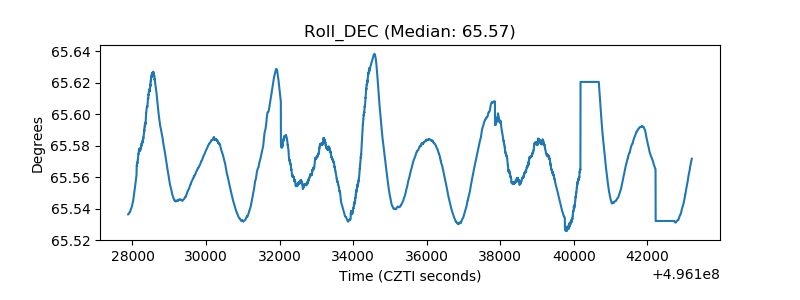 |
| _Roll_RA | 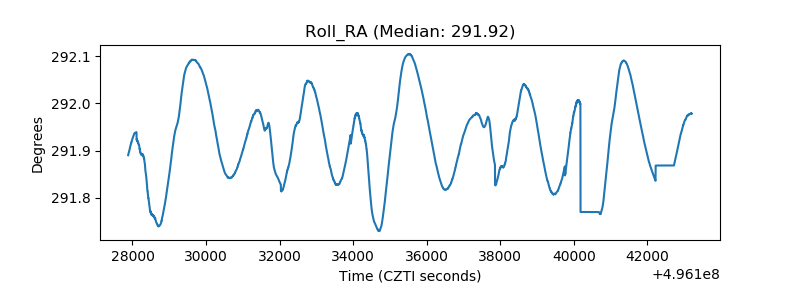 |
| Veto Counter | 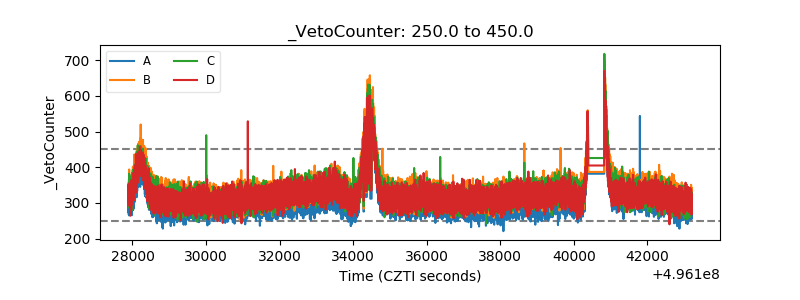 |