| Param | Original file | Final file |
|---|---|---|
| Filename | modeM0/AS1A14_041T01_9000006510_54003cztM0_level2.fits | modeM0/AS1A14_041T01_9000006510_54003cztM0_level2_quad_clean.evt |
| Size (bytes) | 1,132,058,880 | 137,808,000 |
| Size | 1.1 GB | 131.4 MB |
| Events in quadrant A | 6,194,464 | 998,625 |
| Events in quadrant B | 9,681,998 | 937,274 |
| Events in quadrant C | 7,331,209 | 949,933 |
| Events in quadrant D | 17,856,135 | 533,066 |
| Mode M9 | |||
|---|---|---|---|
| Quadrant | BADHDUFLAG | Total packets | Discarded packets |
| A | 0 | 15 | 0 |
| B | 0 | 15 | 0 |
| C | 0 | 15 | 0 |
| D | 0 | 15 | 0 |
| Mode SS | |||
|---|---|---|---|
| Quadrant | BADHDUFLAG | Total packets | Discarded packets |
| A | 0 | 222 | 0 |
| B | 0 | 222 | 0 |
| C | 0 | 222 | 0 |
| D | 0 | 222 | 0 |
| Mode M0 | |||
|---|---|---|---|
| Quadrant | BADHDUFLAG | Total packets | Discarded packets |
| A | 0 | 26323 | 2 |
| B | 0 | 36405 | 2 |
| C | 0 | 29553 | 2 |
| D | 0 | 60486 | 2 |
| Quadrant | Total seconds | Saturated seconds | Saturation percentage |
|---|---|---|---|
| A | 10876 | 440 | 4.045605% |
| B | 10877 | 1802 | 16.567068% |
| C | 10877 | 283 | 2.601820% |
| D | 10877 | 4810 | 44.221752% |
Noise dominated data is calculated using 1-second bins in cleaned event files. If a bin has >2000 counts, and if more than 50% of those come from <1% of pixels, then it is considered to be noise-dominated and hence unusable.
| Quadrant | # 1 sec bins | Bins with >0 counts | Bins with >2000 counts | High rate bins dominated by noise | Noise dominated (total time) | Noise dominated (detector-on time) | Marked lightcurve |
|---|---|---|---|---|---|---|---|
| A | 12395 | 10875 | 275 | 275 | 2.22% | 2.53% | 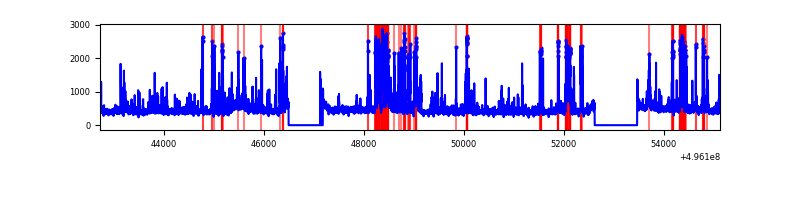 |
| B | 12397 | 10877 | 1361 | 1361 | 10.98% | 12.51% | 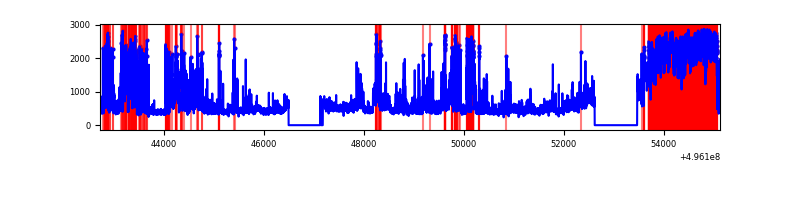 |
| C | 12397 | 10877 | 205 | 205 | 1.65% | 1.88% | 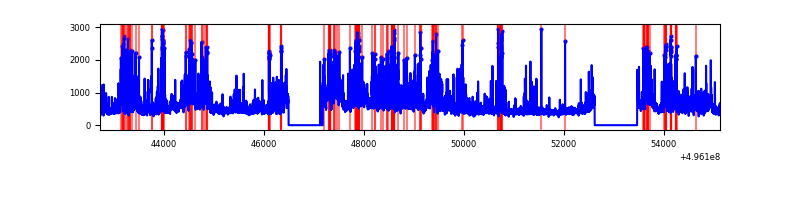 |
| D | 12396 | 10876 | 4500 | 4500 | 36.30% | 41.38% | 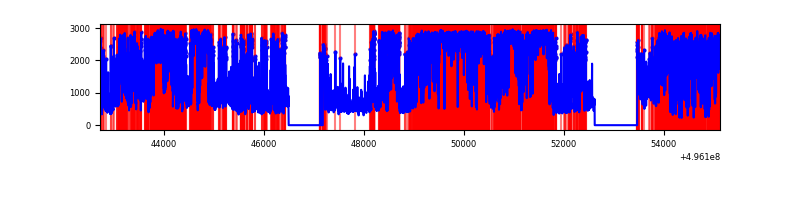 |
Top three noisy pixels from each quadrant. If the there are fewer than three noisy pixels in the level2.evt file, extra rows are filled as -1
| Pixel properties | Quadrant properties | ||||||
|---|---|---|---|---|---|---|---|
| Quadrant | DetID | PixID | Counts | Sigma | Mean | Median | Sigma |
| A | 15 | 174 | 1043003 | 3693.86 | 1135 | 1106 | 282.1 |
| A | 7 | 14 | 266914 | 942.38 | 1135 | 1106 | 282.1 |
| A | 0 | 8 | 170717 | 601.33 | 1135 | 1106 | 282.1 |
| B | 5 | 250 | 2444679 | 10660.15 | 1072 | 1034 | 229.2 |
| B | 4 | 81 | 1731899 | 7550.72 | 1072 | 1034 | 229.2 |
| B | 0 | 213 | 622192 | 2709.74 | 1072 | 1034 | 229.2 |
| C | 12 | 250 | 970977 | 3192.14 | 1107 | 1099 | 303.8 |
| C | 10 | 171 | 815208 | 2679.46 | 1107 | 1099 | 303.8 |
| C | 13 | 3 | 400761 | 1315.4 | 1107 | 1099 | 303.8 |
| D | 8 | 176 | 12850583 | 53530.77 | 832 | 793 | 240.0 |
| D | 6 | 239 | 880351 | 3664.14 | 832 | 793 | 240.0 |
| D | 12 | 2 | 201311 | 835.34 | 832 | 793 | 240.0 |
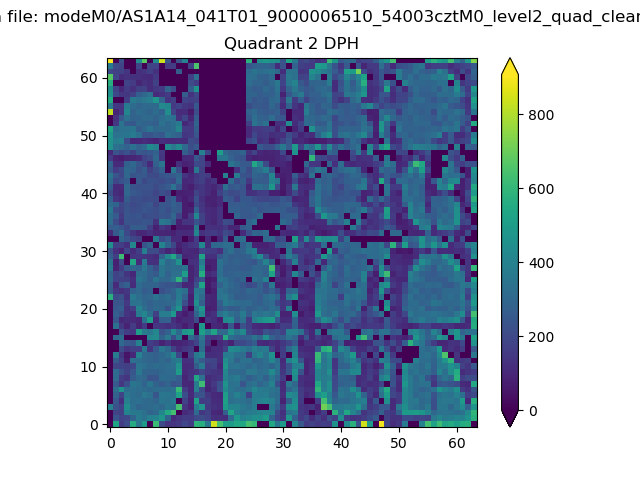
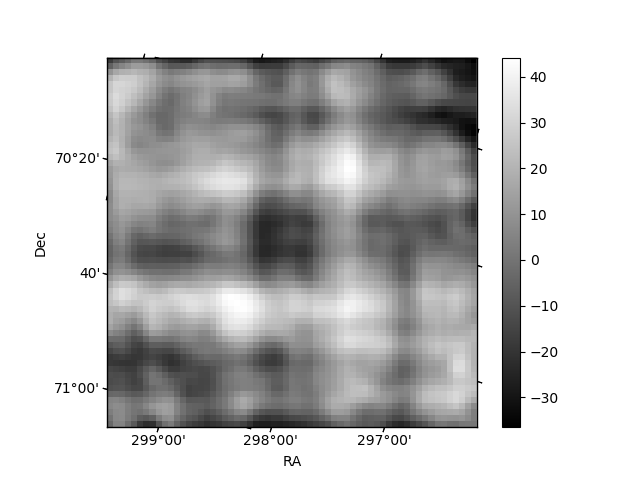
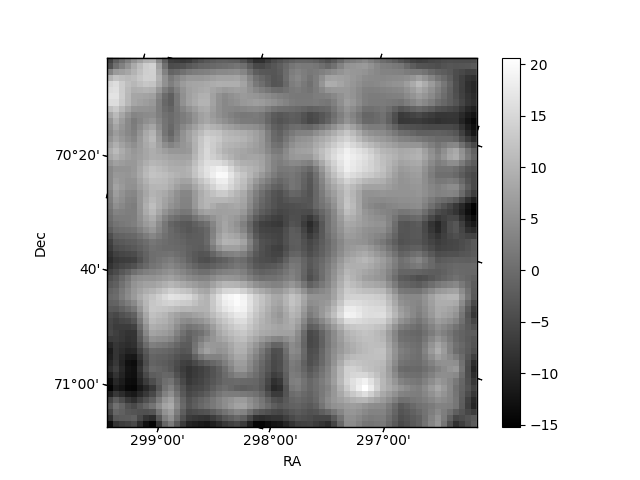
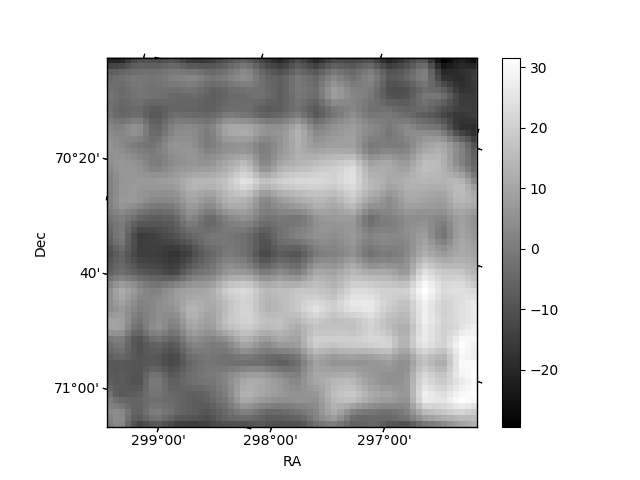
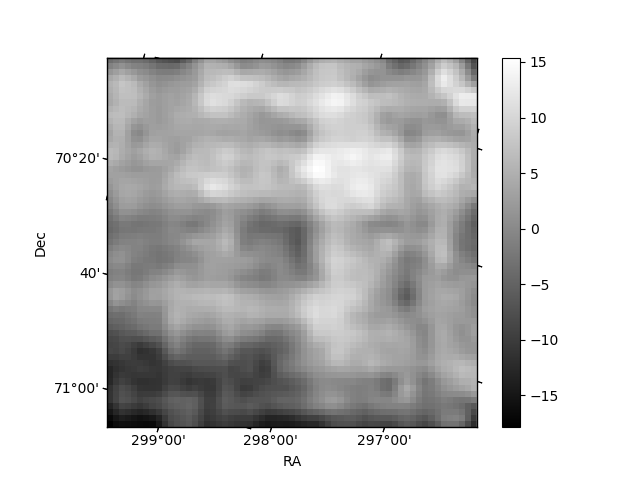
Histogram calculated using DETX and DETY for each event in the final _common_clean file
| Quadrant A | 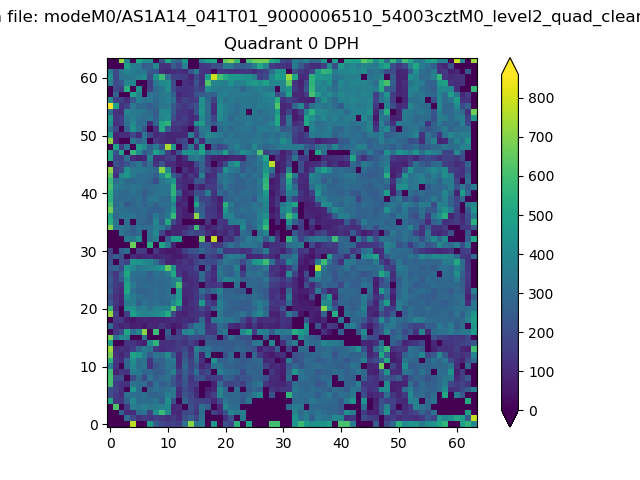 |
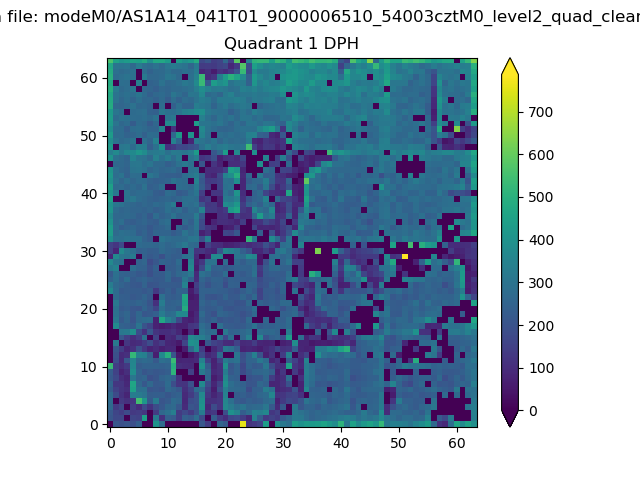 |
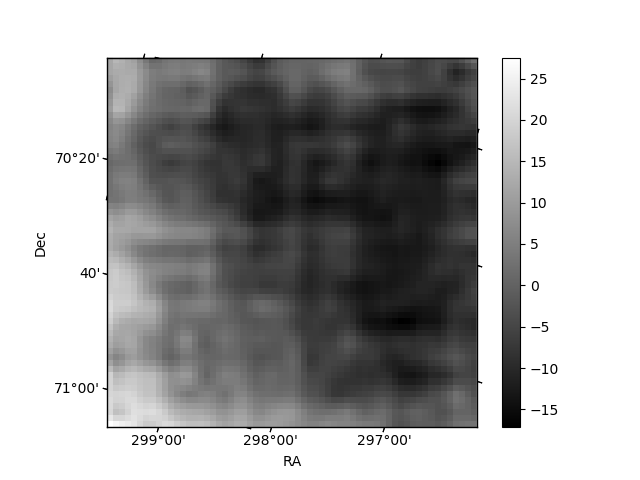
Quadrant B |
|---|---|---|---|
| Quadrant D | 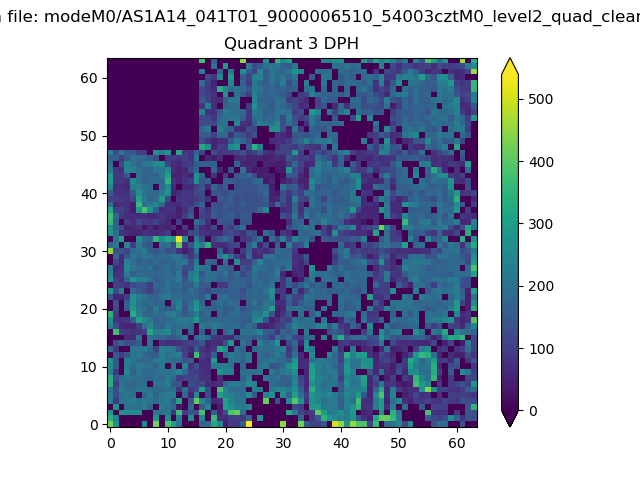 |
 |
Quadrant C |
| Plot type | Count rate plots | Images |
|---|---|---|
| Comparison with Poisson distribution Blue bars denote a histogram of data divided into 1 sec bins. Red curve is a Poisson curve with rate = median count rate of data. |
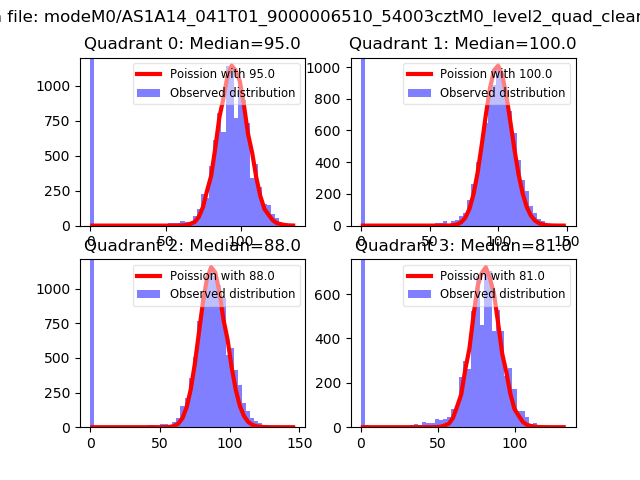 |
 |
| Quadrant-wise count rates Data is divided into 100 sec bins |
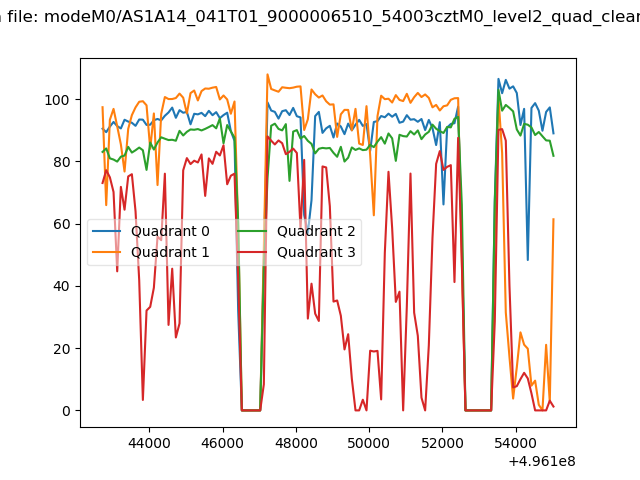 |
|
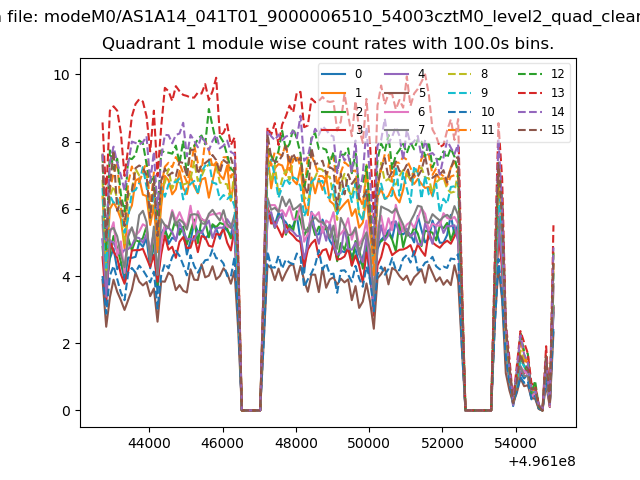
| Module-wise count rates for Quadrant A Data is divided into 100 sec bins |
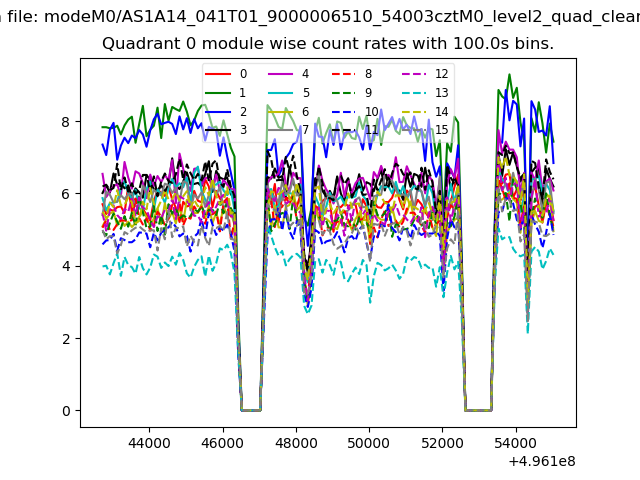 |
 |
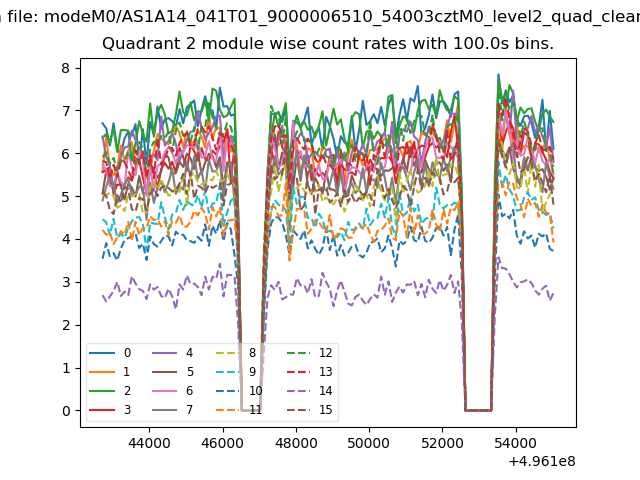
| Module-wise count rates for Quadrant B Data is divided into 100 sec bins |
 |
 |
| Module-wise count rates for Quadrant C Data is divided into 100 sec bins |
 |
 |
| Module-wise count rates for Quadrant D Data is divided into 100 sec bins |
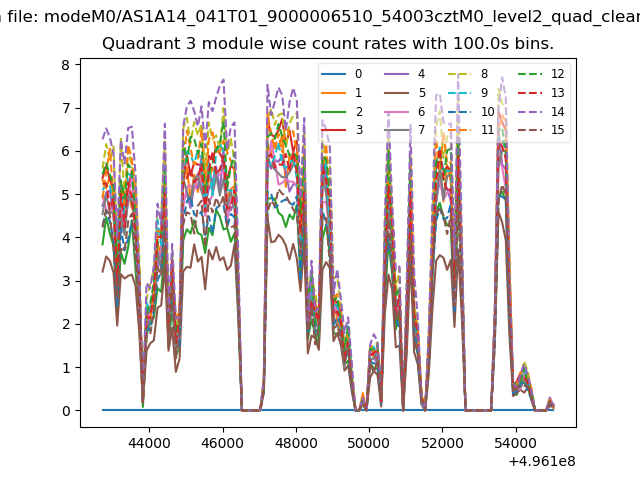 |
 |
| Parameter | Plot |
|---|---|
| CZT HV Monitor | 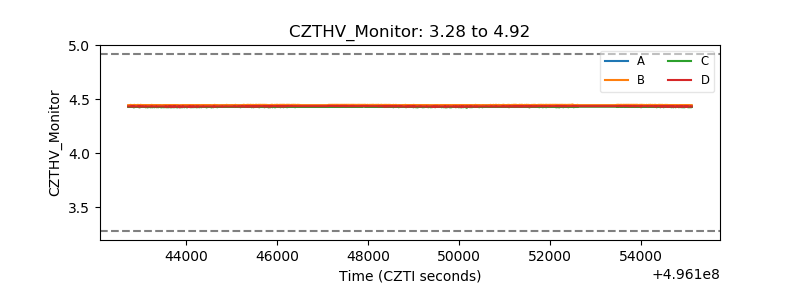 |
| D_VDD | 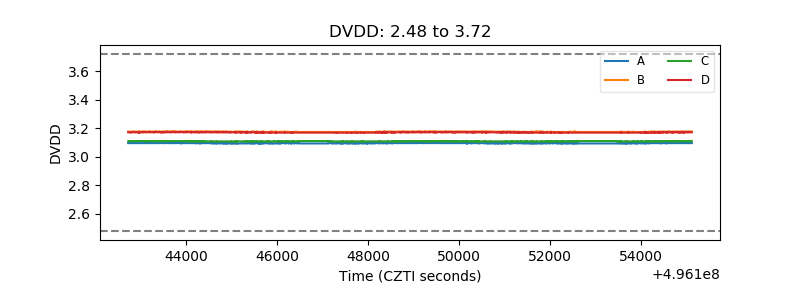 |
| Temperature 1 | 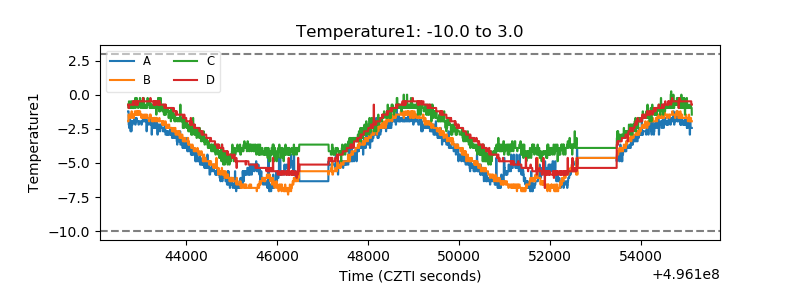 |
| Veto HV Monitor | 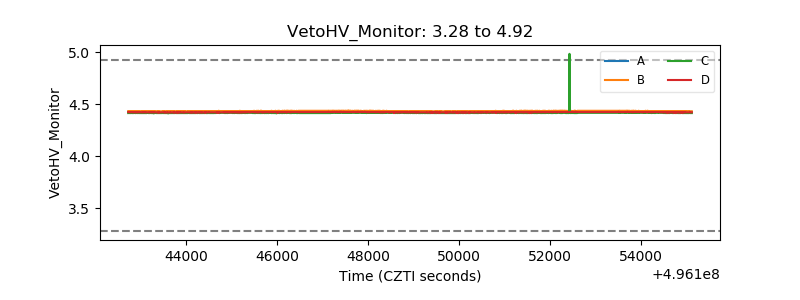 |
| Veto LLD | 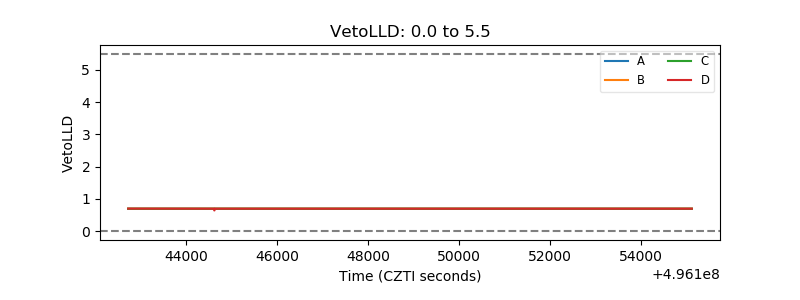 |
| Alpha Counter | 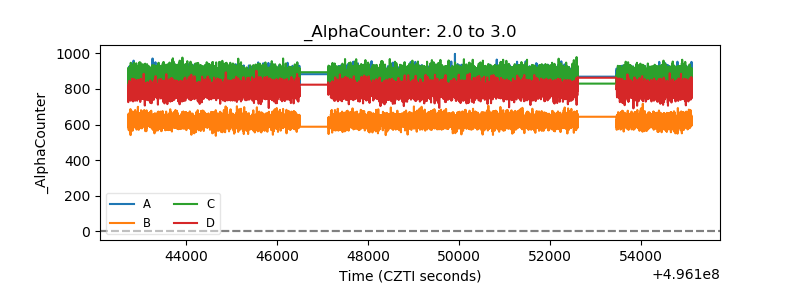 |
| _CPM_Rate | 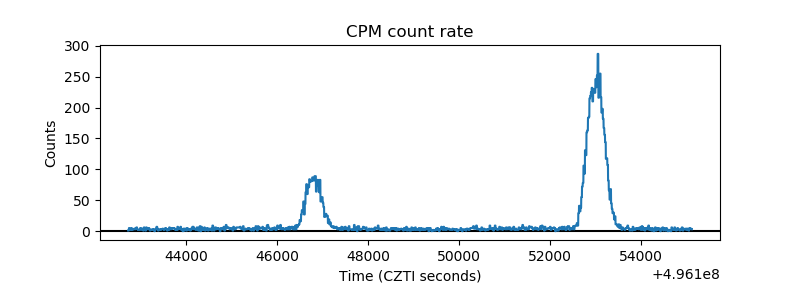 |
| CZT Counter | 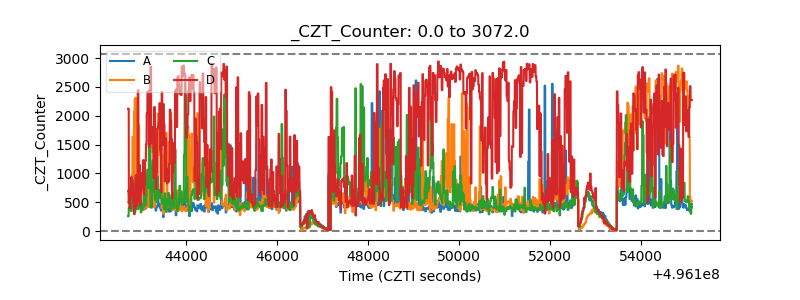 |
| +2.5 Volts monitor |  |
| +5 Volts monitor |  |
| _ROLL_ROT | 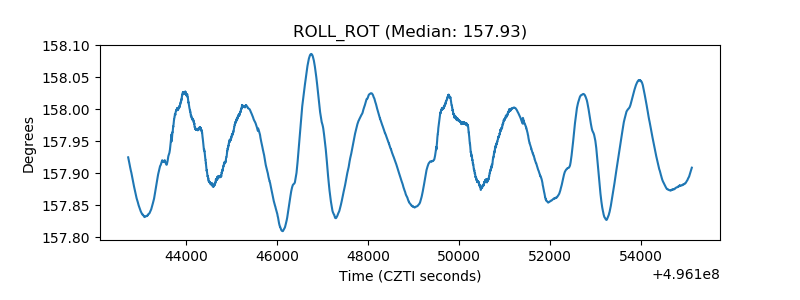 |
| _Roll_DEC | 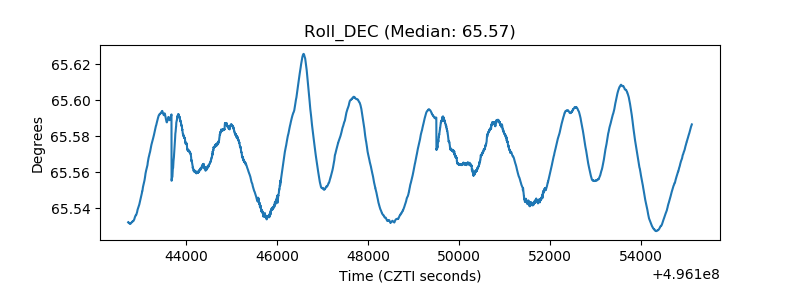 |
| _Roll_RA | 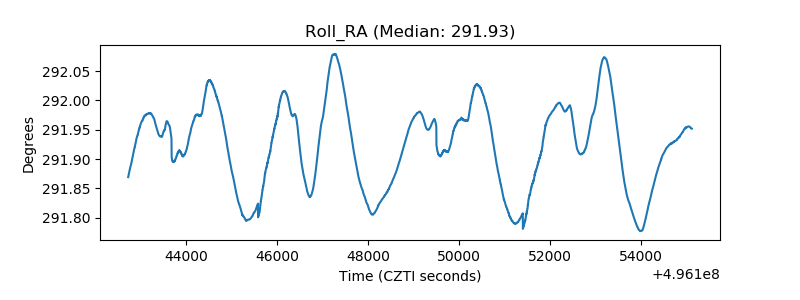 |
| Veto Counter | 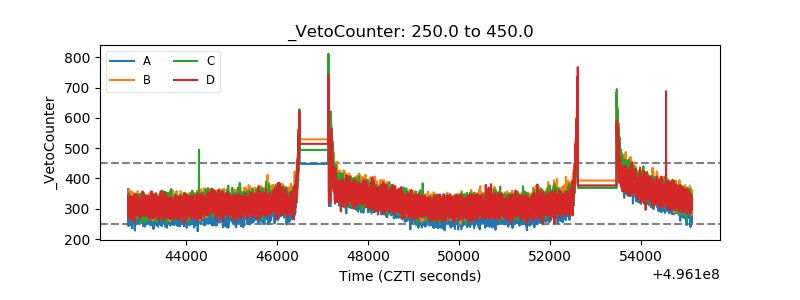 |