| Param | Original file | Final file |
|---|---|---|
| Filename | modeM0/AS1A14_041T01_9000006510_54006cztM0_level2.fits | modeM0/AS1A14_041T01_9000006510_54006cztM0_level2_quad_clean.evt |
| Size (bytes) | 594,342,720 | 82,779,840 |
| Size | 566.8 MB | 78.9 MB |
| Events in quadrant A | 3,283,106 | 609,584 |
| Events in quadrant B | 5,224,355 | 612,146 |
| Events in quadrant C | 3,317,487 | 571,871 |
| Events in quadrant D | 9,700,713 | 285,645 |
| Mode M9 | |||
|---|---|---|---|
| Quadrant | BADHDUFLAG | Total packets | Discarded packets |
| A | 0 | 11 | 0 |
| B | 0 | 11 | 0 |
| C | 0 | 11 | 0 |
| D | 0 | 11 | 0 |
| Mode SS | |||
|---|---|---|---|
| Quadrant | BADHDUFLAG | Total packets | Discarded packets |
| A | 0 | 126 | 0 |
| B | 0 | 126 | 0 |
| C | 0 | 126 | 0 |
| D | 0 | 126 | 0 |
| Mode M0 | |||
|---|---|---|---|
| Quadrant | BADHDUFLAG | Total packets | Discarded packets |
| A | 0 | 14343 | 1 |
| B | 0 | 19838 | 2 |
| C | 0 | 14007 | 1 |
| D | 0 | 33058 | 1 |
| Quadrant | Total seconds | Saturated seconds | Saturation percentage |
|---|---|---|---|
| A | 6112 | 98 | 1.603403% |
| B | 6112 | 571 | 9.342277% |
| C | 6112 | 62 | 1.014398% |
| D | 6112 | 3037 | 49.689136% |
Noise dominated data is calculated using 1-second bins in cleaned event files. If a bin has >2000 counts, and if more than 50% of those come from <1% of pixels, then it is considered to be noise-dominated and hence unusable.
| Quadrant | # 1 sec bins | Bins with >0 counts | Bins with >2000 counts | High rate bins dominated by noise | Noise dominated (total time) | Noise dominated (detector-on time) | Marked lightcurve |
|---|---|---|---|---|---|---|---|
| A | 7272 | 6113 | 76 | 76 | 1.05% | 1.24% | 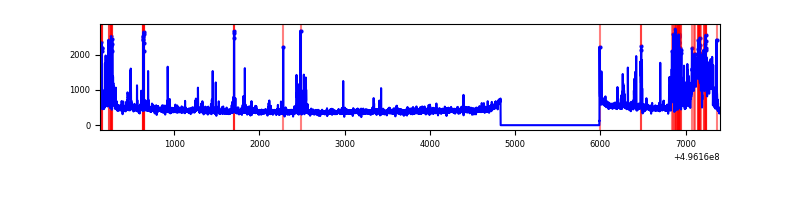 |
| B | 7272 | 6113 | 428 | 428 | 5.89% | 7.00% | 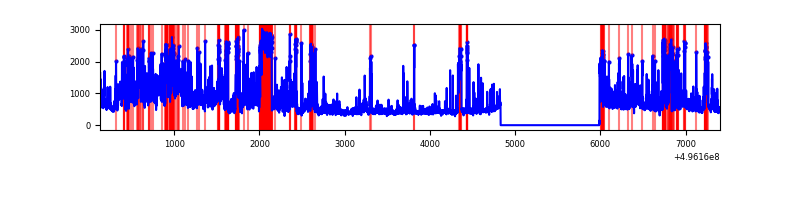 |
| C | 7272 | 6113 | 51 | 51 | 0.70% | 0.83% | 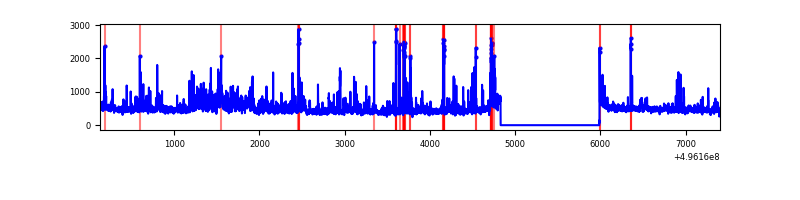 |
| D | 7271 | 6112 | 2427 | 2427 | 33.38% | 39.71% | 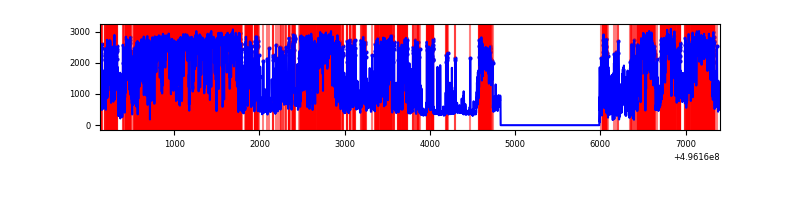 |
Top three noisy pixels from each quadrant. If the there are fewer than three noisy pixels in the level2.evt file, extra rows are filled as -1
| Pixel properties | Quadrant properties | ||||||
|---|---|---|---|---|---|---|---|
| Quadrant | DetID | PixID | Counts | Sigma | Mean | Median | Sigma |
| A | 12 | 115 | 336041 | 2075.58 | 650 | 635 | 161.6 |
| A | 15 | 174 | 227494 | 1403.87 | 650 | 635 | 161.6 |
| A | 0 | 8 | 70623 | 433.1 | 650 | 635 | 161.6 |
| B | 4 | 81 | 870435 | 6590.44 | 622 | 600 | 132.0 |
| B | 5 | 250 | 610781 | 4623.13 | 622 | 600 | 132.0 |
| B | 0 | 155 | 492628 | 3727.92 | 622 | 600 | 132.0 |
| C | 12 | 250 | 320198 | 1832.68 | 637 | 631 | 174.4 |
| C | 13 | 3 | 171151 | 977.91 | 637 | 631 | 174.4 |
| C | 12 | 252 | 100532 | 572.92 | 637 | 631 | 174.4 |
| D | 8 | 176 | 6909382 | 56588.8 | 417 | 398 | 122.1 |
| D | 12 | 2 | 425490 | 3481.76 | 417 | 398 | 122.1 |
| D | 6 | 239 | 314046 | 2568.97 | 417 | 398 | 122.1 |
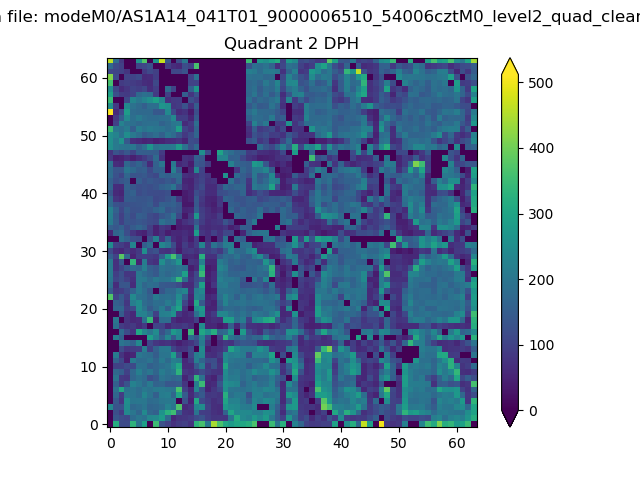
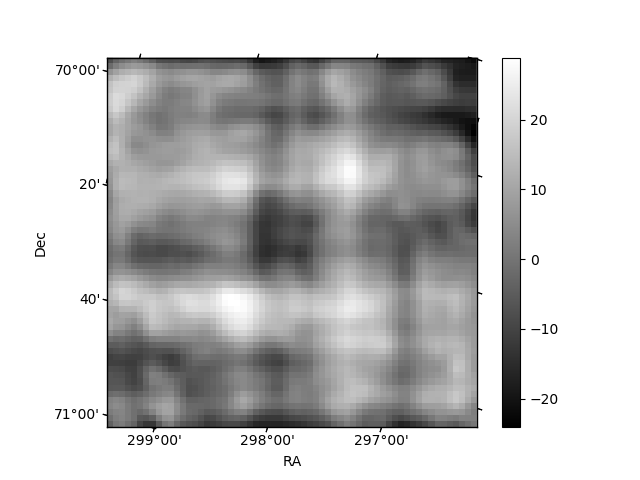
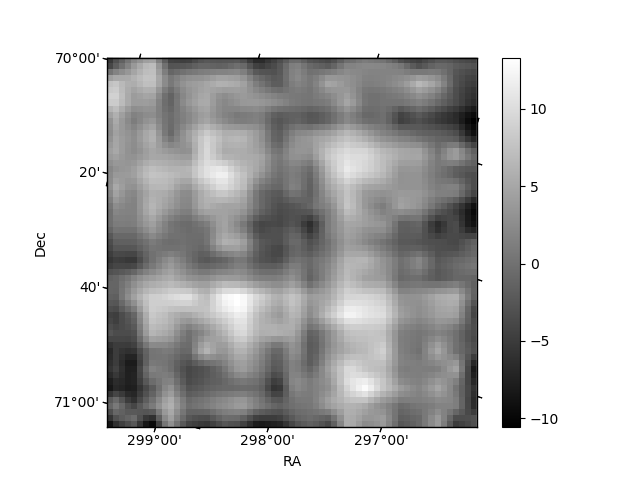
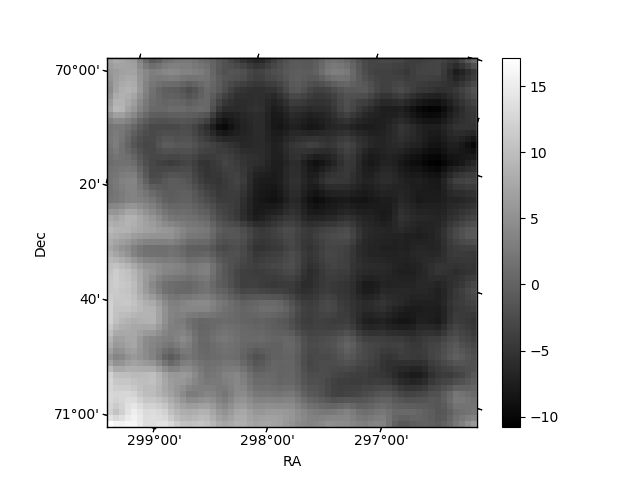
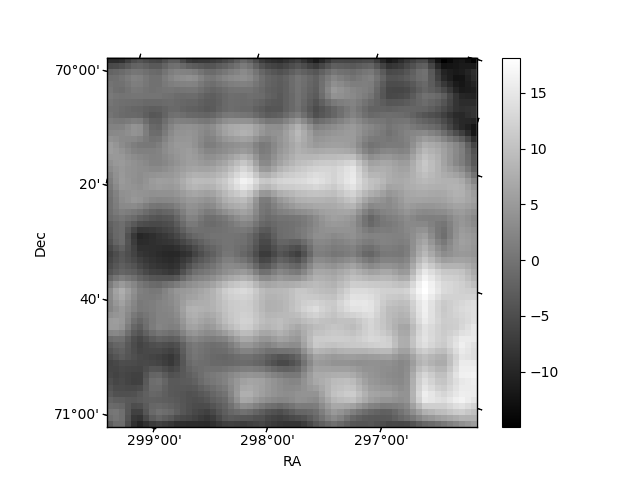
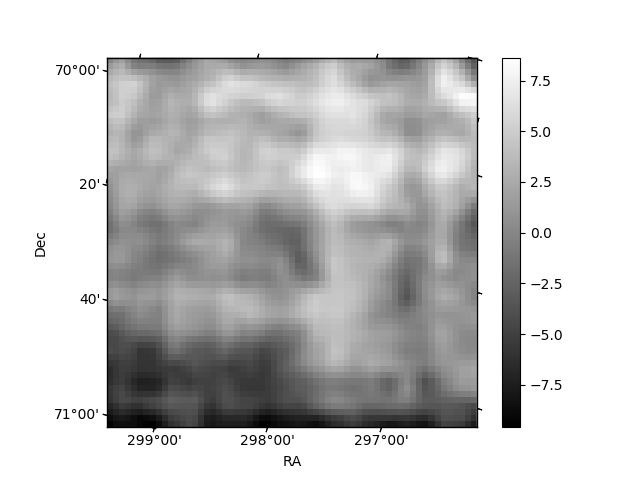
Histogram calculated using DETX and DETY for each event in the final _common_clean file
| Quadrant A | 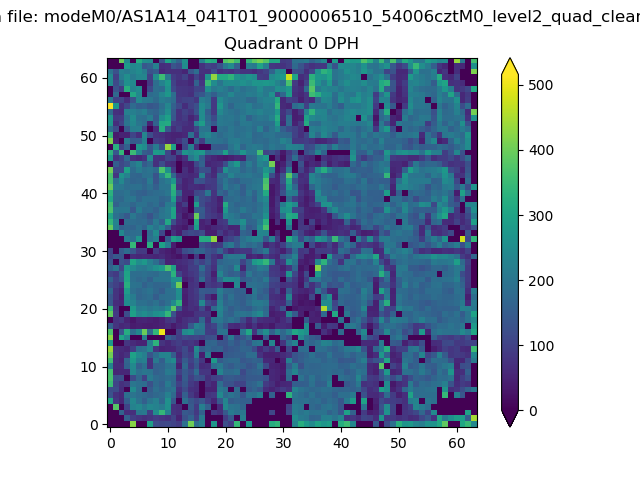 |
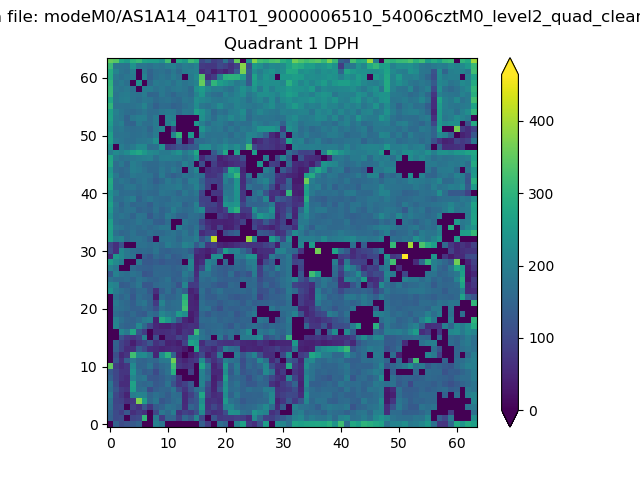 |
Quadrant B |
|---|---|---|---|
| Quadrant D | 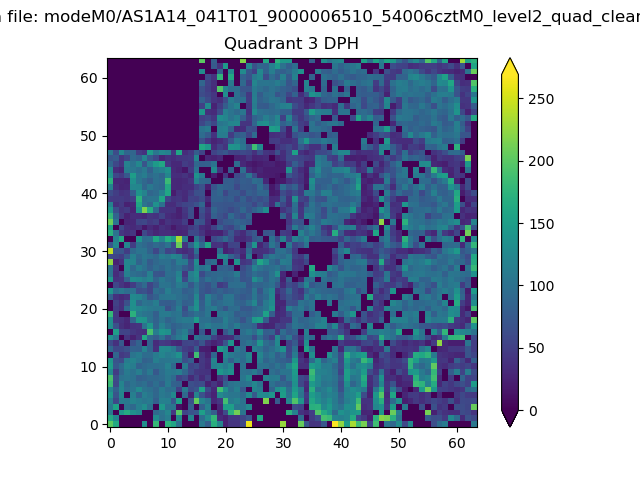 |
 |
Quadrant C |
| Plot type | Count rate plots | Images |
|---|---|---|
| Comparison with Poisson distribution Blue bars denote a histogram of data divided into 1 sec bins. Red curve is a Poisson curve with rate = median count rate of data. |
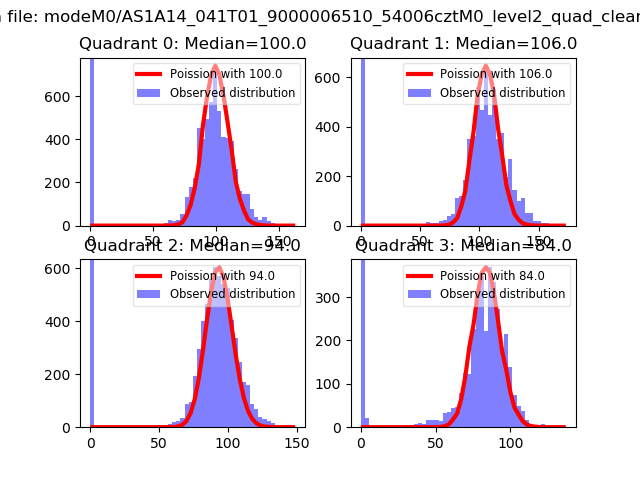 |
 |
| Quadrant-wise count rates Data is divided into 100 sec bins |
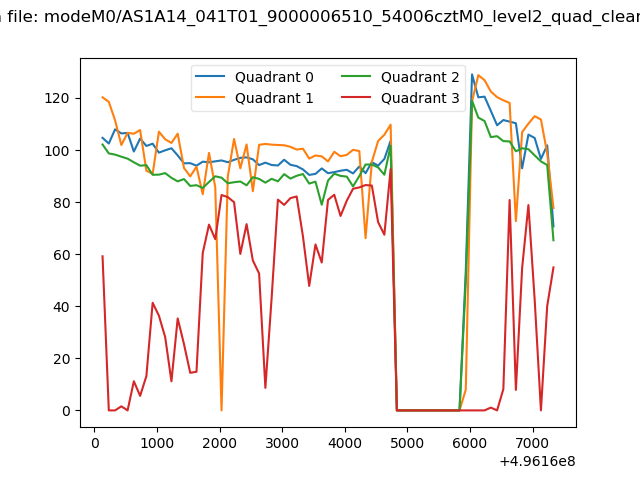 |
|
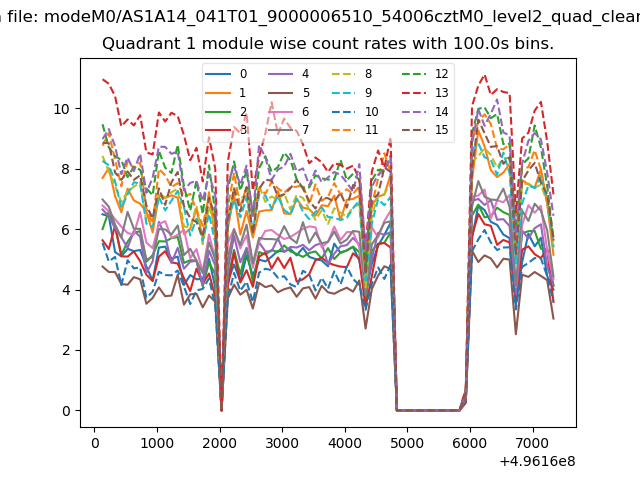
| Module-wise count rates for Quadrant A Data is divided into 100 sec bins |
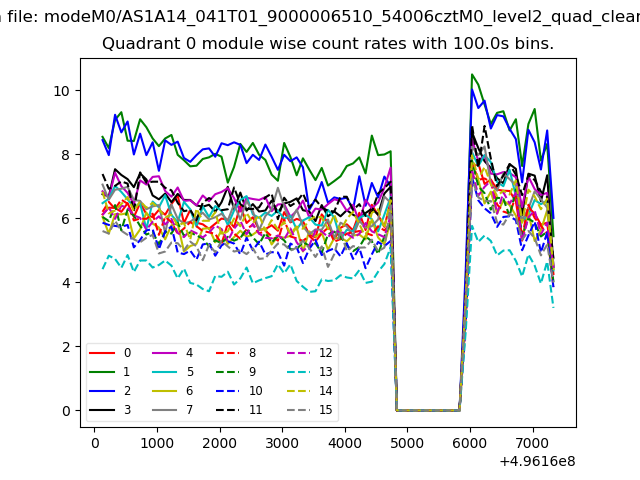 |
 |
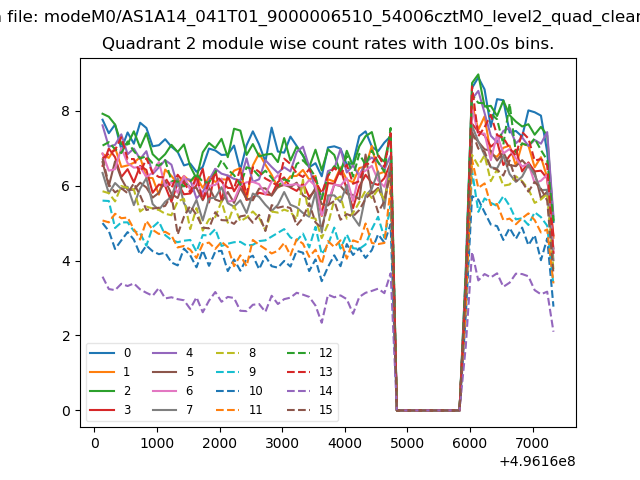
| Module-wise count rates for Quadrant B Data is divided into 100 sec bins |
 |
 |
| Module-wise count rates for Quadrant C Data is divided into 100 sec bins |
 |
 |
| Module-wise count rates for Quadrant D Data is divided into 100 sec bins |
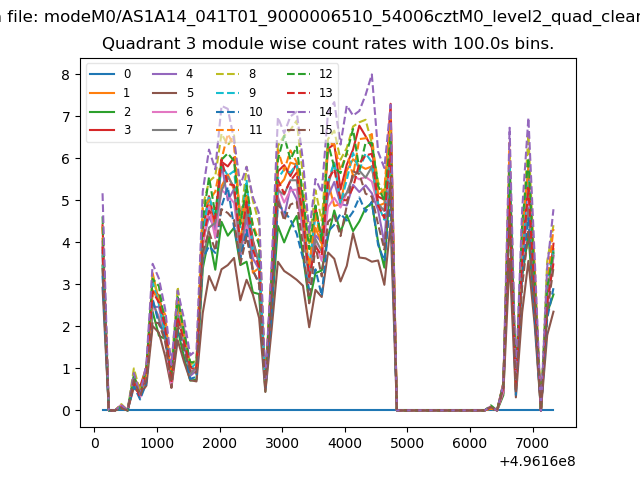 |
 |
| Parameter | Plot |
|---|---|
| CZT HV Monitor | 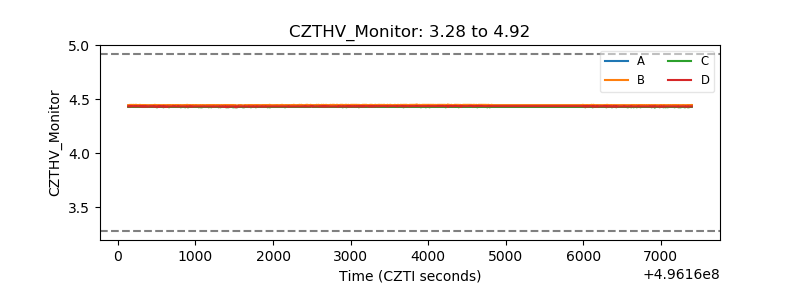 |
| D_VDD | 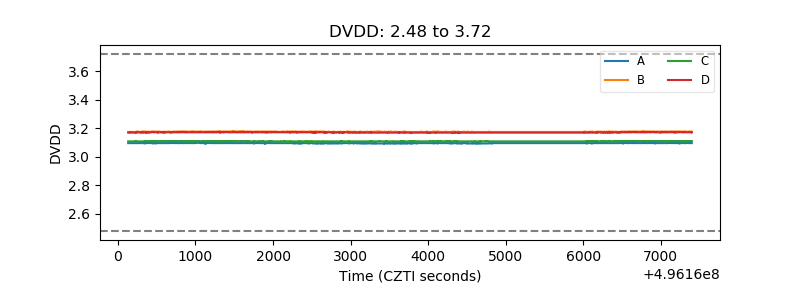 |
| Temperature 1 | 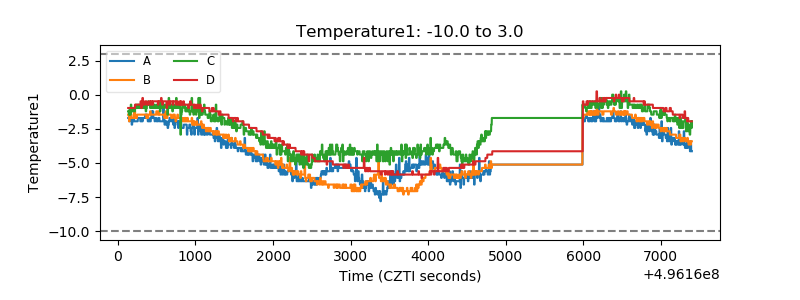 |
| Veto HV Monitor | 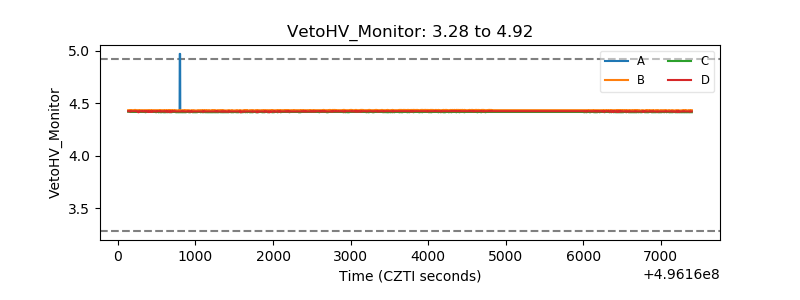 |
| Veto LLD | 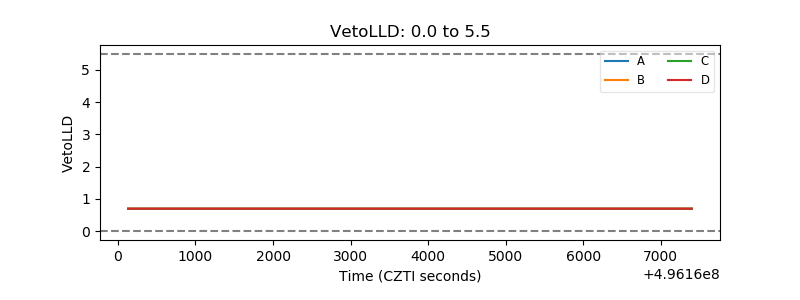 |
| Alpha Counter | 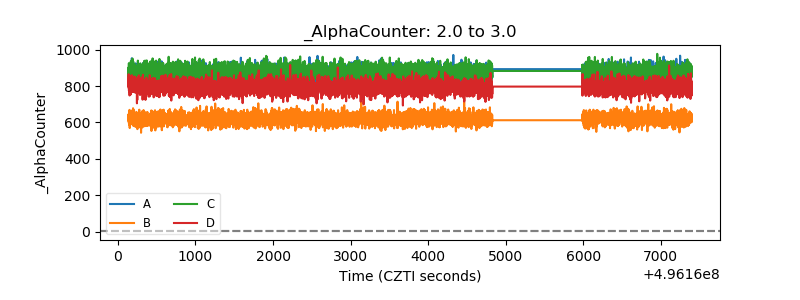 |
| _CPM_Rate | 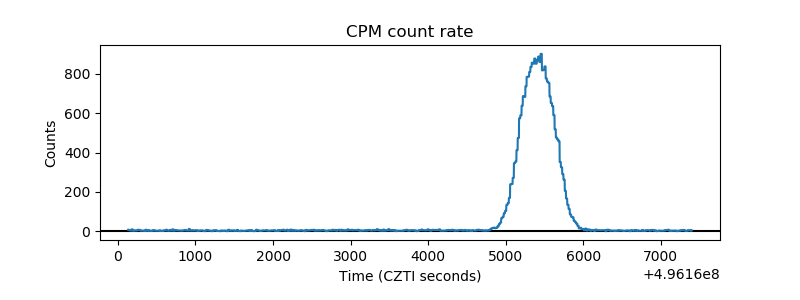 |
| CZT Counter | 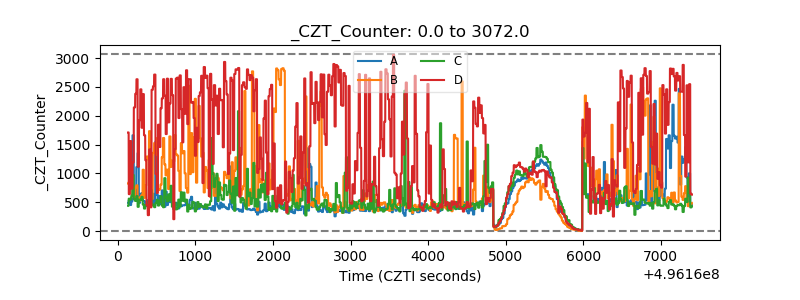 |
| +2.5 Volts monitor |  |
| +5 Volts monitor |  |
| _ROLL_ROT | 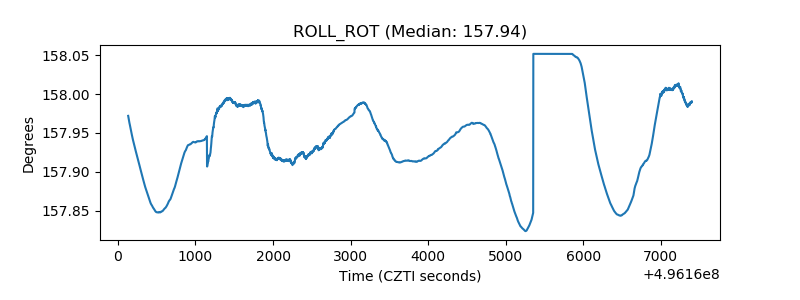 |
| _Roll_DEC | 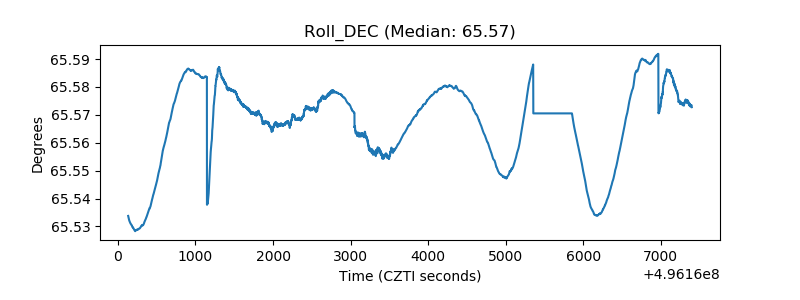 |
| _Roll_RA | 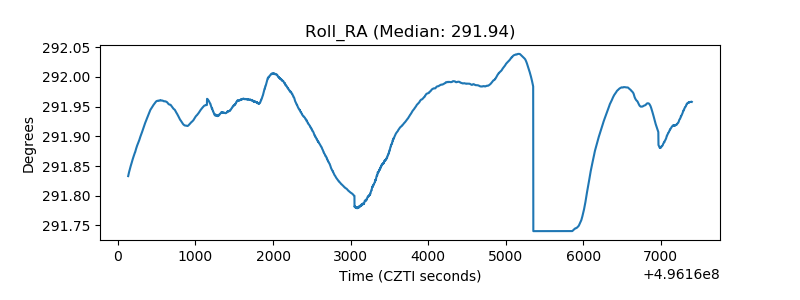 |
| Veto Counter | 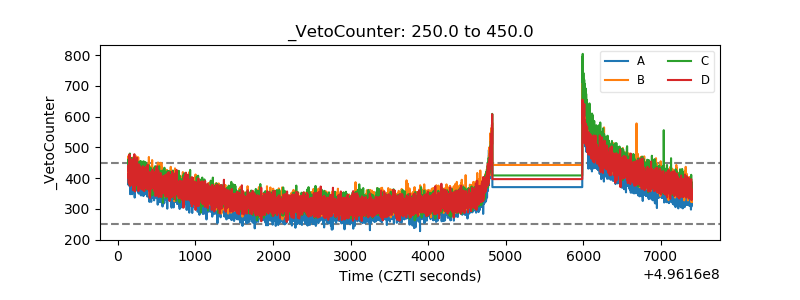 |