| Param | Original file | Final file |
|---|---|---|
| Filename | modeM0/AS1A14_041T01_9000006510_54007cztM0_level2.fits | modeM0/AS1A14_041T01_9000006510_54007cztM0_level2_quad_clean.evt |
| Size (bytes) | 694,344,960 | 84,735,360 |
| Size | 662.2 MB | 80.8 MB |
| Events in quadrant A | 5,142,977 | 596,662 |
| Events in quadrant B | 4,182,623 | 681,760 |
| Events in quadrant C | 4,170,308 | 607,872 |
| Events in quadrant D | 11,717,784 | 239,667 |
| Mode M9 | |||
|---|---|---|---|
| Quadrant | BADHDUFLAG | Total packets | Discarded packets |
| A | 0 | 13 | 0 |
| B | 0 | 14 | 0 |
| C | 0 | 14 | 0 |
| D | 0 | 14 | 0 |
| Mode SS | |||
|---|---|---|---|
| Quadrant | BADHDUFLAG | Total packets | Discarded packets |
| A | 0 | 128 | 0 |
| B | 0 | 128 | 0 |
| C | 0 | 128 | 0 |
| D | 0 | 128 | 0 |
| Mode M0 | |||
|---|---|---|---|
| Quadrant | BADHDUFLAG | Total packets | Discarded packets |
| A | 0 | 19828 | 2 |
| B | 0 | 16974 | 2 |
| C | 0 | 16625 | 3 |
| D | 0 | 39213 | 23 |
| Quadrant | Total seconds | Saturated seconds | Saturation percentage |
|---|---|---|---|
| A | 6298 | 592 | 9.399809% |
| B | 6298 | 266 | 4.223563% |
| C | 6297 | 175 | 2.779101% |
| D | 6295 | 3896 | 61.890389% |
Noise dominated data is calculated using 1-second bins in cleaned event files. If a bin has >2000 counts, and if more than 50% of those come from <1% of pixels, then it is considered to be noise-dominated and hence unusable.
| Quadrant | # 1 sec bins | Bins with >0 counts | Bins with >2000 counts | High rate bins dominated by noise | Noise dominated (total time) | Noise dominated (detector-on time) | Marked lightcurve |
|---|---|---|---|---|---|---|---|
| A | 7523 | 6299 | 640 | 640 | 8.51% | 10.16% | 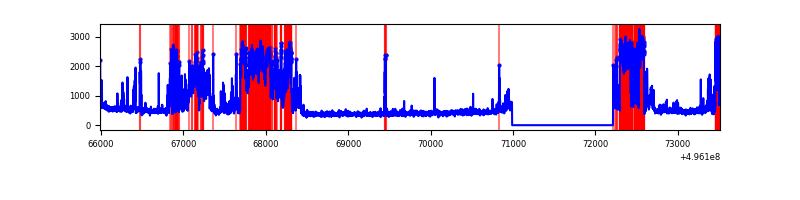 |
| B | 7523 | 6299 | 185 | 185 | 2.46% | 2.94% | 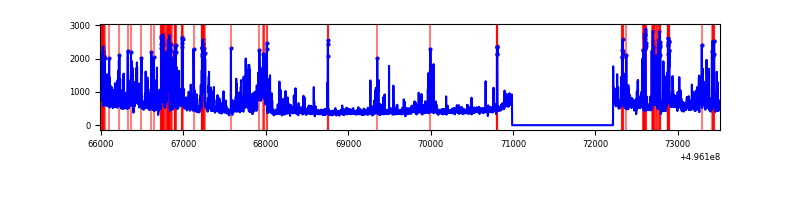 |
| C | 7523 | 6299 | 157 | 157 | 2.09% | 2.49% | 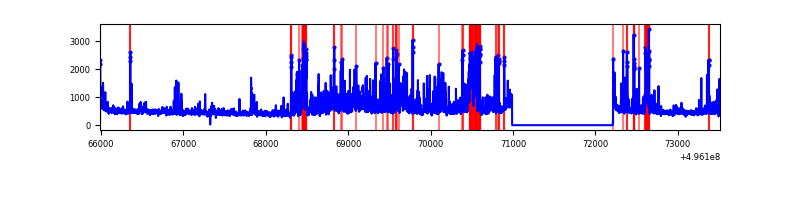 |
| D | 7522 | 6297 | 3495 | 3495 | 46.46% | 55.50% | 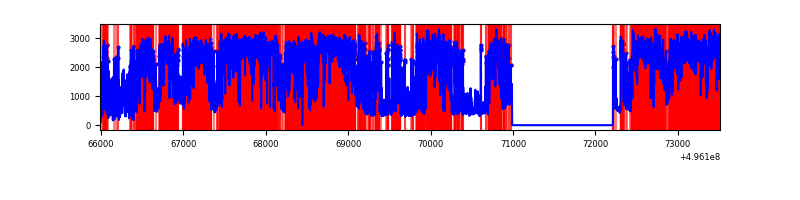 |
Top three noisy pixels from each quadrant. If the there are fewer than three noisy pixels in the level2.evt file, extra rows are filled as -1
| Pixel properties | Quadrant properties | ||||||
|---|---|---|---|---|---|---|---|
| Quadrant | DetID | PixID | Counts | Sigma | Mean | Median | Sigma |
| A | 12 | 115 | 1299762 | 8020.07 | 653 | 638 | 162.0 |
| A | 15 | 174 | 1097084 | 6768.85 | 653 | 638 | 162.0 |
| A | 0 | 8 | 54538 | 332.75 | 653 | 638 | 162.0 |
| B | 0 | 213 | 370466 | 2623.08 | 672 | 648 | 141.0 |
| B | 0 | 155 | 330365 | 2338.65 | 672 | 648 | 141.0 |
| B | 2 | 249 | 166153 | 1173.91 | 672 | 648 | 141.0 |
| C | 12 | 250 | 742834 | 4022.54 | 672 | 665 | 184.5 |
| C | 14 | 80 | 412366 | 2231.41 | 672 | 665 | 184.5 |
| C | 9 | 53 | 128866 | 694.84 | 672 | 665 | 184.5 |
| D | 8 | 176 | 9022625 | 75137.53 | 415 | 396 | 120.1 |
| D | 14 | 52 | 178042 | 1479.44 | 415 | 396 | 120.1 |
| D | 6 | 239 | 160450 | 1332.94 | 415 | 396 | 120.1 |
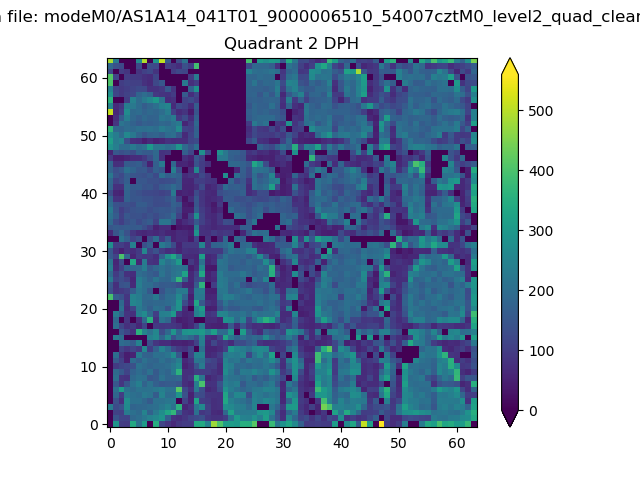
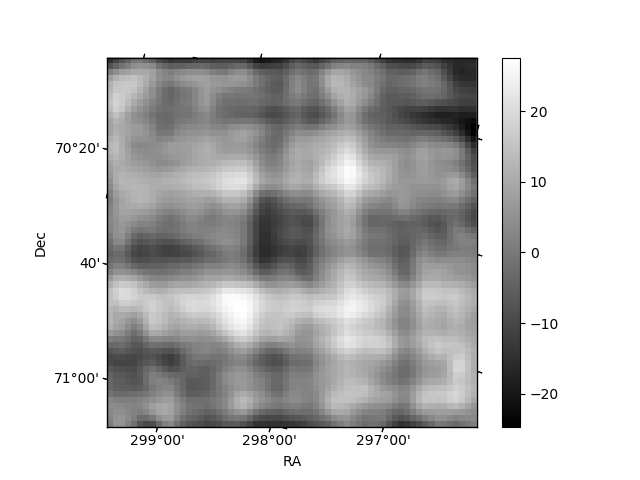
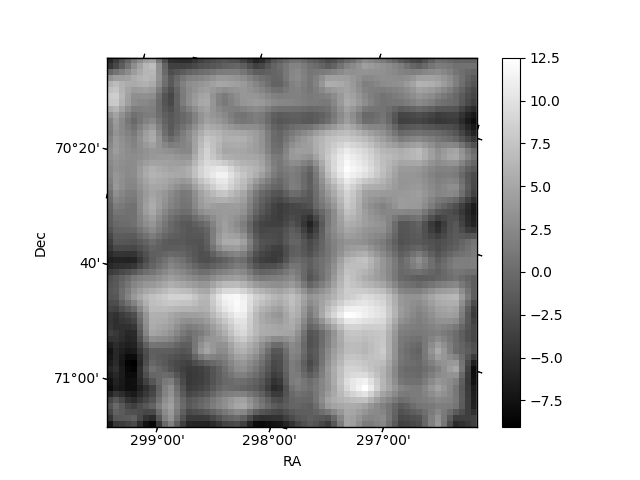
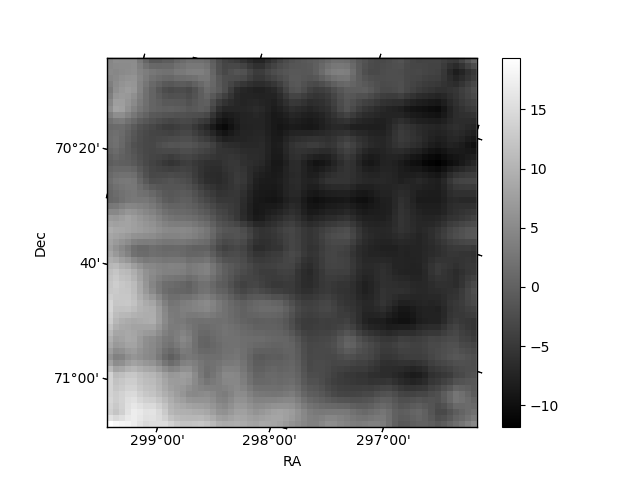
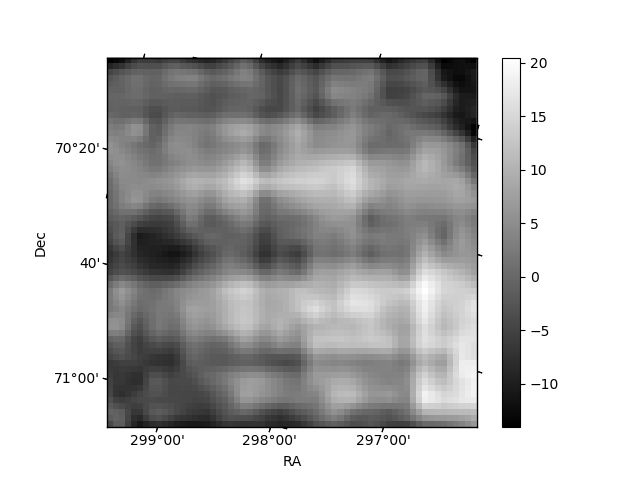
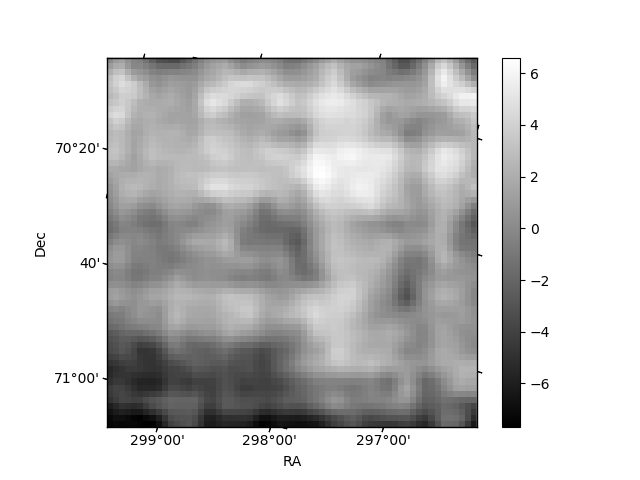
Histogram calculated using DETX and DETY for each event in the final _common_clean file
| Quadrant A | 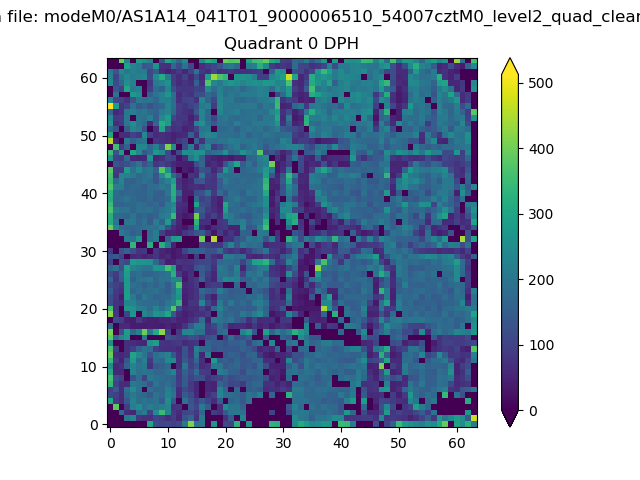 |
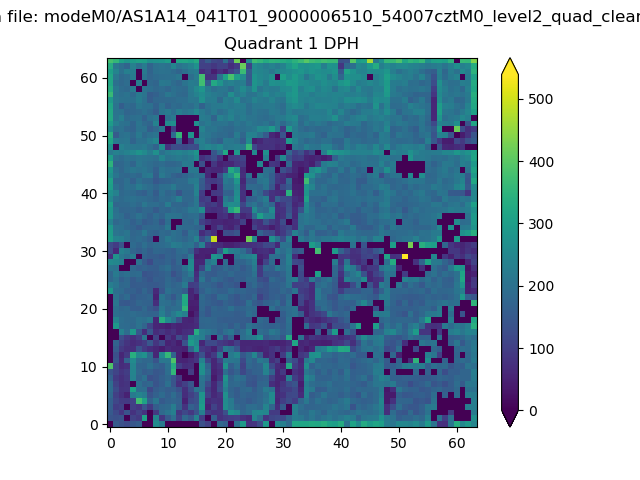 |
Quadrant B |
|---|---|---|---|
| Quadrant D | 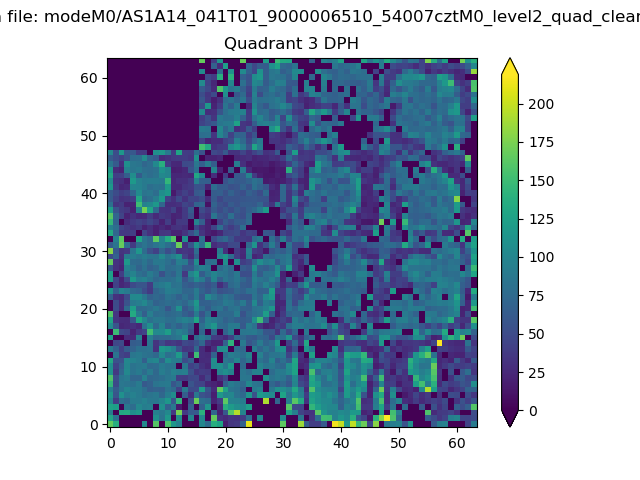 |
 |
Quadrant C |
| Plot type | Count rate plots | Images |
|---|---|---|
| Comparison with Poisson distribution Blue bars denote a histogram of data divided into 1 sec bins. Red curve is a Poisson curve with rate = median count rate of data. |
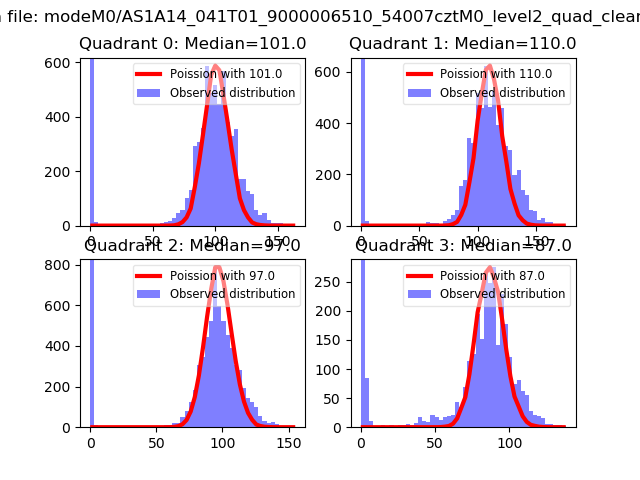 |
 |
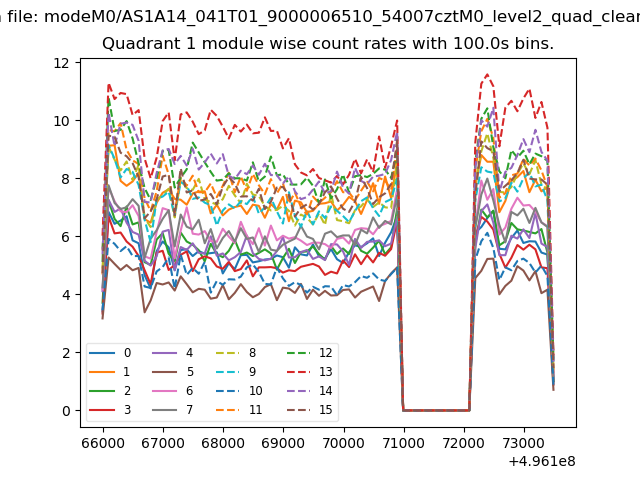
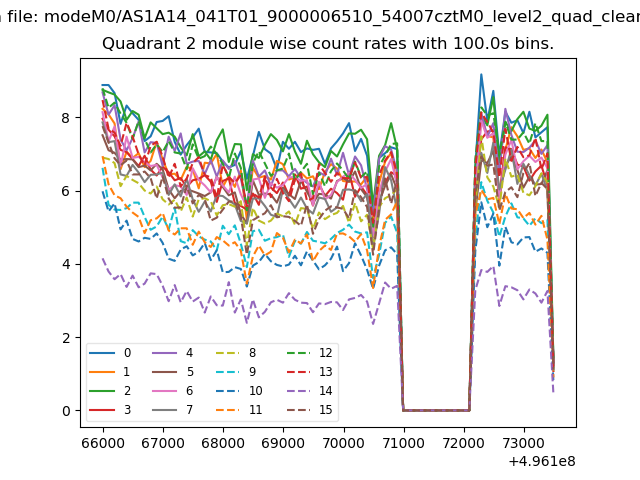
| Quadrant-wise count rates Data is divided into 100 sec bins |
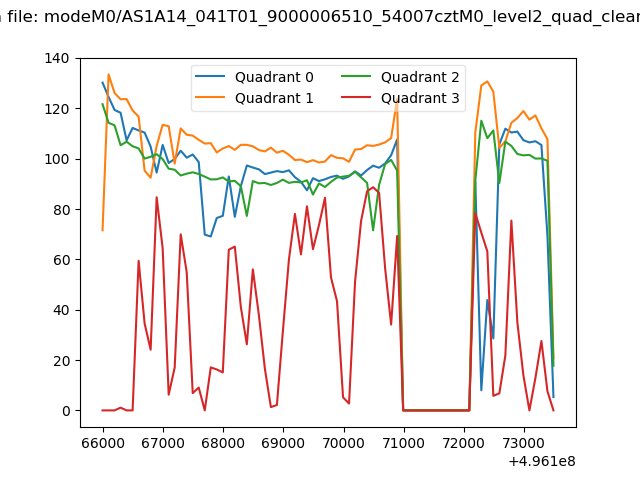 |
|
| Module-wise count rates for Quadrant A Data is divided into 100 sec bins |
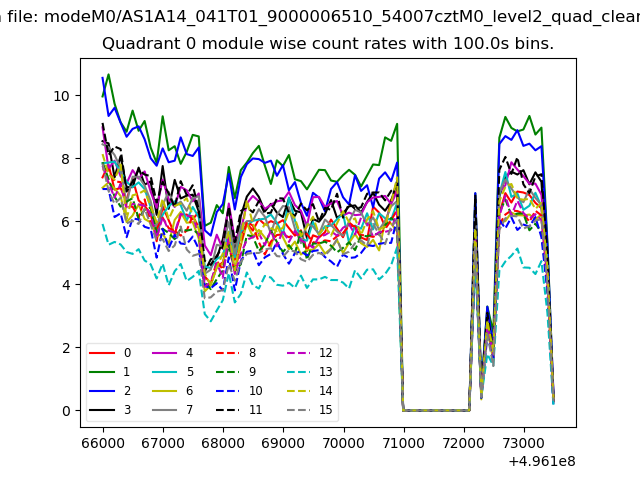 |
 |
| Module-wise count rates for Quadrant B Data is divided into 100 sec bins |
 |
 |
| Module-wise count rates for Quadrant C Data is divided into 100 sec bins |
 |
 |
| Module-wise count rates for Quadrant D Data is divided into 100 sec bins |
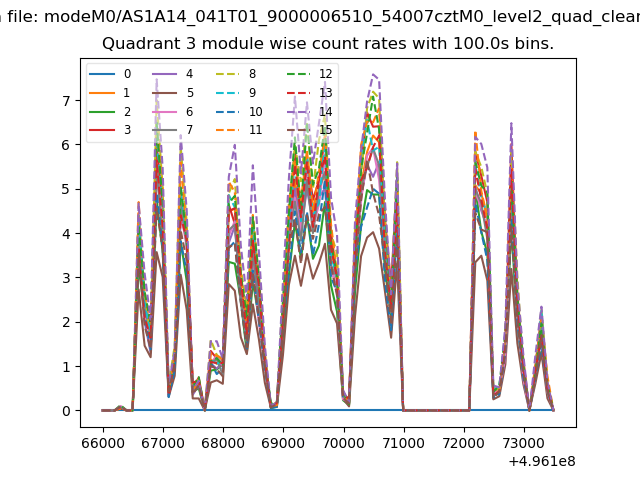 |
 |
| Parameter | Plot |
|---|---|
| CZT HV Monitor | 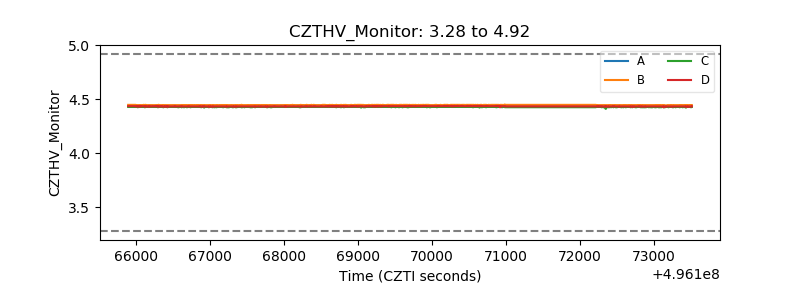 |
| D_VDD | 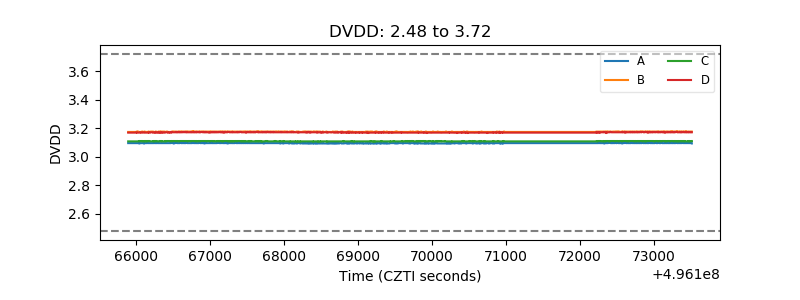 |
| Temperature 1 | 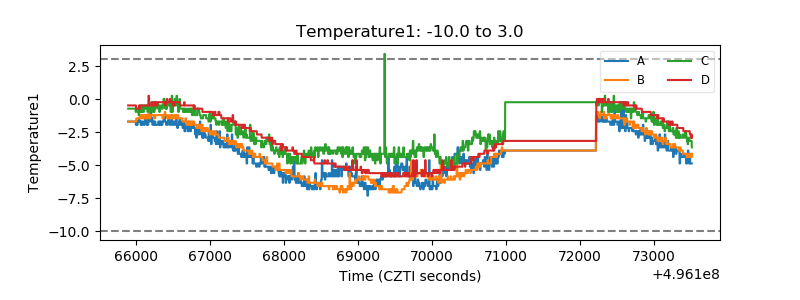 |
| Veto HV Monitor | 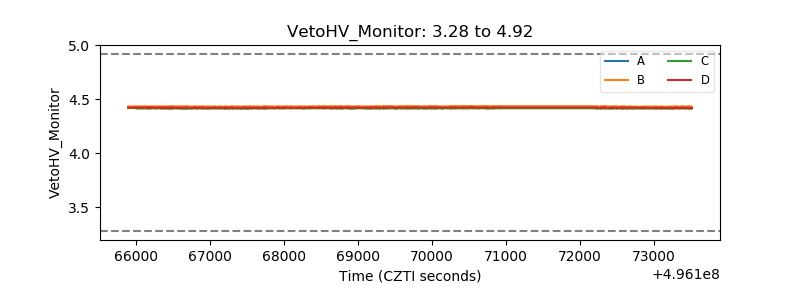 |
| Veto LLD | 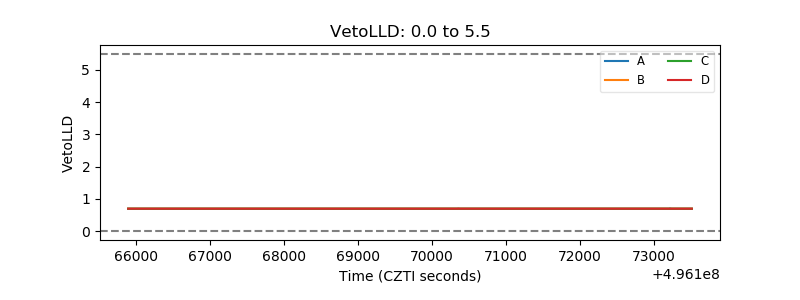 |
| Alpha Counter | 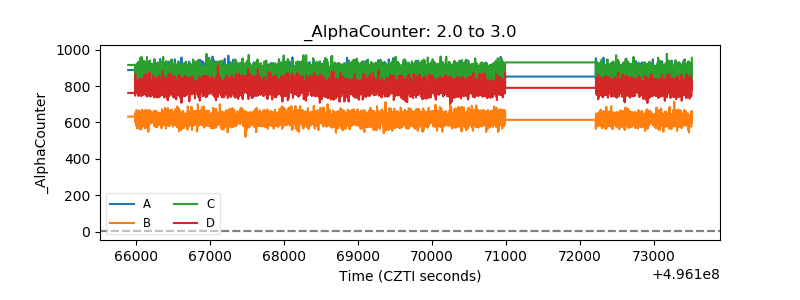 |
| _CPM_Rate | 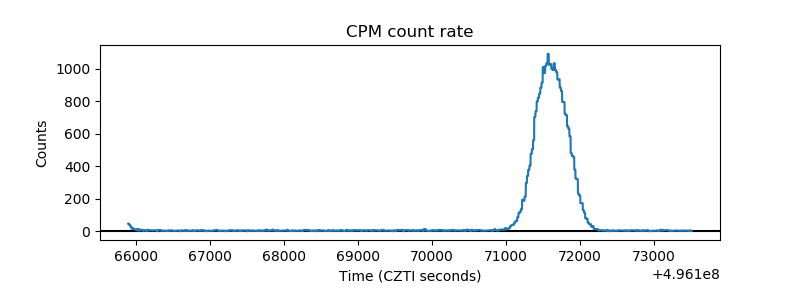 |
| CZT Counter | 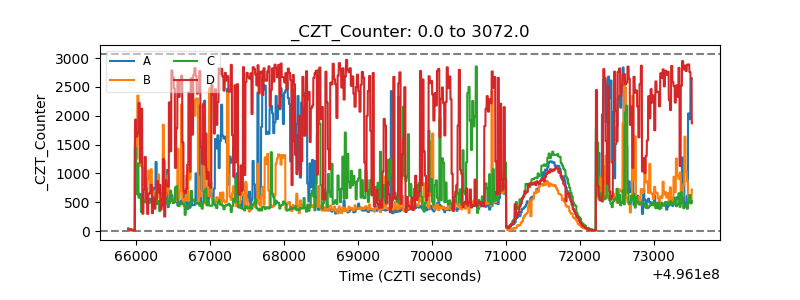 |
| +2.5 Volts monitor |  |
| +5 Volts monitor | 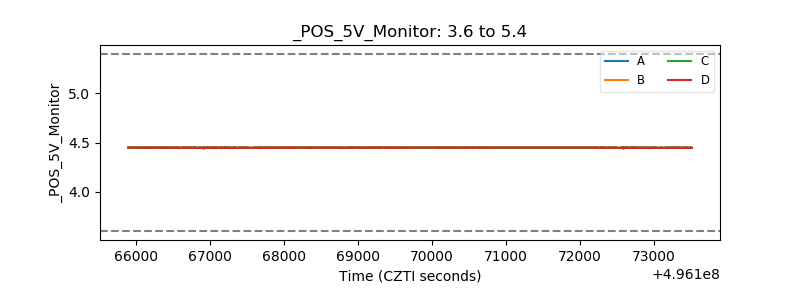 |
| _ROLL_ROT | 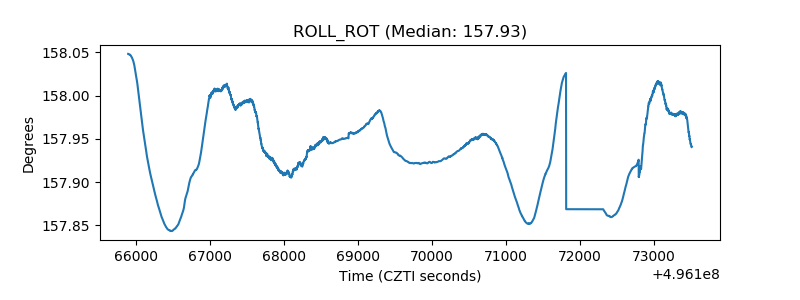 |
| _Roll_DEC | 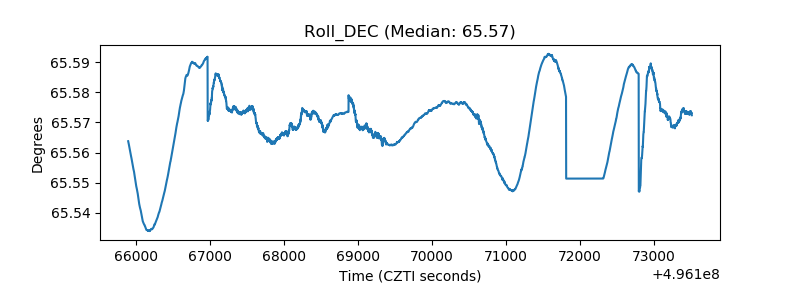 |
| _Roll_RA | 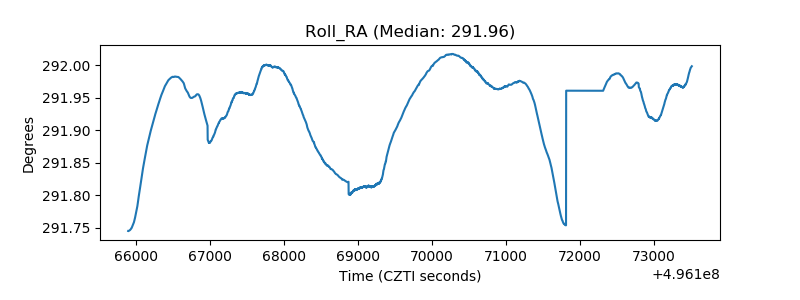 |
| Veto Counter | 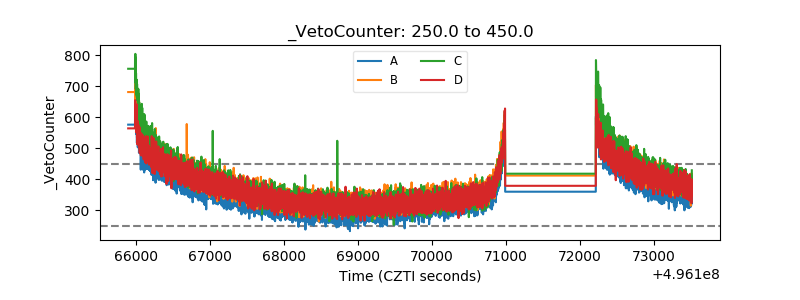 |