| Param | Original file | Final file |
|---|---|---|
| Filename | modeM0/AS1A14_041T01_9000006510_54008cztM0_level2.fits | modeM0/AS1A14_041T01_9000006510_54008cztM0_level2_quad_clean.evt |
| Size (bytes) | 601,678,080 | 84,611,520 |
| Size | 573.8 MB | 80.7 MB |
| Events in quadrant A | 4,079,880 | 572,548 |
| Events in quadrant B | 3,640,256 | 671,244 |
| Events in quadrant C | 3,171,923 | 599,033 |
| Events in quadrant D | 10,900,064 | 288,206 |
| Mode M9 | |||
|---|---|---|---|
| Quadrant | BADHDUFLAG | Total packets | Discarded packets |
| A | 0 | 13 | 0 |
| B | 0 | 13 | 0 |
| C | 0 | 13 | 0 |
| D | 0 | 13 | 0 |
| Mode SS | |||
|---|---|---|---|
| Quadrant | BADHDUFLAG | Total packets | Discarded packets |
| A | 0 | 124 | 0 |
| B | 0 | 124 | 0 |
| C | 0 | 124 | 0 |
| D | 0 | 124 | 0 |
| Mode M0 | |||
|---|---|---|---|
| Quadrant | BADHDUFLAG | Total packets | Discarded packets |
| A | 0 | 16734 | 1 |
| B | 0 | 15276 | 1 |
| C | 0 | 13920 | 1 |
| D | 0 | 36671 | 1 |
| Quadrant | Total seconds | Saturated seconds | Saturation percentage |
|---|---|---|---|
| A | 6177 | 524 | 8.483082% |
| B | 6177 | 206 | 3.334952% |
| C | 6178 | 102 | 1.651020% |
| D | 6178 | 3138 | 50.793137% |
Noise dominated data is calculated using 1-second bins in cleaned event files. If a bin has >2000 counts, and if more than 50% of those come from <1% of pixels, then it is considered to be noise-dominated and hence unusable.
| Quadrant | # 1 sec bins | Bins with >0 counts | Bins with >2000 counts | High rate bins dominated by noise | Noise dominated (total time) | Noise dominated (detector-on time) | Marked lightcurve |
|---|---|---|---|---|---|---|---|
| A | 7417 | 6178 | 466 | 466 | 6.28% | 7.54% | 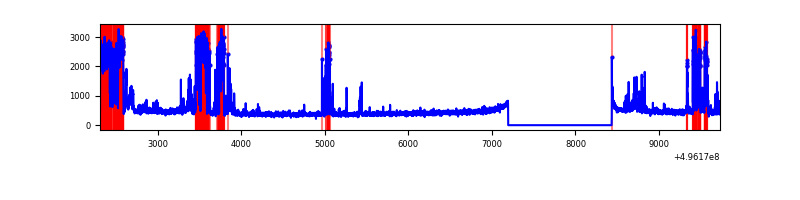 |
| B | 7417 | 6178 | 124 | 124 | 1.67% | 2.01% | 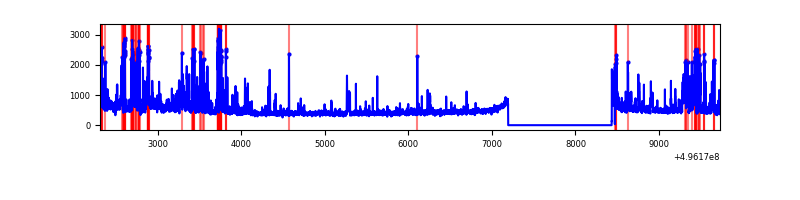 |
| C | 7418 | 6179 | 77 | 77 | 1.04% | 1.25% | 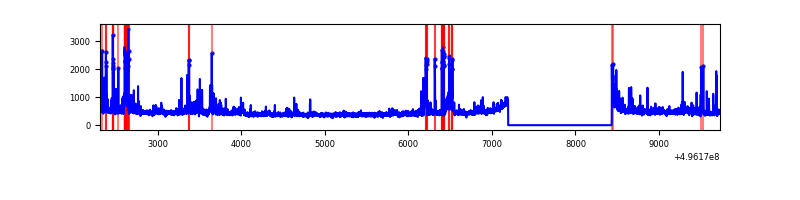 |
| D | 7418 | 6179 | 3134 | 3134 | 42.25% | 50.72% | 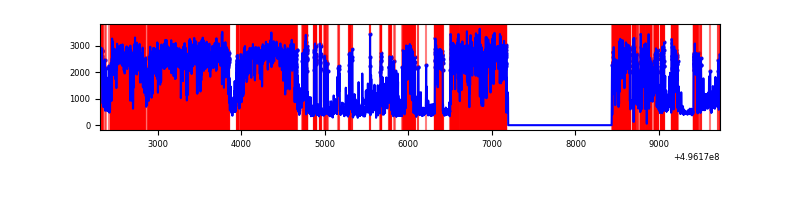 |
Top three noisy pixels from each quadrant. If the there are fewer than three noisy pixels in the level2.evt file, extra rows are filled as -1
| Pixel properties | Quadrant properties | ||||||
|---|---|---|---|---|---|---|---|
| Quadrant | DetID | PixID | Counts | Sigma | Mean | Median | Sigma |
| A | 15 | 174 | 1489495 | 9605.7 | 623 | 607 | 155.0 |
| A | 8 | 6 | 82277 | 526.9 | 623 | 607 | 155.0 |
| A | 0 | 8 | 26427 | 166.58 | 623 | 607 | 155.0 |
| B | 0 | 213 | 363797 | 2616.2 | 657 | 634 | 138.8 |
| B | 5 | 250 | 242223 | 1740.39 | 657 | 634 | 138.8 |
| B | 0 | 155 | 156676 | 1124.12 | 657 | 634 | 138.8 |
| C | 14 | 80 | 190764 | 1052.69 | 657 | 650 | 180.6 |
| C | 9 | 53 | 158961 | 876.6 | 657 | 650 | 180.6 |
| C | 12 | 250 | 153242 | 844.93 | 657 | 650 | 180.6 |
| D | 8 | 176 | 8138631 | 63019.9 | 447 | 426 | 129.1 |
| D | 2 | 172 | 171007 | 1320.93 | 447 | 426 | 129.1 |
| D | 6 | 127 | 167891 | 1296.8 | 447 | 426 | 129.1 |
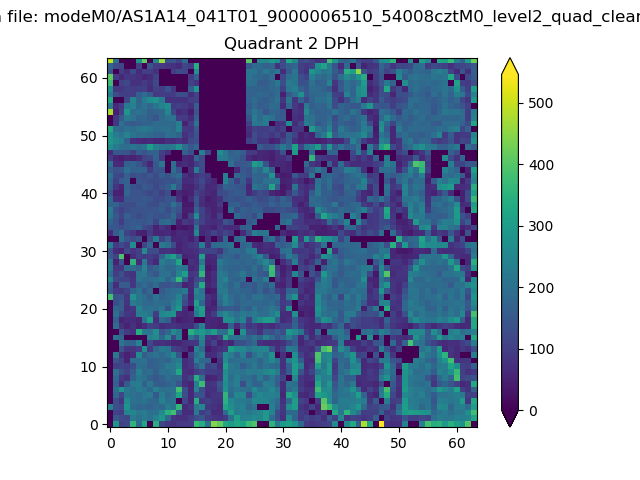
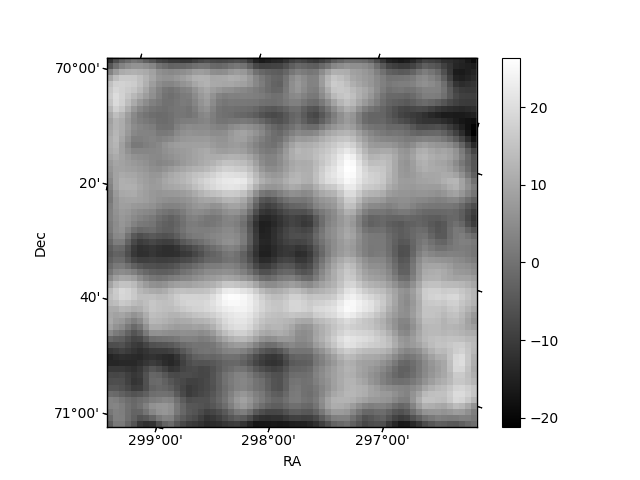
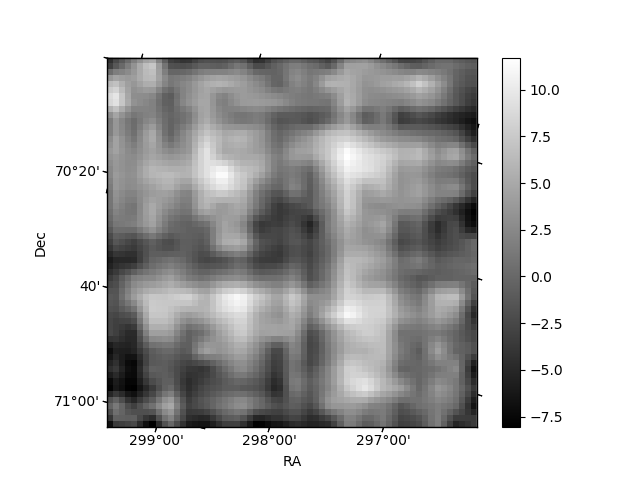
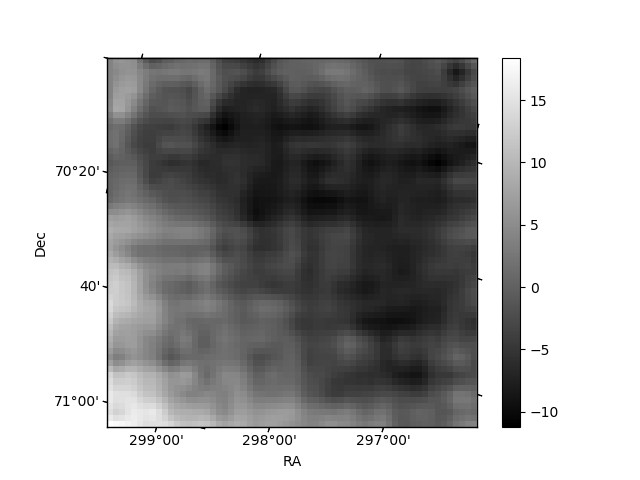
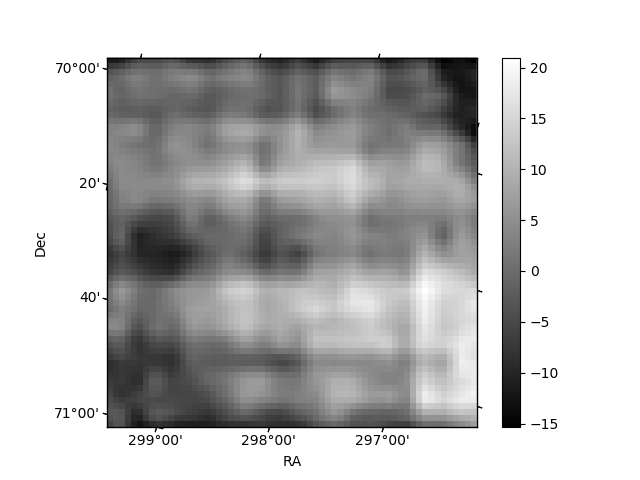
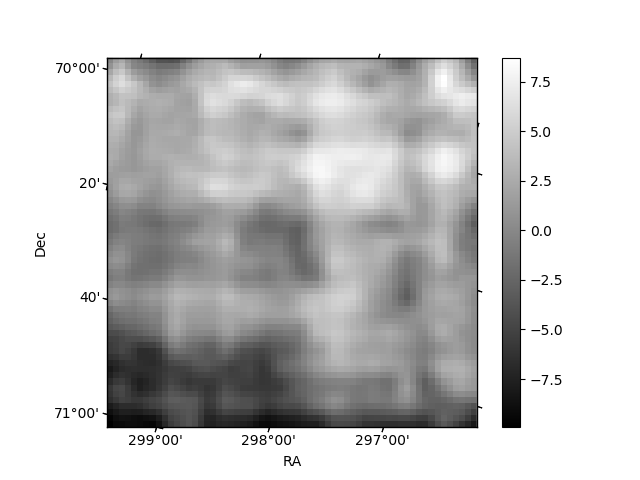
Histogram calculated using DETX and DETY for each event in the final _common_clean file
| Quadrant A | 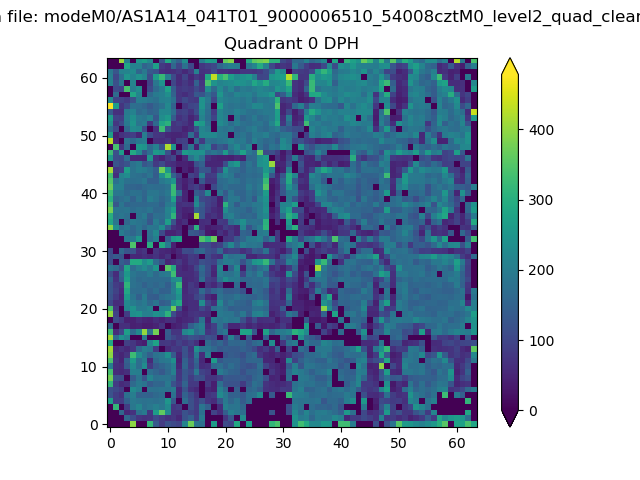 |
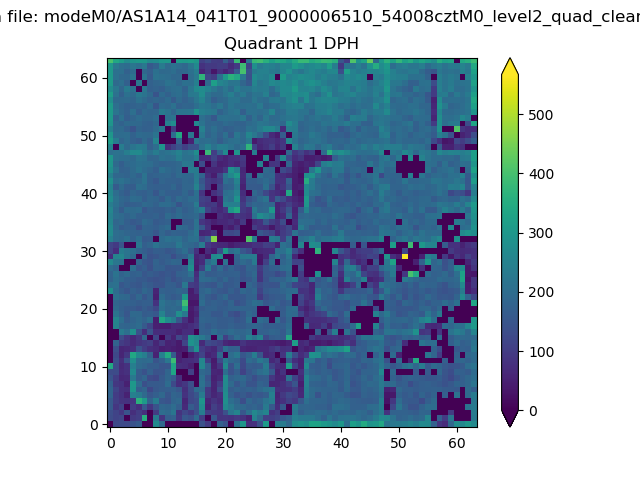 |
Quadrant B |
|---|---|---|---|
| Quadrant D | 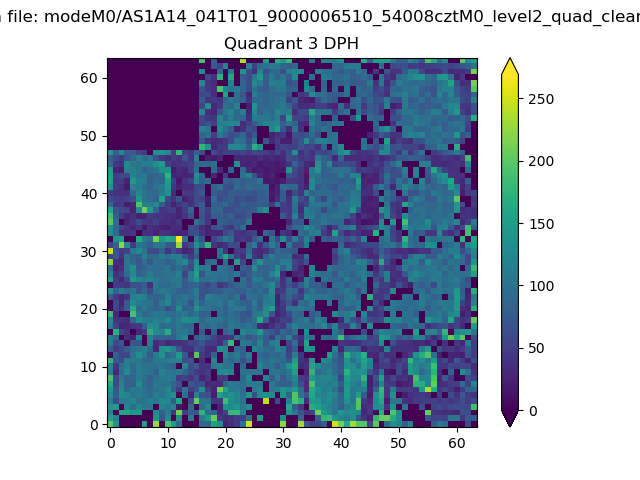 |
 |
Quadrant C |
| Plot type | Count rate plots | Images |
|---|---|---|
| Comparison with Poisson distribution Blue bars denote a histogram of data divided into 1 sec bins. Red curve is a Poisson curve with rate = median count rate of data. |
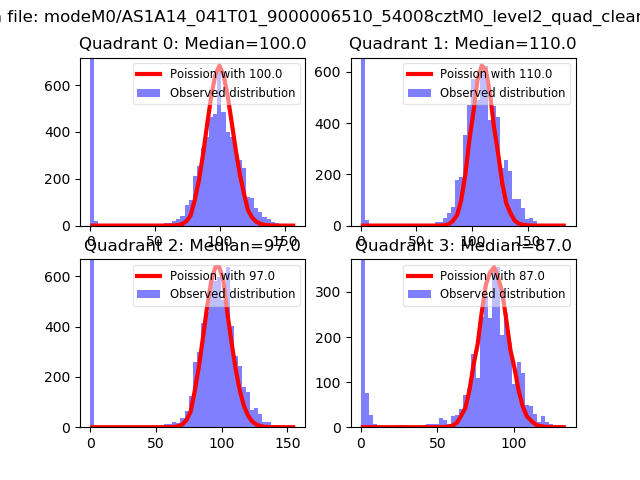 |
 |
| Quadrant-wise count rates Data is divided into 100 sec bins |
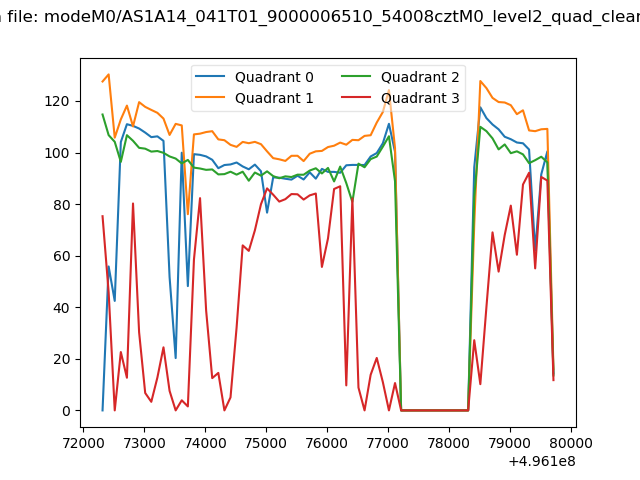 |
|
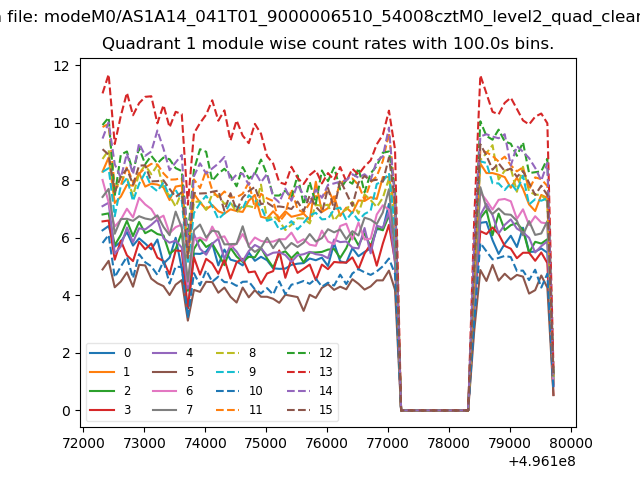
| Module-wise count rates for Quadrant A Data is divided into 100 sec bins |
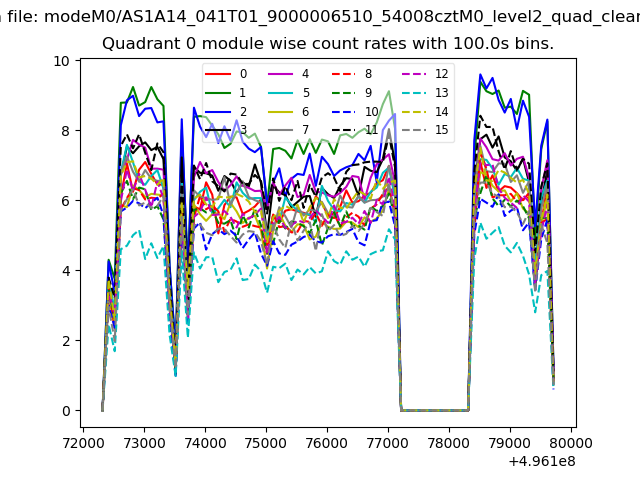 |
 |
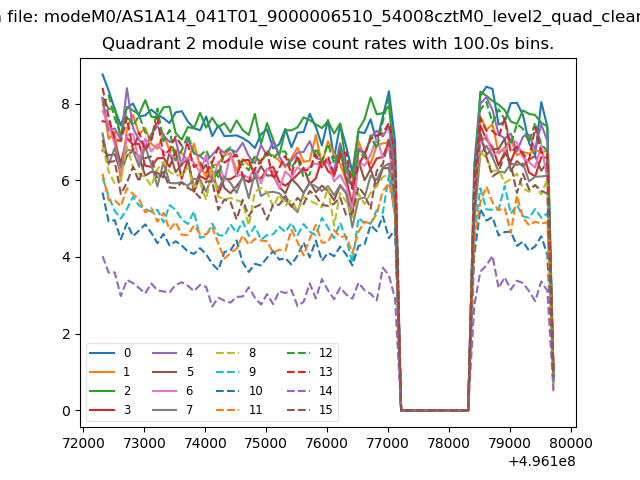
| Module-wise count rates for Quadrant B Data is divided into 100 sec bins |
 |
 |
| Module-wise count rates for Quadrant C Data is divided into 100 sec bins |
 |
 |
| Module-wise count rates for Quadrant D Data is divided into 100 sec bins |
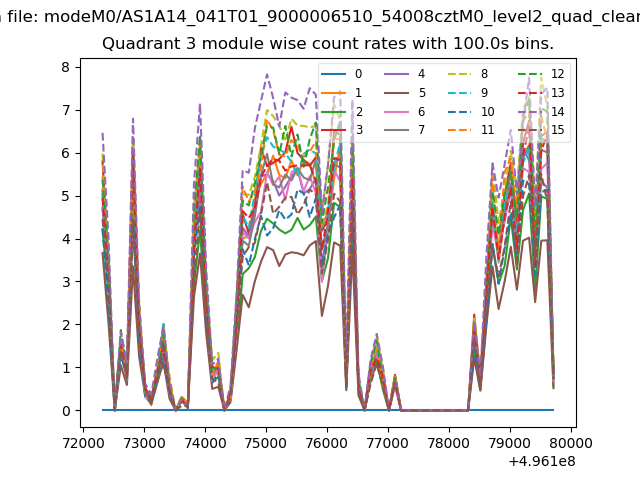 |
 |
| Parameter | Plot |
|---|---|
| CZT HV Monitor | 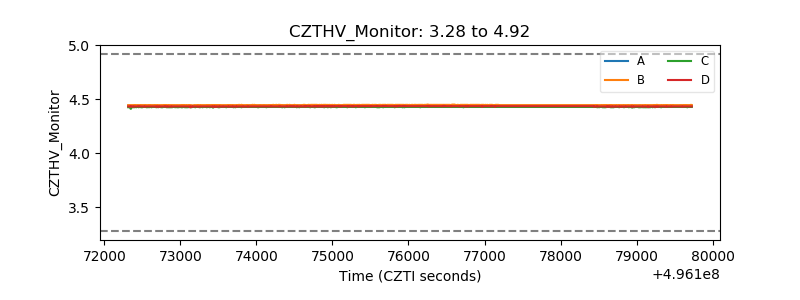 |
| D_VDD | 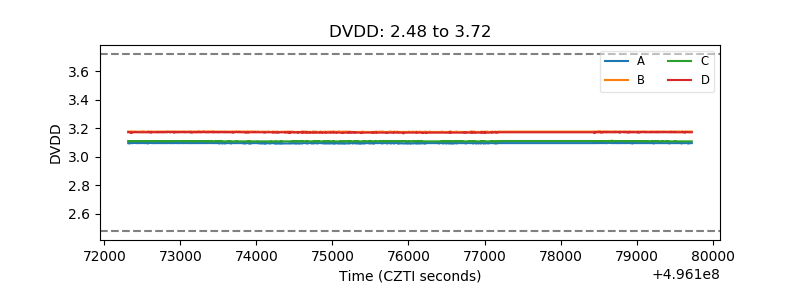 |
| Temperature 1 | 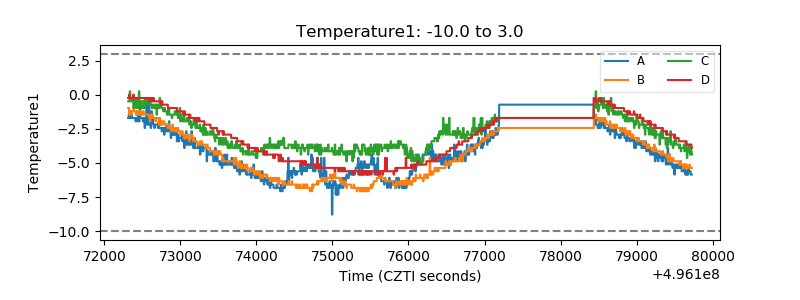 |
| Veto HV Monitor | 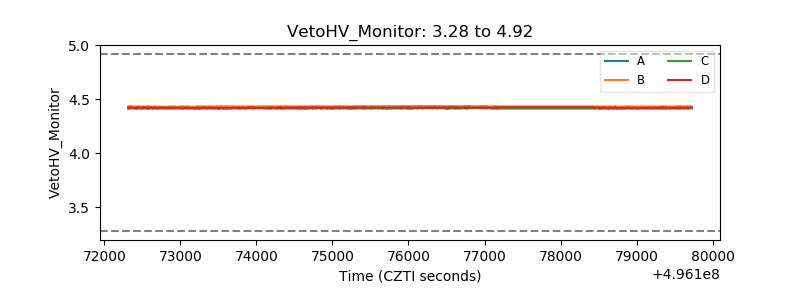 |
| Veto LLD | 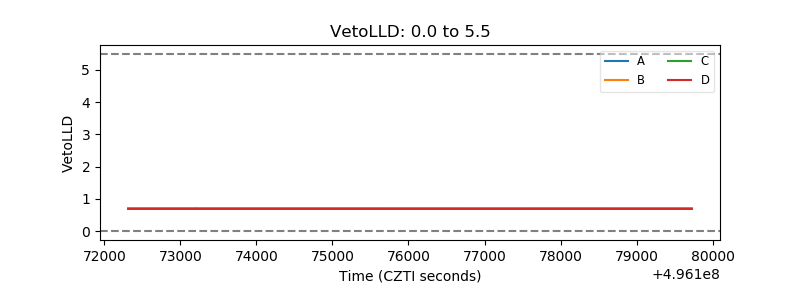 |
| Alpha Counter | 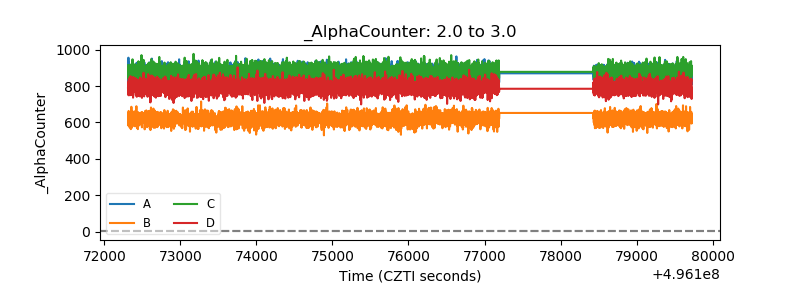 |
| _CPM_Rate | 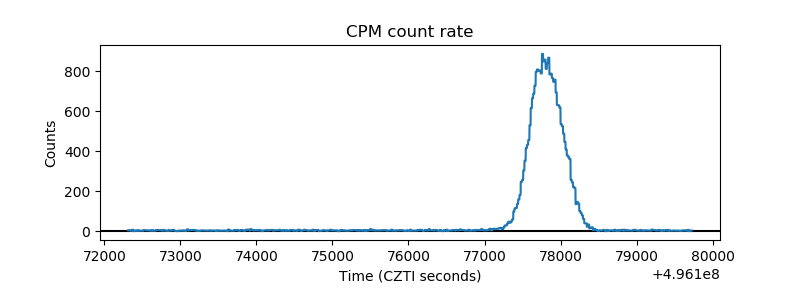 |
| CZT Counter | 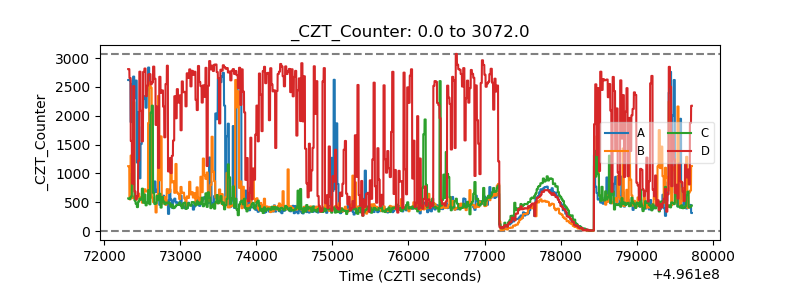 |
| +2.5 Volts monitor |  |
| +5 Volts monitor |  |
| _ROLL_ROT | 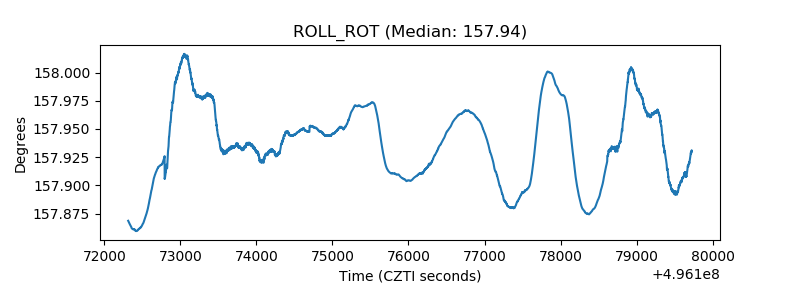 |
| _Roll_DEC | 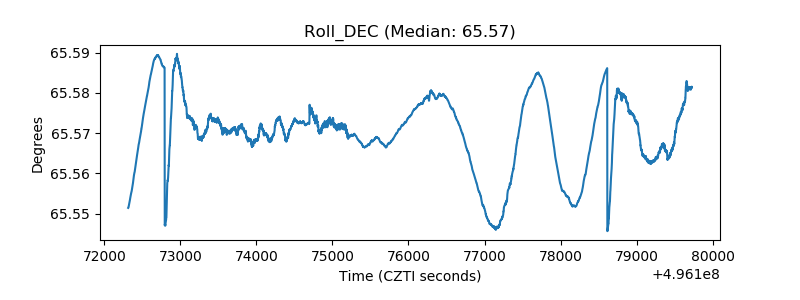 |
| _Roll_RA | 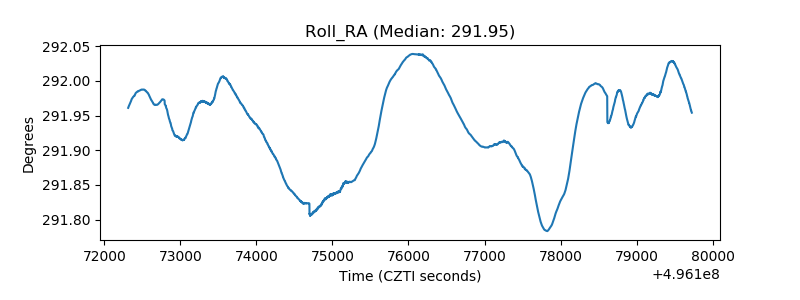 |
| Veto Counter | 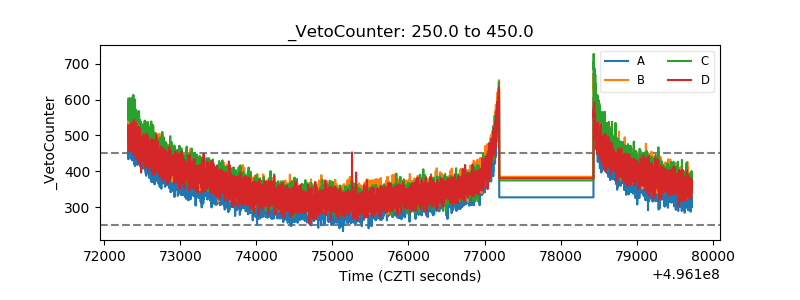 |