| Param | Original file | Final file |
|---|---|---|
| Filename | modeM0/AS1A14_041T01_9000006510_54009cztM0_level2.fits | modeM0/AS1A14_041T01_9000006510_54009cztM0_level2_quad_clean.evt |
| Size (bytes) | 625,412,160 | 87,744,960 |
| Size | 596.4 MB | 83.7 MB |
| Events in quadrant A | 4,251,157 | 598,027 |
| Events in quadrant B | 3,476,139 | 701,273 |
| Events in quadrant C | 3,325,770 | 617,201 |
| Events in quadrant D | 11,591,494 | 286,518 |
| Mode M9 | |||
|---|---|---|---|
| Quadrant | BADHDUFLAG | Total packets | Discarded packets |
| A | 0 | 17 | 0 |
| B | 0 | 18 | 0 |
| C | 0 | 18 | 0 |
| D | 0 | 18 | 0 |
| Mode SS | |||
|---|---|---|---|
| Quadrant | BADHDUFLAG | Total packets | Discarded packets |
| A | 0 | 130 | 0 |
| B | 0 | 130 | 0 |
| C | 0 | 130 | 0 |
| D | 0 | 130 | 0 |
| Mode M0 | |||
|---|---|---|---|
| Quadrant | BADHDUFLAG | Total packets | Discarded packets |
| A | 0 | 17526 | 2 |
| B | 0 | 15045 | 2 |
| C | 0 | 14521 | 2 |
| D | 0 | 38976 | 14 |
| Quadrant | Total seconds | Saturated seconds | Saturation percentage |
|---|---|---|---|
| A | 6513 | 528 | 8.106863% |
| B | 6513 | 128 | 1.965300% |
| C | 6513 | 66 | 1.013358% |
| D | 6511 | 3441 | 52.849025% |
Noise dominated data is calculated using 1-second bins in cleaned event files. If a bin has >2000 counts, and if more than 50% of those come from <1% of pixels, then it is considered to be noise-dominated and hence unusable.
| Quadrant | # 1 sec bins | Bins with >0 counts | Bins with >2000 counts | High rate bins dominated by noise | Noise dominated (total time) | Noise dominated (detector-on time) | Marked lightcurve |
|---|---|---|---|---|---|---|---|
| A | 7653 | 6514 | 477 | 477 | 6.23% | 7.32% | 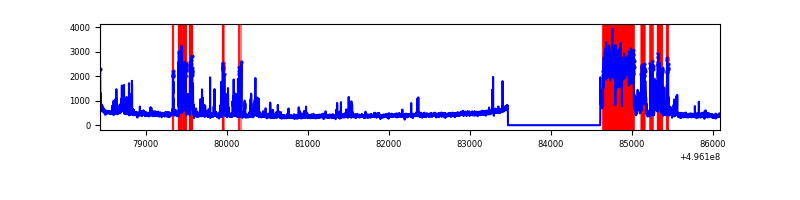 |
| B | 7653 | 6514 | 48 | 48 | 0.63% | 0.74% | 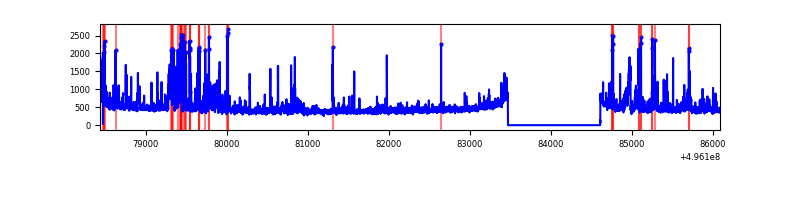 |
| C | 7653 | 6514 | 21 | 21 | 0.27% | 0.32% | 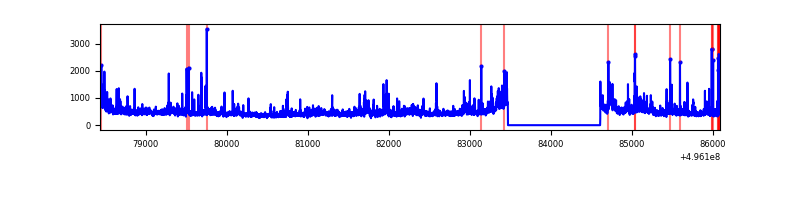 |
| D | 7652 | 6513 | 3131 | 3131 | 40.92% | 48.07% | 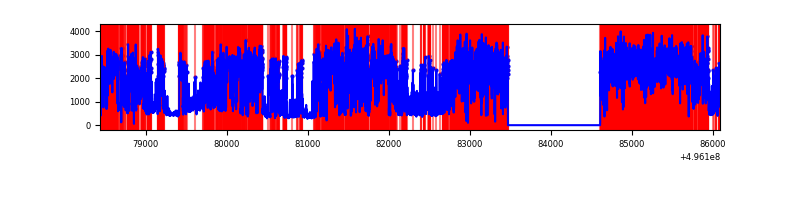 |
Top three noisy pixels from each quadrant. If the there are fewer than three noisy pixels in the level2.evt file, extra rows are filled as -1
| Pixel properties | Quadrant properties | ||||||
|---|---|---|---|---|---|---|---|
| Quadrant | DetID | PixID | Counts | Sigma | Mean | Median | Sigma |
| A | 15 | 174 | 1475906 | 9051.52 | 653 | 637 | 163.0 |
| A | 8 | 6 | 99645 | 607.46 | 653 | 637 | 163.0 |
| A | 0 | 8 | 67124 | 407.93 | 653 | 637 | 163.0 |
| B | 0 | 213 | 269385 | 1846.16 | 690 | 667 | 145.6 |
| B | 5 | 250 | 122228 | 835.15 | 690 | 667 | 145.6 |
| B | 5 | 185 | 79409 | 540.98 | 690 | 667 | 145.6 |
| C | 12 | 250 | 295618 | 1560.92 | 683 | 677 | 189.0 |
| C | 13 | 3 | 81297 | 426.66 | 683 | 677 | 189.0 |
| C | 14 | 80 | 45254 | 235.91 | 683 | 677 | 189.0 |
| D | 8 | 176 | 9061801 | 71802.16 | 437 | 417 | 126.2 |
| D | 12 | 2 | 292791 | 2316.76 | 437 | 417 | 126.2 |
| D | 2 | 165 | 126502 | 999.09 | 437 | 417 | 126.2 |
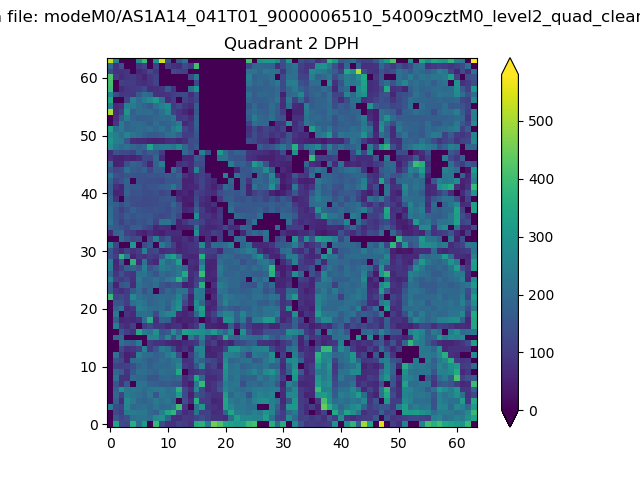
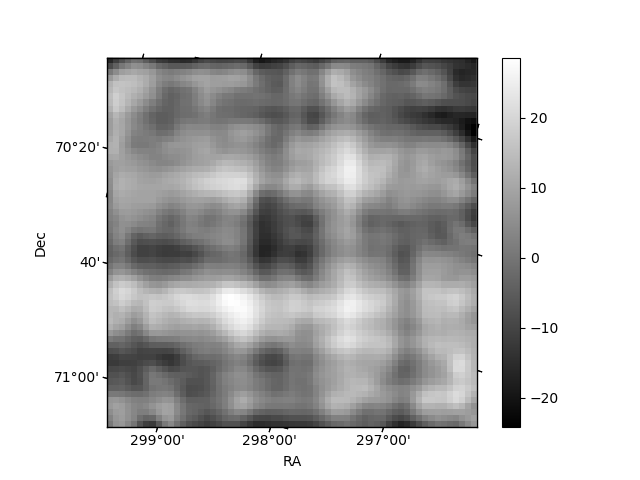
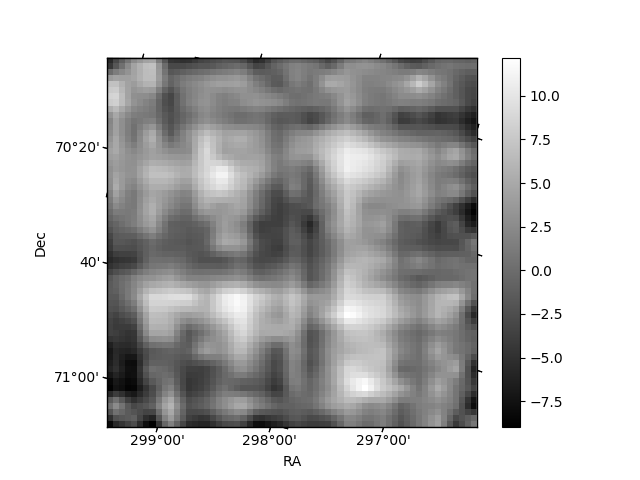
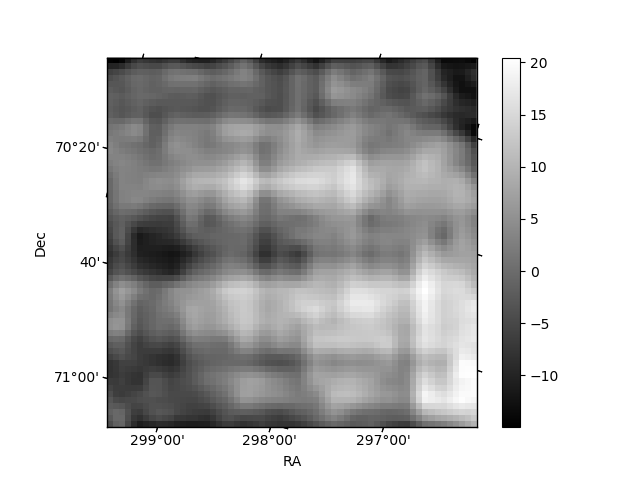
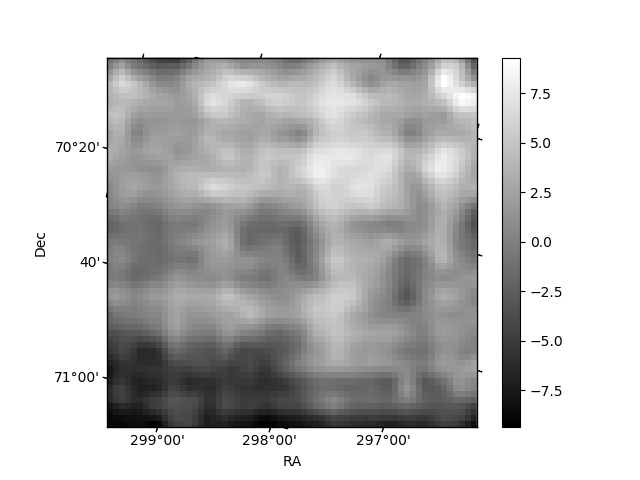
Histogram calculated using DETX and DETY for each event in the final _common_clean file
| Quadrant A | 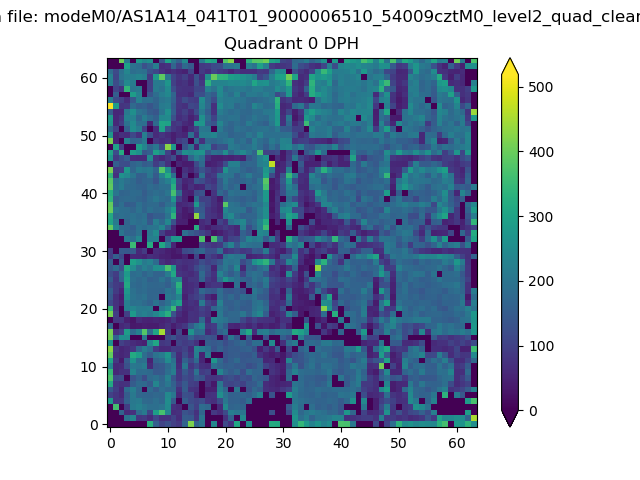 |
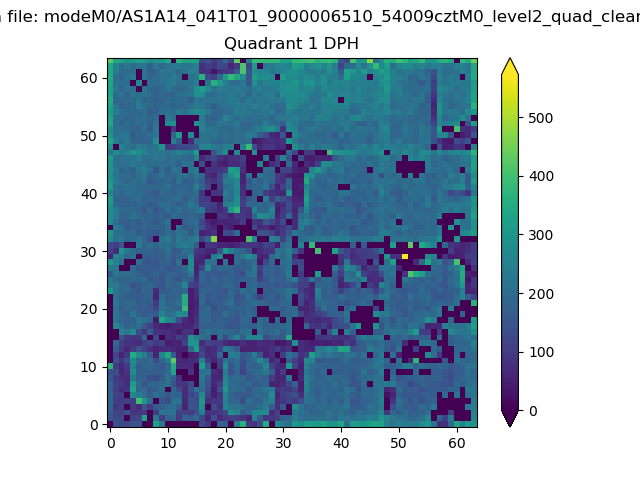 |
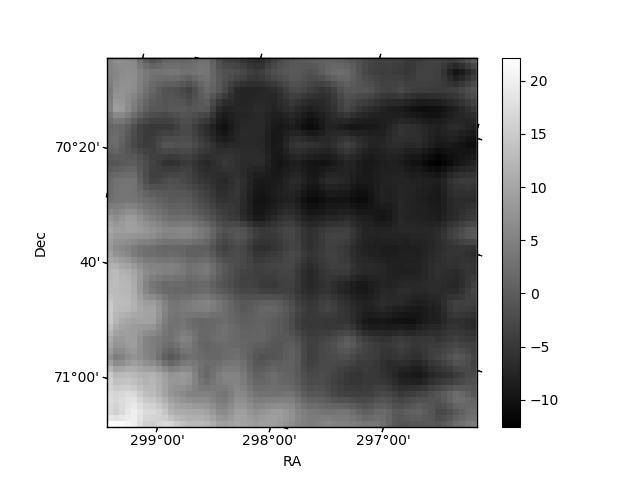
Quadrant B |
|---|---|---|---|
| Quadrant D | 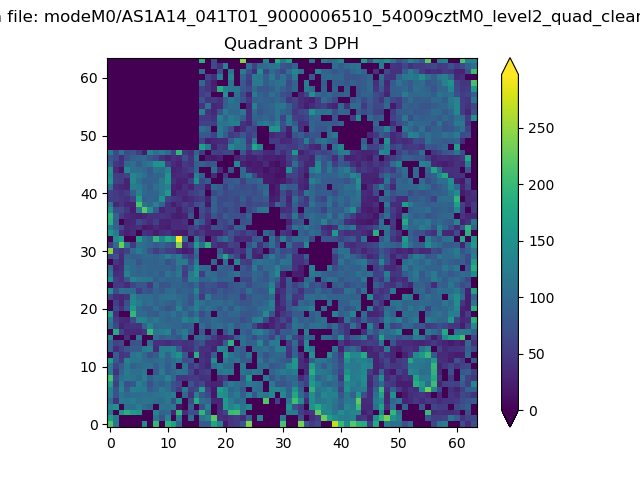 |
 |
Quadrant C |
| Plot type | Count rate plots | Images |
|---|---|---|
| Comparison with Poisson distribution Blue bars denote a histogram of data divided into 1 sec bins. Red curve is a Poisson curve with rate = median count rate of data. |
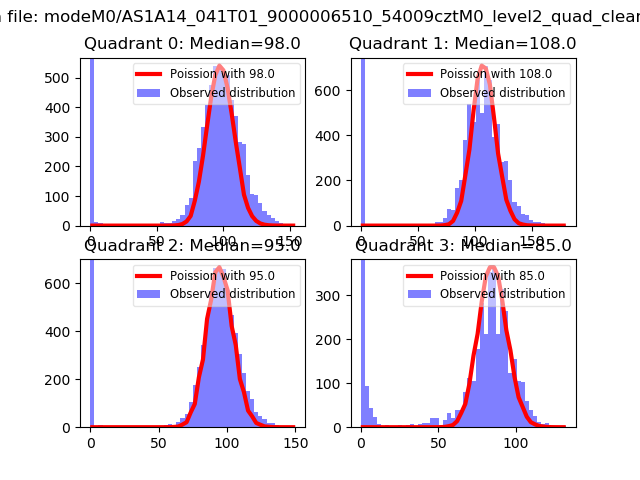 |
 |
| Quadrant-wise count rates Data is divided into 100 sec bins |
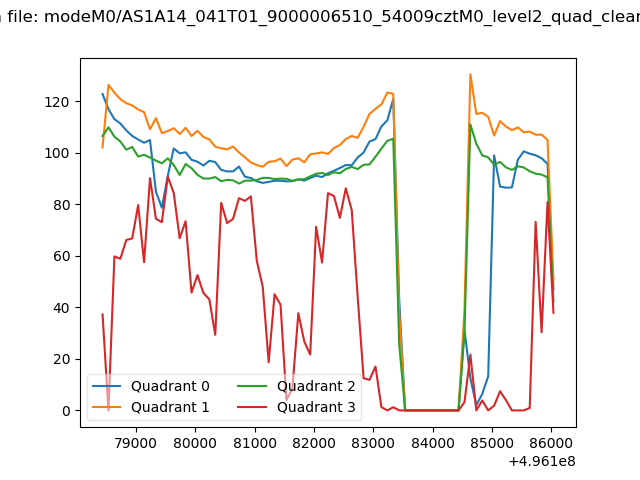 |
|
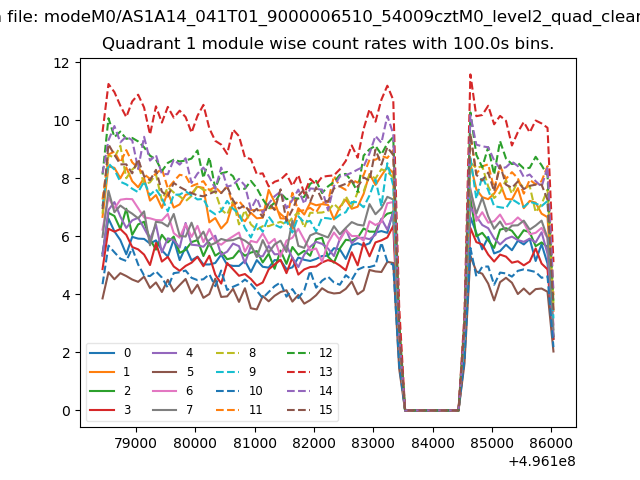
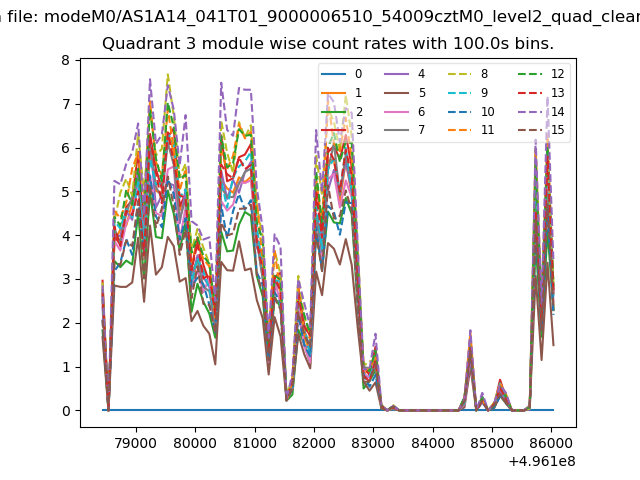
| Module-wise count rates for Quadrant A Data is divided into 100 sec bins |
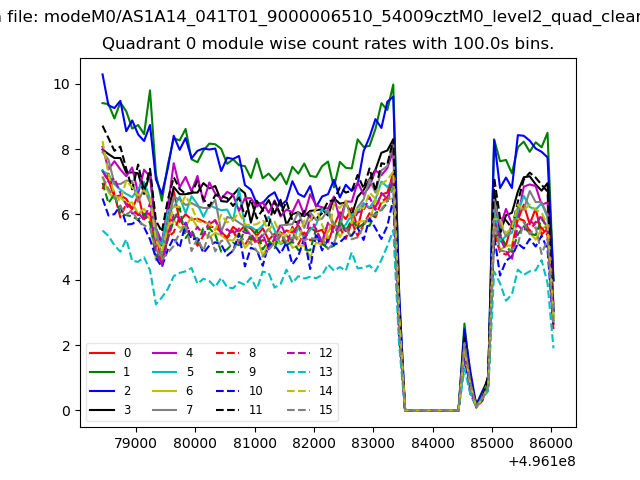 |
 |
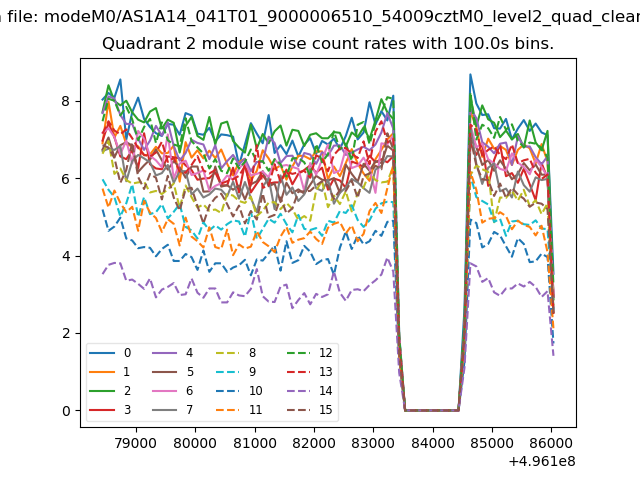
| Module-wise count rates for Quadrant B Data is divided into 100 sec bins |
 |
 |
| Module-wise count rates for Quadrant C Data is divided into 100 sec bins |
 |
 |
| Module-wise count rates for Quadrant D Data is divided into 100 sec bins |
 |
 |
| Parameter | Plot |
|---|---|
| CZT HV Monitor | 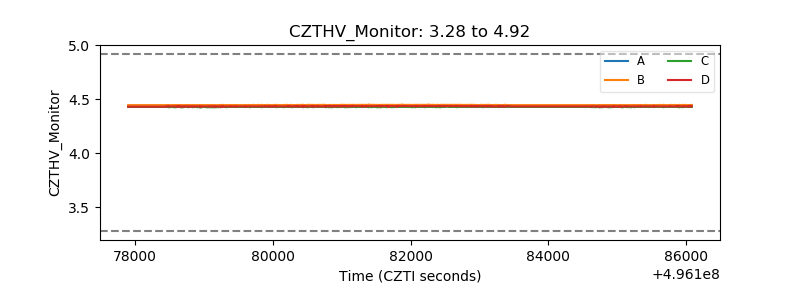 |
| D_VDD | 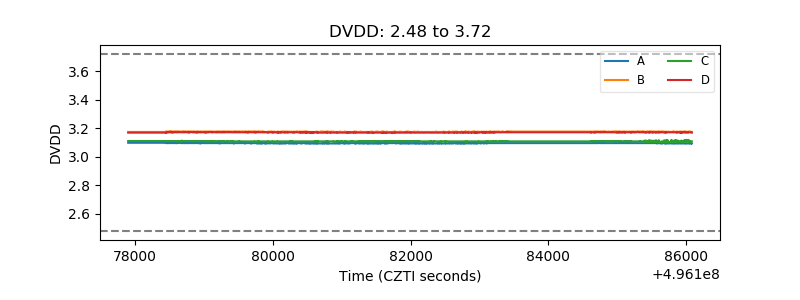 |
| Temperature 1 | 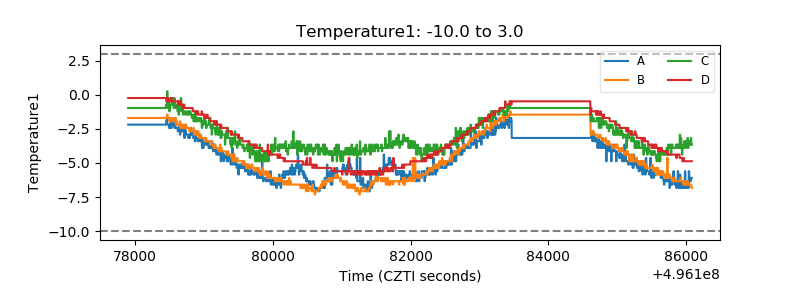 |
| Veto HV Monitor | 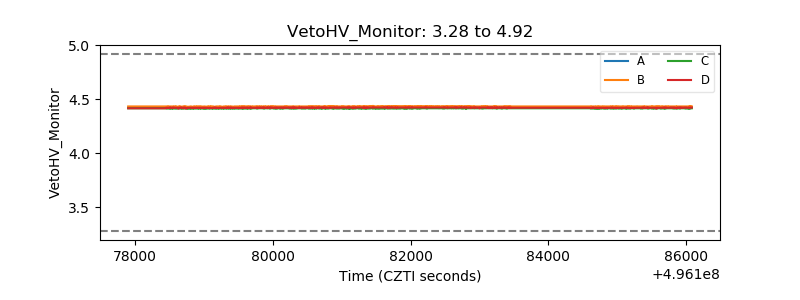 |
| Veto LLD | 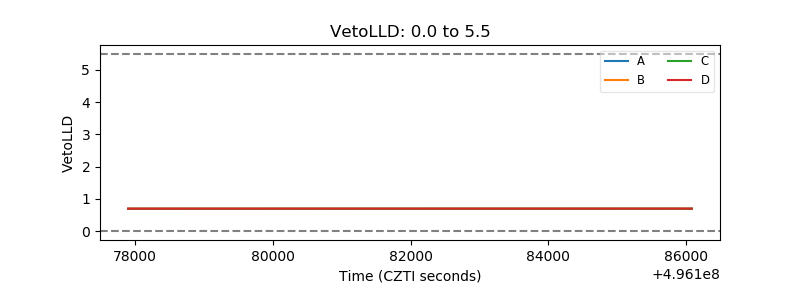 |
| Alpha Counter | 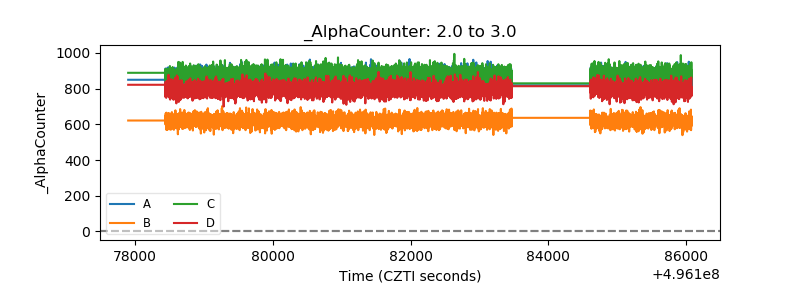 |
| _CPM_Rate | 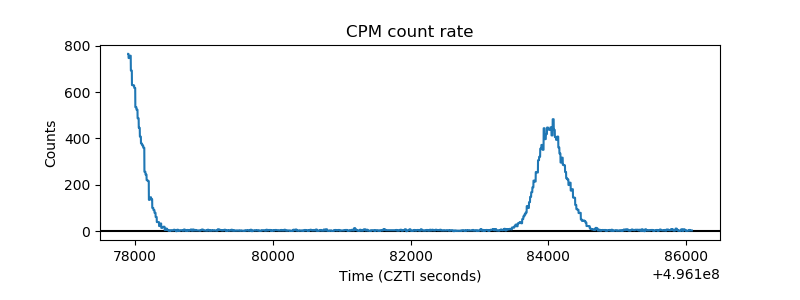 |
| CZT Counter | 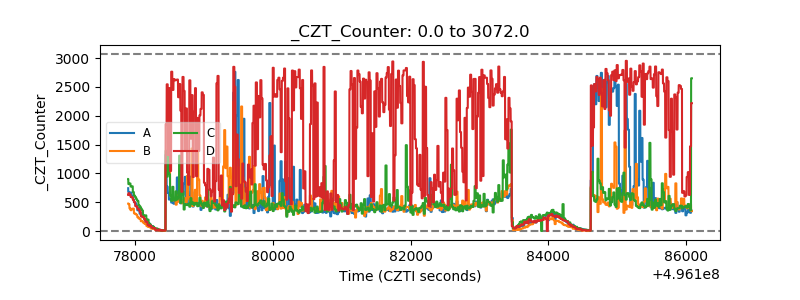 |
| +2.5 Volts monitor |  |
| +5 Volts monitor | 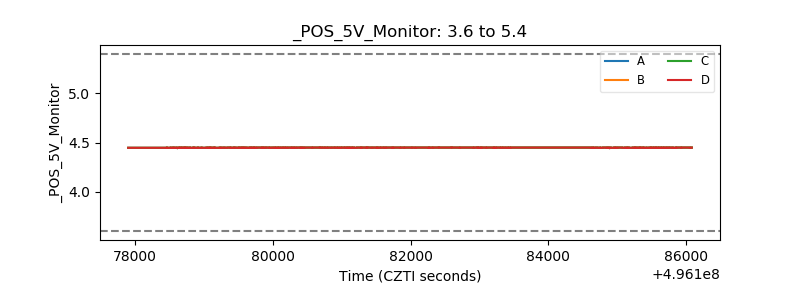 |
| _ROLL_ROT | 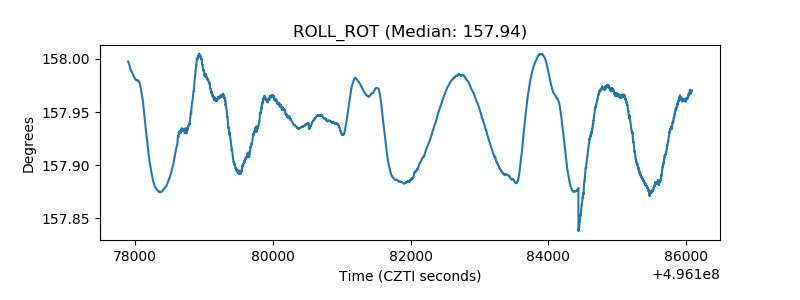 |
| _Roll_DEC | 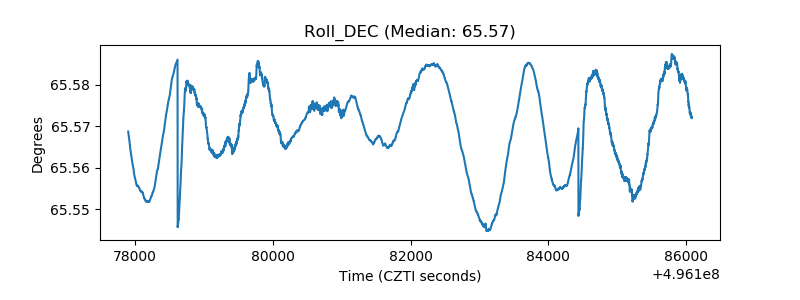 |
| _Roll_RA | 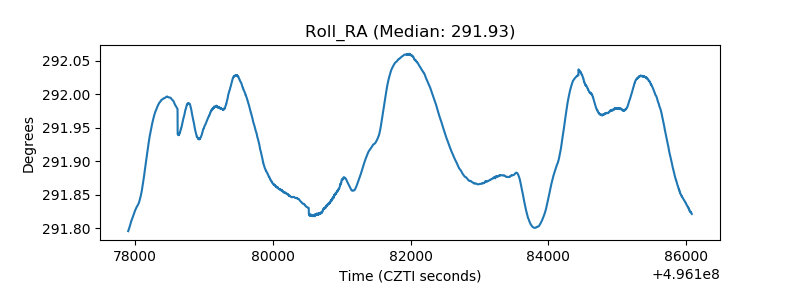 |
| Veto Counter | 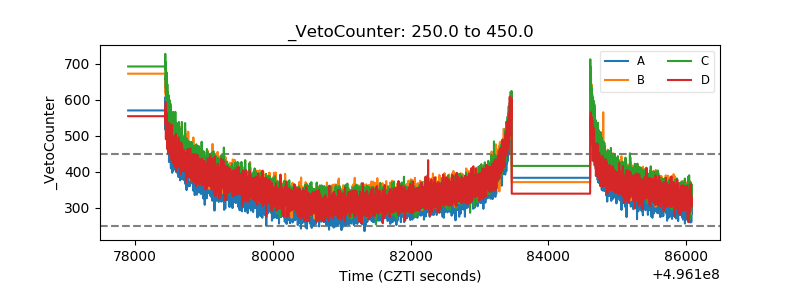 |