| Param | Original file | Final file |
|---|---|---|
| Filename | modeM0/AS1A14_041T01_9000006510_54011cztM0_level2.fits | modeM0/AS1A14_041T01_9000006510_54011cztM0_level2_quad_clean.evt |
| Size (bytes) | 877,173,120 | 85,737,600 |
| Size | 836.5 MB | 81.8 MB |
| Events in quadrant A | 4,017,948 | 682,159 |
| Events in quadrant B | 4,140,730 | 747,539 |
| Events in quadrant C | 10,651,719 | 400,114 |
| Events in quadrant D | 13,092,235 | 257,362 |
| Mode M9 | |||
|---|---|---|---|
| Quadrant | BADHDUFLAG | Total packets | Discarded packets |
| A | 0 | 10 | 0 |
| B | 0 | 11 | 0 |
| C | 0 | 11 | 0 |
| D | 0 | 11 | 0 |
| Mode SS | |||
|---|---|---|---|
| Quadrant | BADHDUFLAG | Total packets | Discarded packets |
| A | 0 | 146 | 0 |
| B | 0 | 146 | 0 |
| C | 0 | 146 | 0 |
| D | 0 | 146 | 0 |
| Mode M0 | |||
|---|---|---|---|
| Quadrant | BADHDUFLAG | Total packets | Discarded packets |
| A | 0 | 17475 | 2 |
| B | 0 | 17573 | 2 |
| C | 0 | 36726 | 2 |
| D | 0 | 44001 | 4 |
| Quadrant | Total seconds | Saturated seconds | Saturation percentage |
|---|---|---|---|
| A | 7312 | 157 | 2.147155% |
| B | 7312 | 165 | 2.256565% |
| C | 7312 | 3128 | 42.778993% |
| D | 7311 | 4490 | 61.414307% |
Noise dominated data is calculated using 1-second bins in cleaned event files. If a bin has >2000 counts, and if more than 50% of those come from <1% of pixels, then it is considered to be noise-dominated and hence unusable.
| Quadrant | # 1 sec bins | Bins with >0 counts | Bins with >2000 counts | High rate bins dominated by noise | Noise dominated (total time) | Noise dominated (detector-on time) | Marked lightcurve |
|---|---|---|---|---|---|---|---|
| A | 7747 | 7313 | 111 | 111 | 1.43% | 1.52% | 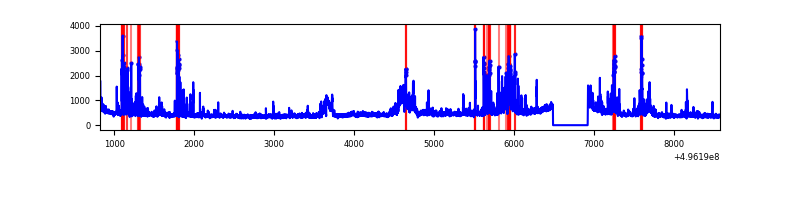 |
| B | 7747 | 7313 | 90 | 90 | 1.16% | 1.23% | 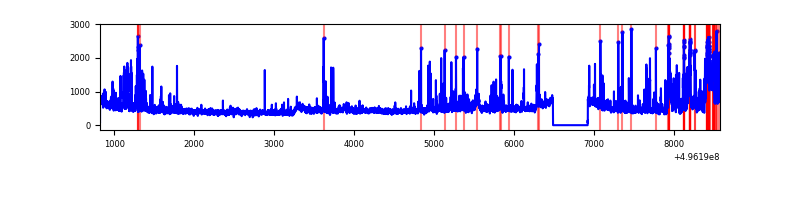 |
| C | 7747 | 7313 | 2449 | 2449 | 31.61% | 33.49% | 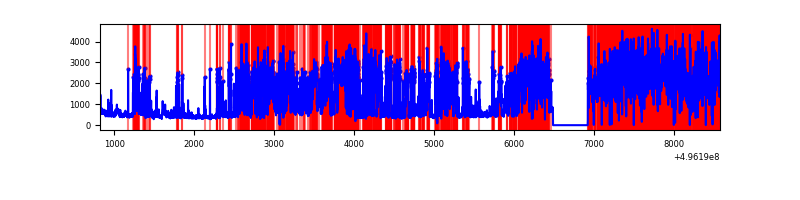 |
| D | 7746 | 7312 | 3390 | 3390 | 43.76% | 46.36% | 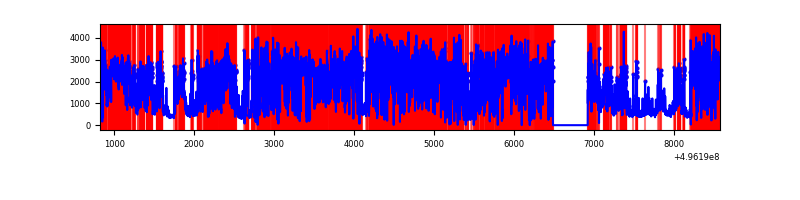 |
Top three noisy pixels from each quadrant. If the there are fewer than three noisy pixels in the level2.evt file, extra rows are filled as -1
| Pixel properties | Quadrant properties | ||||||
|---|---|---|---|---|---|---|---|
| Quadrant | DetID | PixID | Counts | Sigma | Mean | Median | Sigma |
| A | 15 | 174 | 355438 | 1898.5 | 758 | 737 | 186.8 |
| A | 12 | 115 | 297158 | 1586.56 | 758 | 737 | 186.8 |
| A | 0 | 8 | 128983 | 686.42 | 758 | 737 | 186.8 |
| B | 2 | 2 | 502487 | 3096.97 | 763 | 736 | 162.0 |
| B | 5 | 250 | 189918 | 1167.69 | 763 | 736 | 162.0 |
| B | 0 | 213 | 125331 | 769.04 | 763 | 736 | 162.0 |
| C | 4 | 5 | 4631544 | 31661.55 | 529 | 523 | 146.3 |
| C | 14 | 80 | 3534660 | 24162.33 | 529 | 523 | 146.3 |
| C | 13 | 3 | 216191 | 1474.49 | 529 | 523 | 146.3 |
| D | 8 | 176 | 10646078 | 88983.01 | 417 | 397 | 119.6 |
| D | 10 | 172 | 286244 | 2389.28 | 417 | 397 | 119.6 |
| D | 2 | 165 | 239779 | 2000.9 | 417 | 397 | 119.6 |
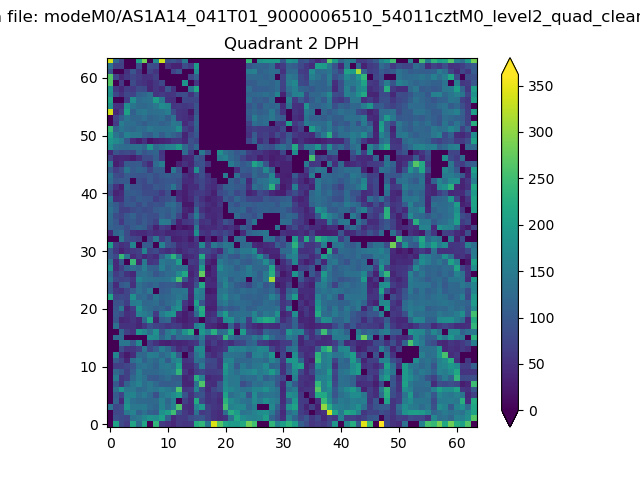
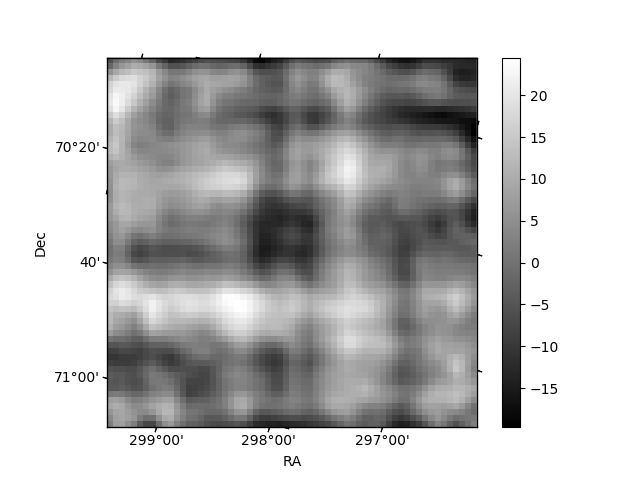
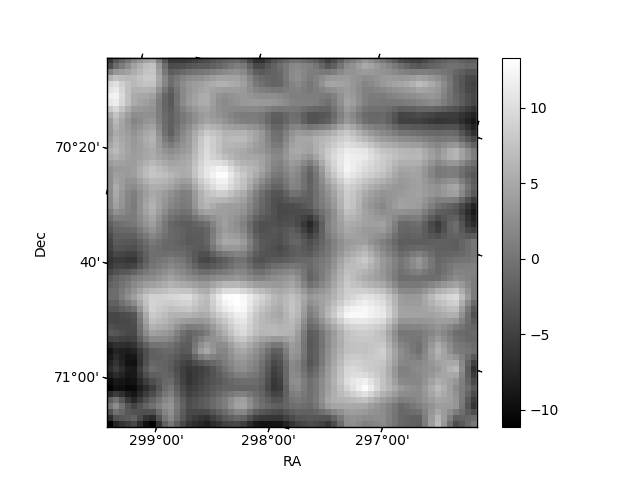
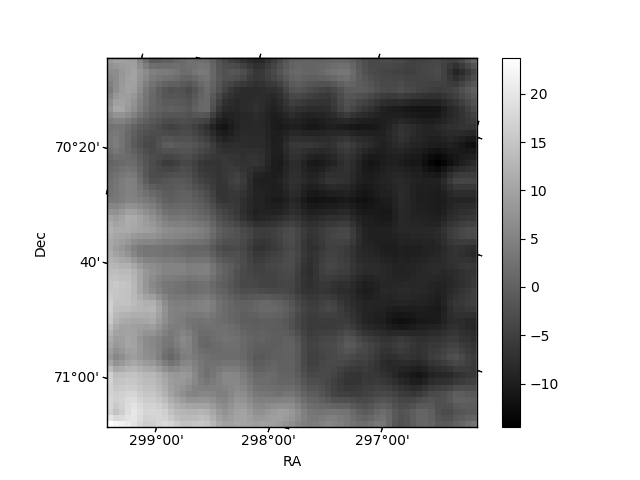
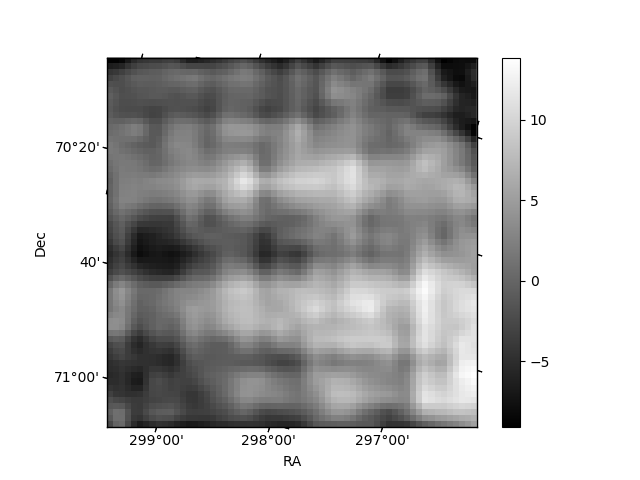
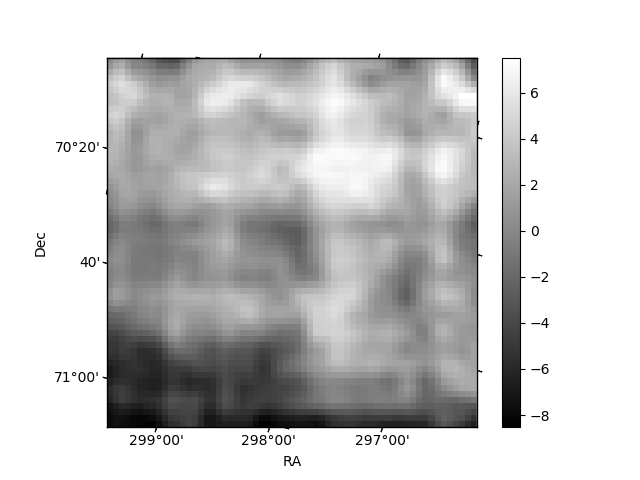
Histogram calculated using DETX and DETY for each event in the final _common_clean file
| Quadrant A | 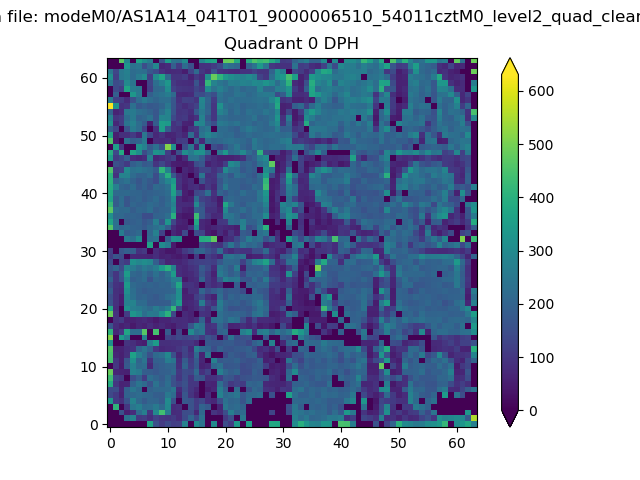 |
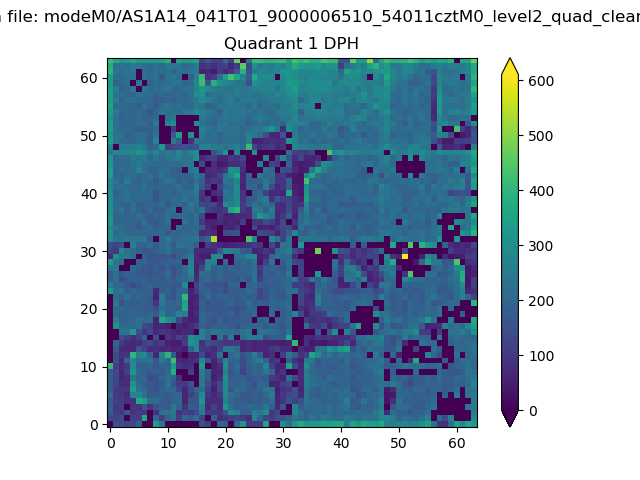 |
Quadrant B |
|---|---|---|---|
| Quadrant D | 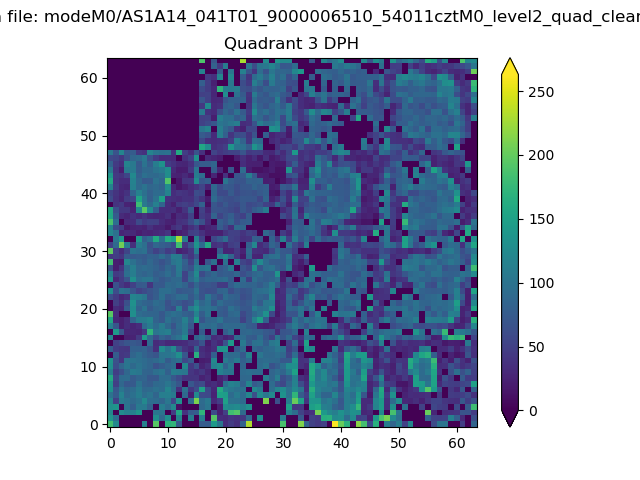 |
 |
Quadrant C |
| Plot type | Count rate plots | Images |
|---|---|---|
| Comparison with Poisson distribution Blue bars denote a histogram of data divided into 1 sec bins. Red curve is a Poisson curve with rate = median count rate of data. |
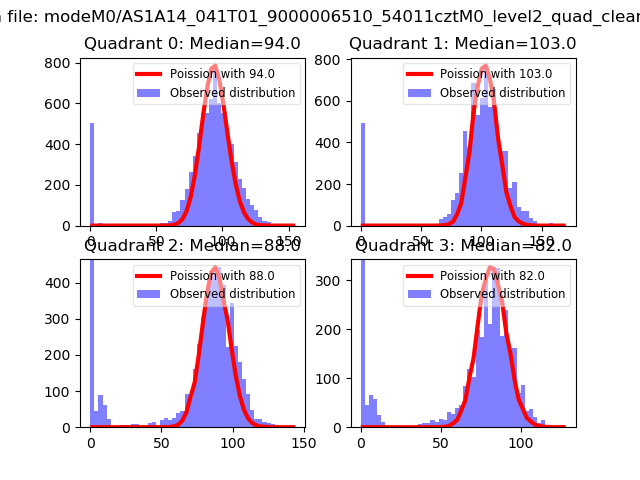 |
 |
| Quadrant-wise count rates Data is divided into 100 sec bins |
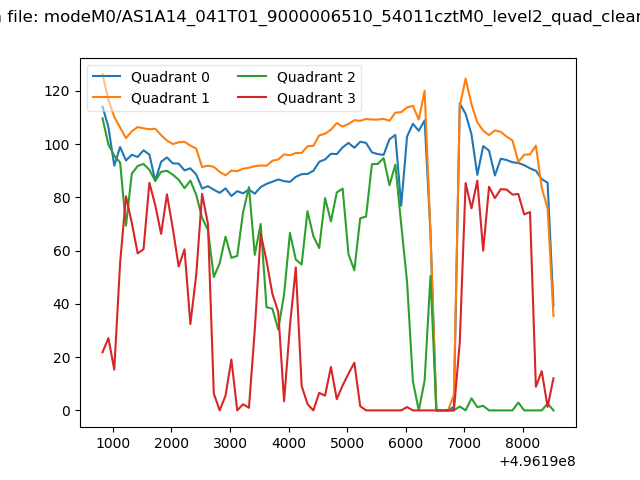 |
|
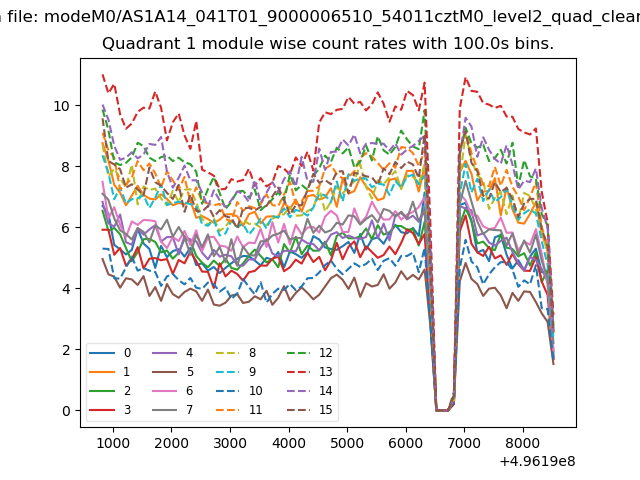
| Module-wise count rates for Quadrant A Data is divided into 100 sec bins |
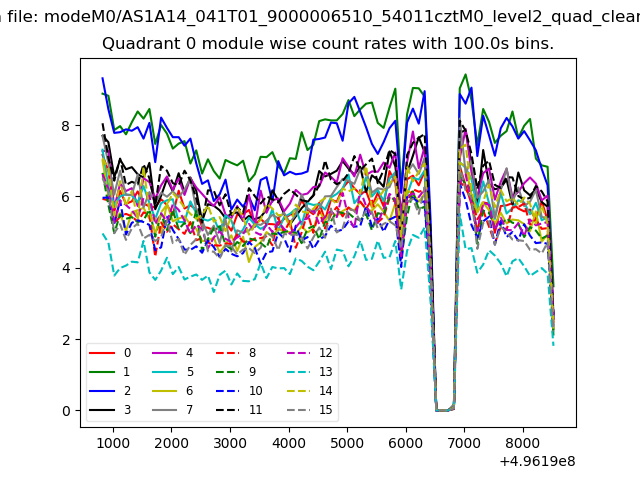 |
 |
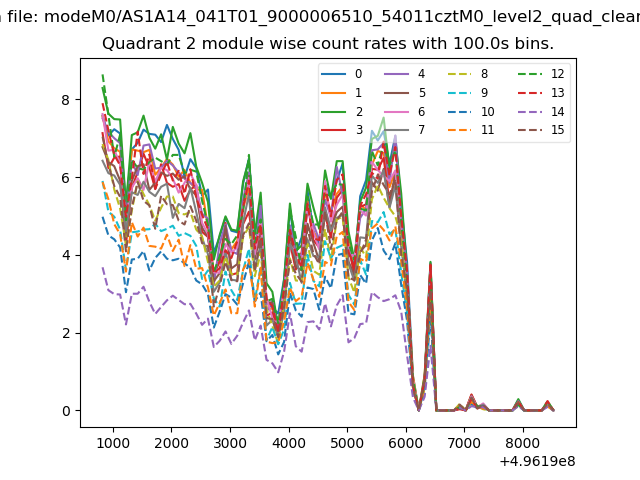
| Module-wise count rates for Quadrant B Data is divided into 100 sec bins |
 |
 |
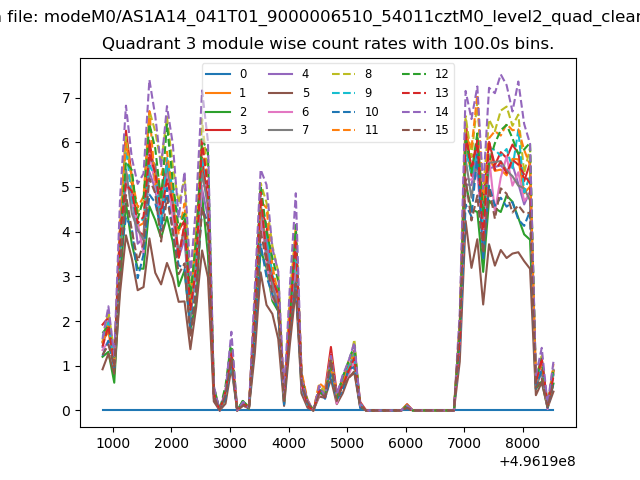
| Module-wise count rates for Quadrant C Data is divided into 100 sec bins |
 |
 |
| Module-wise count rates for Quadrant D Data is divided into 100 sec bins |
 |
 |
| Parameter | Plot |
|---|---|
| CZT HV Monitor | 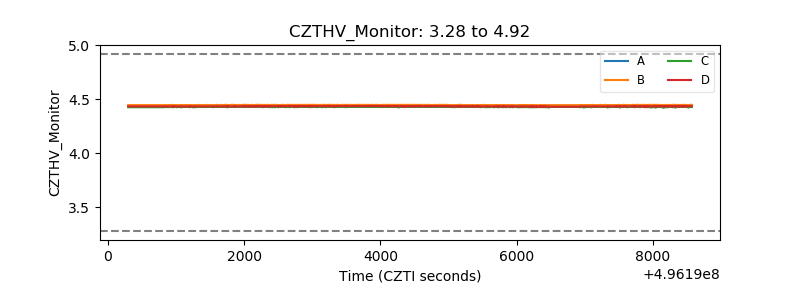 |
| D_VDD | 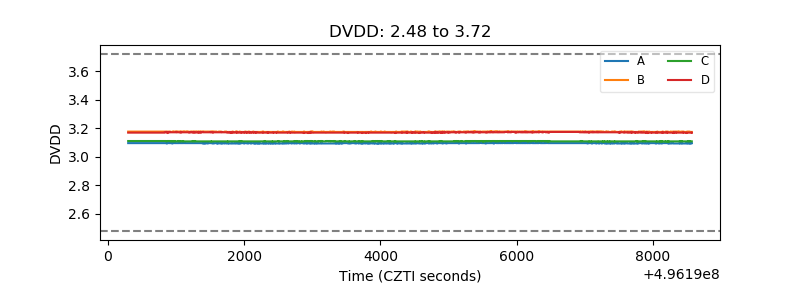 |
| Temperature 1 | 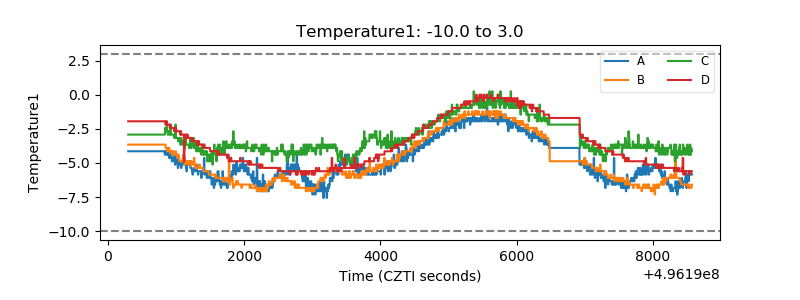 |
| Veto HV Monitor | 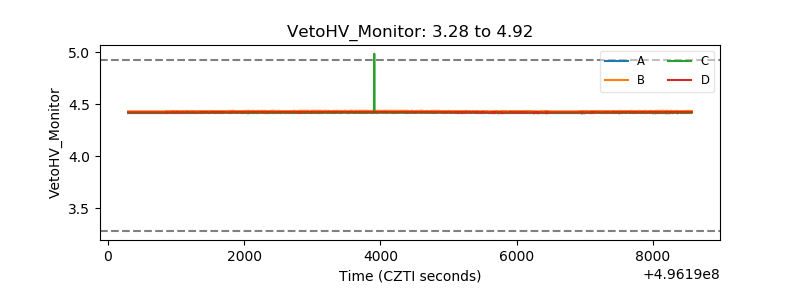 |
| Veto LLD | 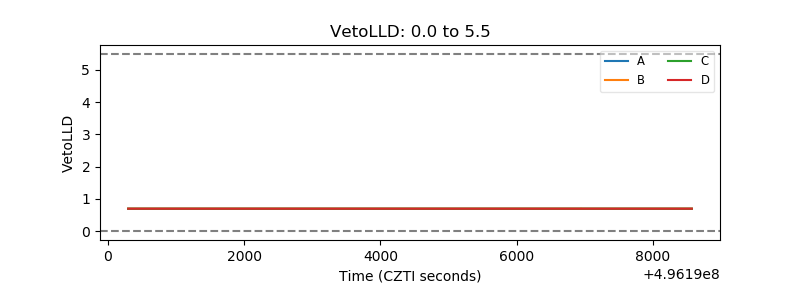 |
| Alpha Counter | 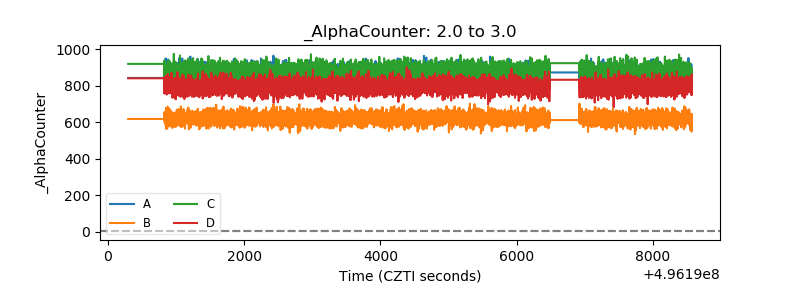 |
| _CPM_Rate | 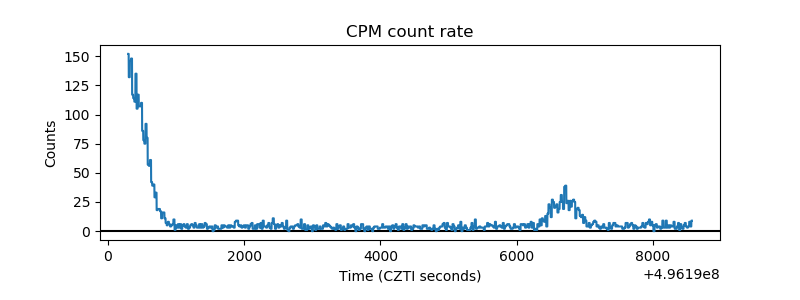 |
| CZT Counter | 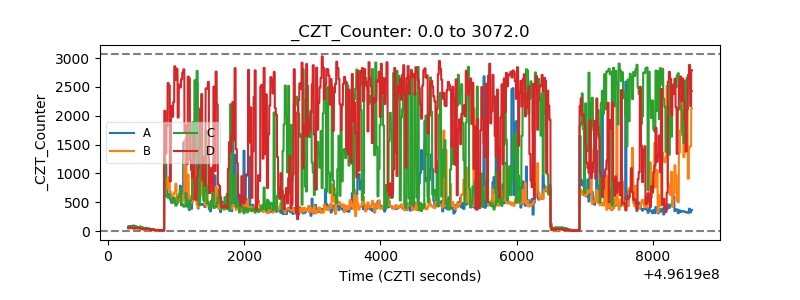 |
| +2.5 Volts monitor |  |
| +5 Volts monitor |  |
| _ROLL_ROT | 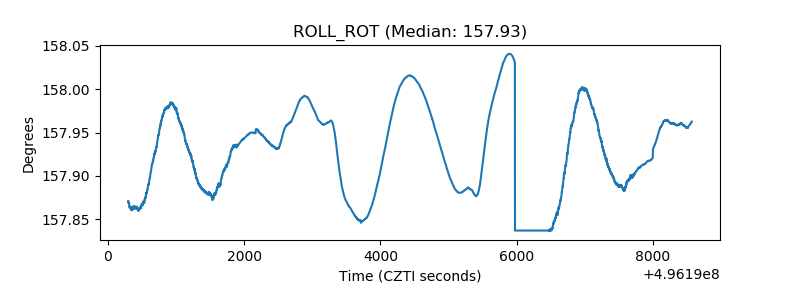 |
| _Roll_DEC | 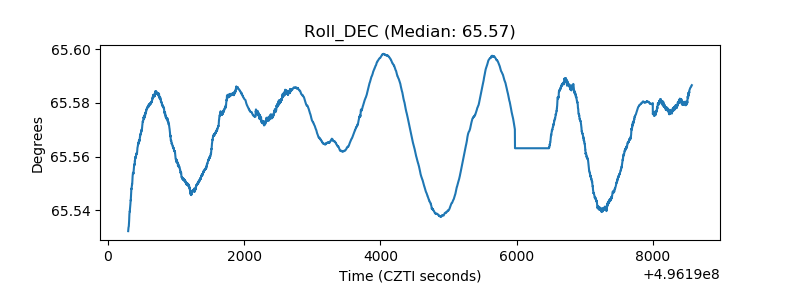 |
| _Roll_RA | 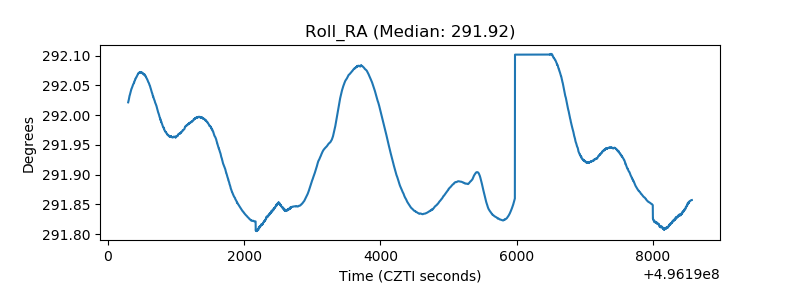 |
| Veto Counter | 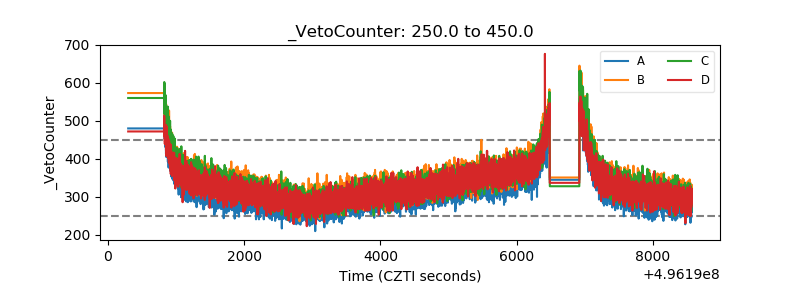 |