| Param | Original file | Final file |
|---|---|---|
| Filename | modeM0/AS1A14_041T01_9000006510_54012cztM0_level2.fits | modeM0/AS1A14_041T01_9000006510_54012cztM0_level2_quad_clean.evt |
| Size (bytes) | 1,124,691,840 | 87,048,000 |
| Size | 1.0 GB | 83.0 MB |
| Events in quadrant A | 5,009,241 | 727,701 |
| Events in quadrant B | 8,877,423 | 729,739 |
| Events in quadrant C | 13,073,828 | 330,117 |
| Events in quadrant D | 14,058,625 | 296,097 |
| Mode M9 | |||
|---|---|---|---|
| Quadrant | BADHDUFLAG | Total packets | Discarded packets |
| A | 0 | 5 | 0 |
| B | 0 | 5 | 0 |
| C | 0 | 5 | 0 |
| D | 0 | 5 | 0 |
| Mode SS | |||
|---|---|---|---|
| Quadrant | BADHDUFLAG | Total packets | Discarded packets |
| A | 0 | 160 | 0 |
| B | 0 | 160 | 0 |
| C | 0 | 160 | 0 |
| D | 0 | 160 | 0 |
| Mode M0 | |||
|---|---|---|---|
| Quadrant | BADHDUFLAG | Total packets | Discarded packets |
| A | 0 | 20861 | 1 |
| B | 0 | 31880 | 1 |
| C | 0 | 44298 | 7 |
| D | 0 | 47252 | 1 |
| Quadrant | Total seconds | Saturated seconds | Saturation percentage |
|---|---|---|---|
| A | 7935 | 282 | 3.553875% |
| B | 7935 | 1249 | 15.740391% |
| C | 7934 | 4487 | 56.554071% |
| D | 7934 | 4627 | 58.318629% |
Noise dominated data is calculated using 1-second bins in cleaned event files. If a bin has >2000 counts, and if more than 50% of those come from <1% of pixels, then it is considered to be noise-dominated and hence unusable.
| Quadrant | # 1 sec bins | Bins with >0 counts | Bins with >2000 counts | High rate bins dominated by noise | Noise dominated (total time) | Noise dominated (detector-on time) | Marked lightcurve |
|---|---|---|---|---|---|---|---|
| A | 8370 | 7936 | 202 | 202 | 2.41% | 2.55% | 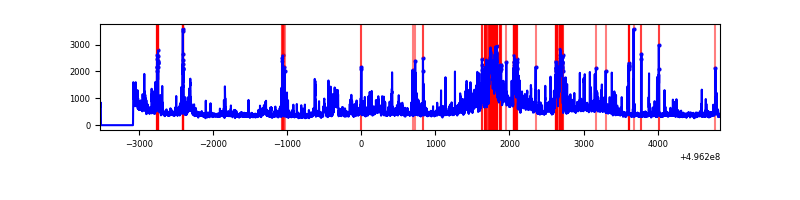 |
| B | 8370 | 7936 | 1003 | 1003 | 11.98% | 12.64% | 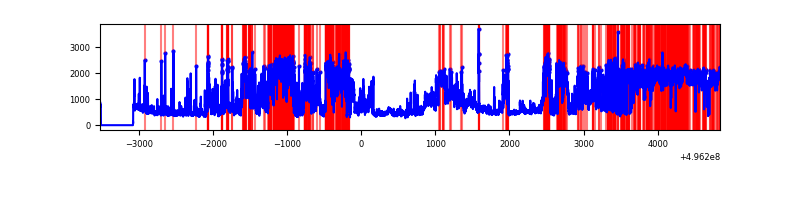 |
| C | 8369 | 7935 | 3219 | 3219 | 38.46% | 40.57% | 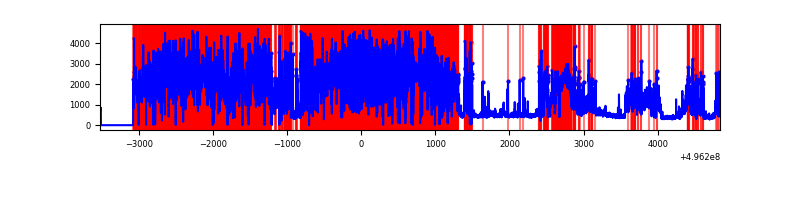 |
| D | 8369 | 7935 | 3469 | 3469 | 41.45% | 43.72% | 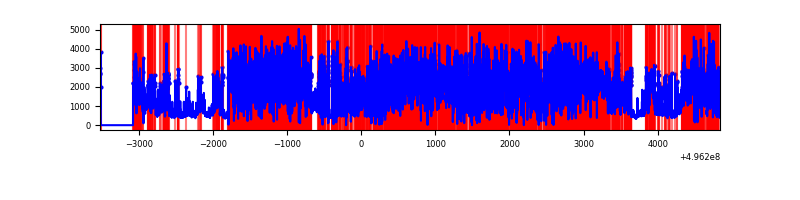 |
Top three noisy pixels from each quadrant. If the there are fewer than three noisy pixels in the level2.evt file, extra rows are filled as -1
| Pixel properties | Quadrant properties | ||||||
|---|---|---|---|---|---|---|---|
| Quadrant | DetID | PixID | Counts | Sigma | Mean | Median | Sigma |
| A | 15 | 174 | 608020 | 2997.3 | 821 | 799 | 202.6 |
| A | 10 | 253 | 397980 | 1960.52 | 821 | 799 | 202.6 |
| A | 12 | 115 | 382059 | 1881.94 | 821 | 799 | 202.6 |
| B | 2 | 2 | 4955124 | 28826.66 | 806 | 779 | 171.9 |
| B | 0 | 213 | 283890 | 1647.27 | 806 | 779 | 171.9 |
| B | 7 | 252 | 99157 | 572.41 | 806 | 779 | 171.9 |
| C | 4 | 5 | 10381504 | 79778.6 | 476 | 471 | 130.1 |
| C | 15 | 189 | 445108 | 3417.05 | 476 | 471 | 130.1 |
| C | 14 | 80 | 148828 | 1140.13 | 476 | 471 | 130.1 |
| D | 8 | 176 | 11110517 | 79220.06 | 485 | 460 | 140.2 |
| D | 2 | 165 | 374211 | 2665.02 | 485 | 460 | 140.2 |
| D | 10 | 172 | 168859 | 1200.77 | 485 | 460 | 140.2 |
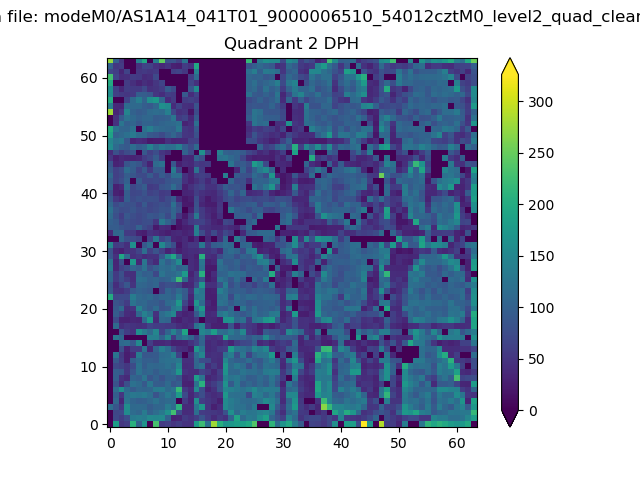
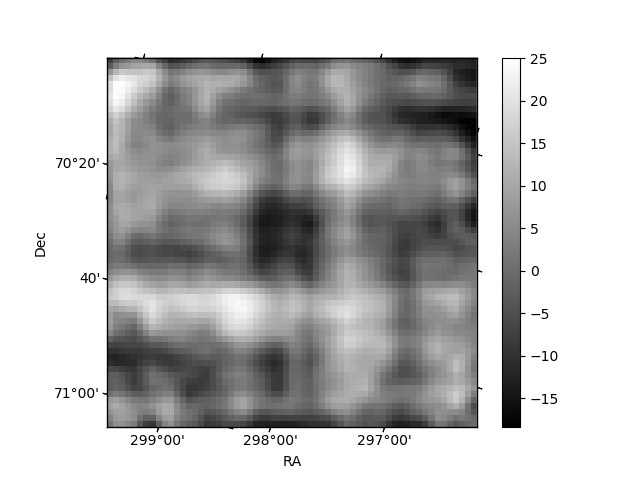
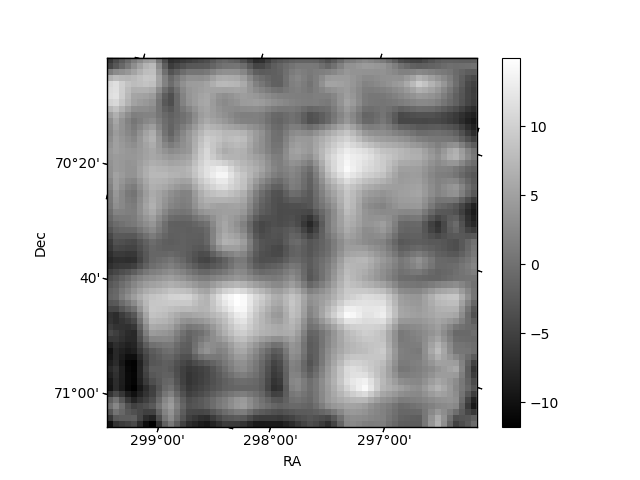
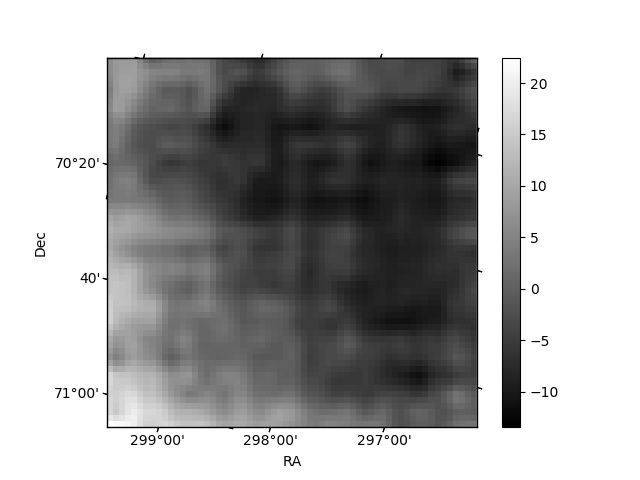
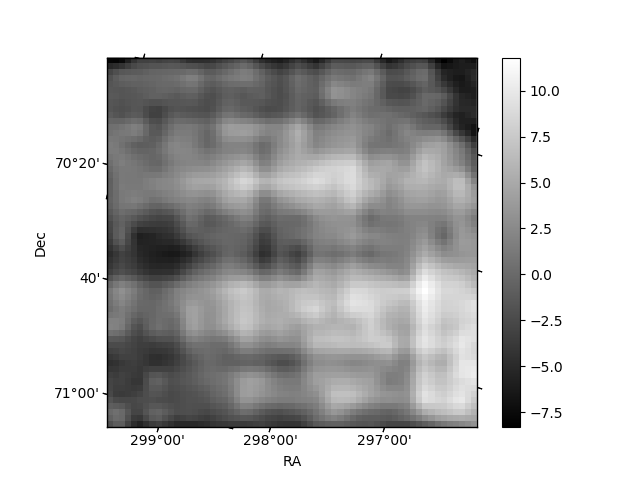
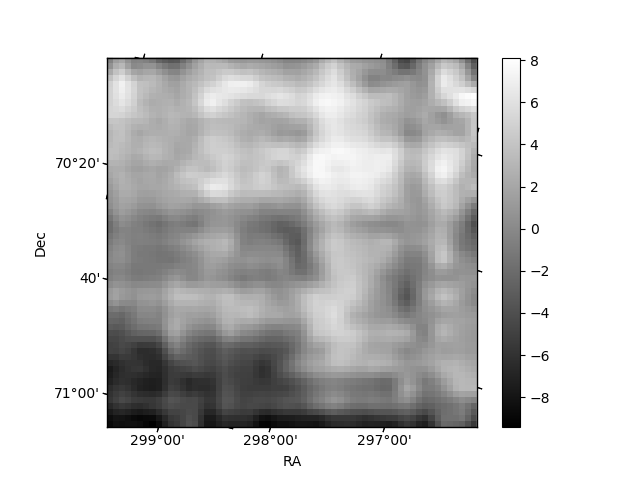
Histogram calculated using DETX and DETY for each event in the final _common_clean file
| Quadrant A | 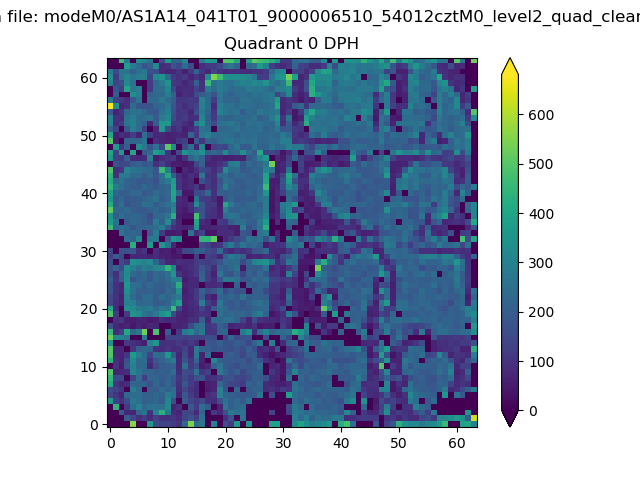 |
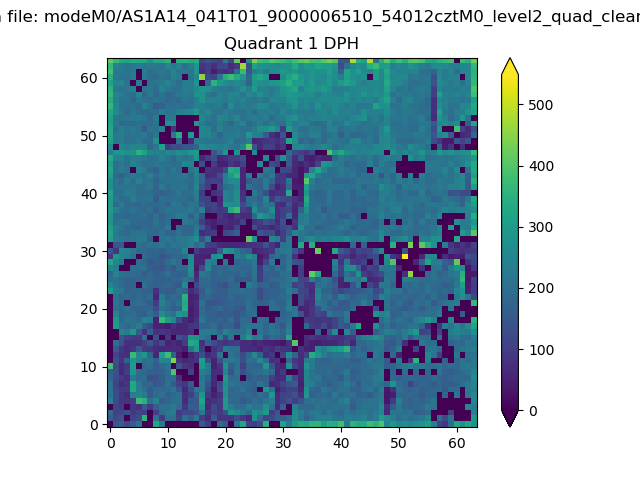 |
Quadrant B |
|---|---|---|---|
| Quadrant D | 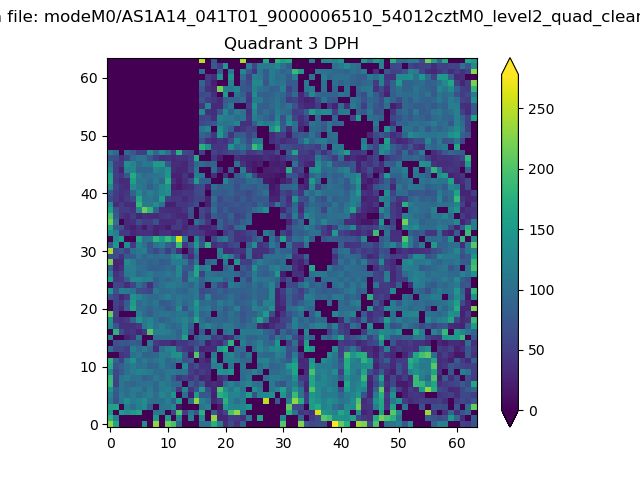 |
 |
Quadrant C |
| Plot type | Count rate plots | Images |
|---|---|---|
| Comparison with Poisson distribution Blue bars denote a histogram of data divided into 1 sec bins. Red curve is a Poisson curve with rate = median count rate of data. |
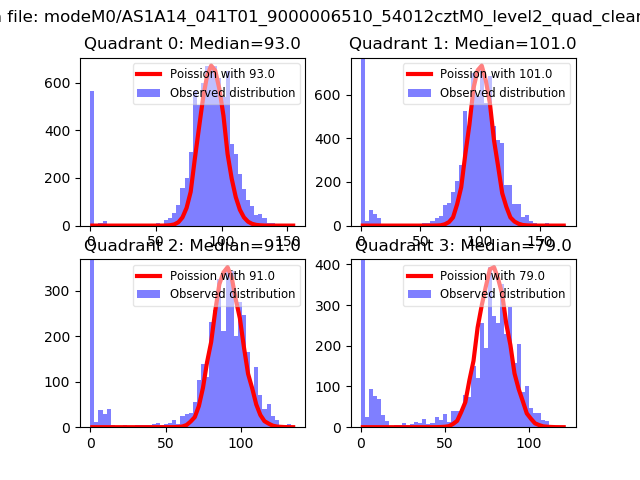 |
 |
| Quadrant-wise count rates Data is divided into 100 sec bins |
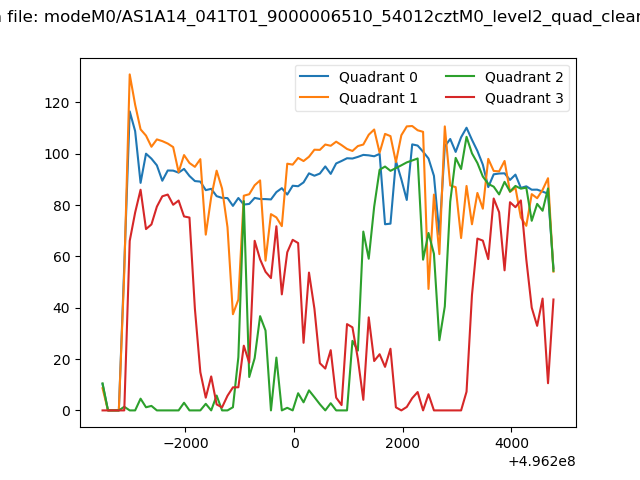 |
|
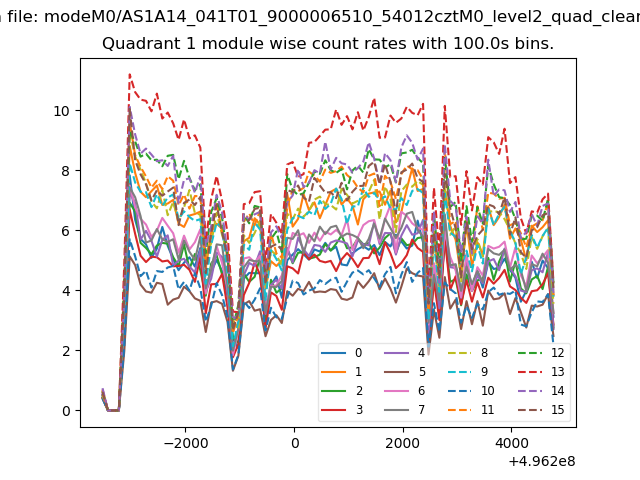
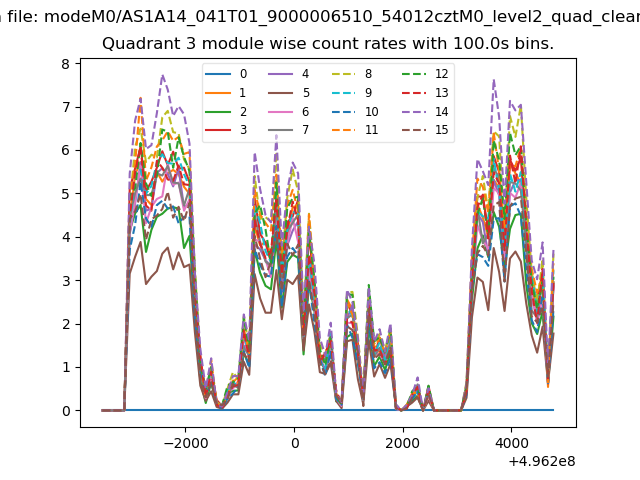
| Module-wise count rates for Quadrant A Data is divided into 100 sec bins |
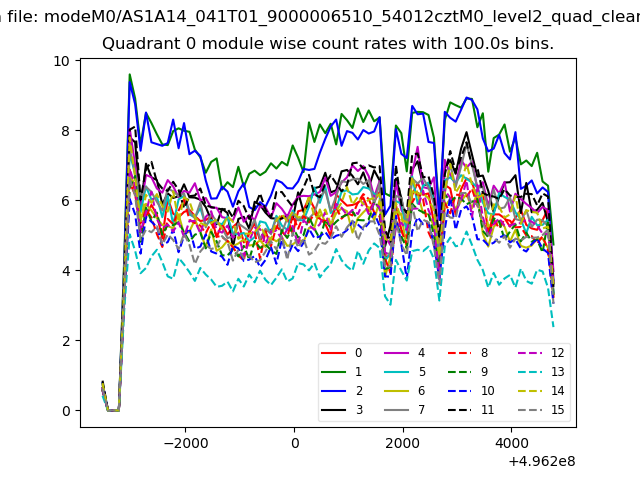 |
 |
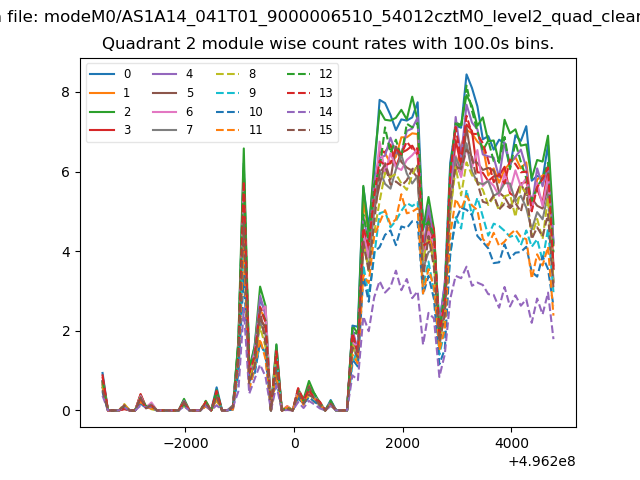
| Module-wise count rates for Quadrant B Data is divided into 100 sec bins |
 |
 |
| Module-wise count rates for Quadrant C Data is divided into 100 sec bins |
 |
 |
| Module-wise count rates for Quadrant D Data is divided into 100 sec bins |
 |
 |
| Parameter | Plot |
|---|---|
| CZT HV Monitor | 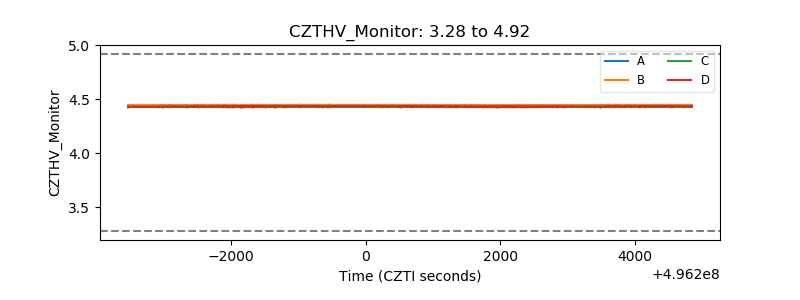 |
| D_VDD | 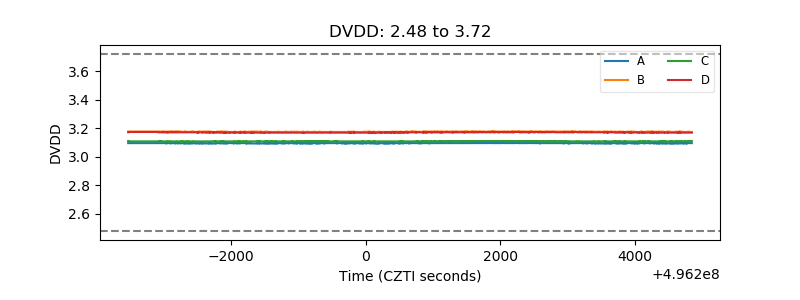 |
| Temperature 1 | 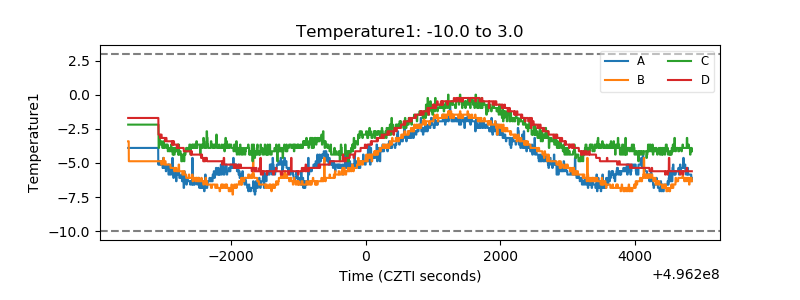 |
| Veto HV Monitor | 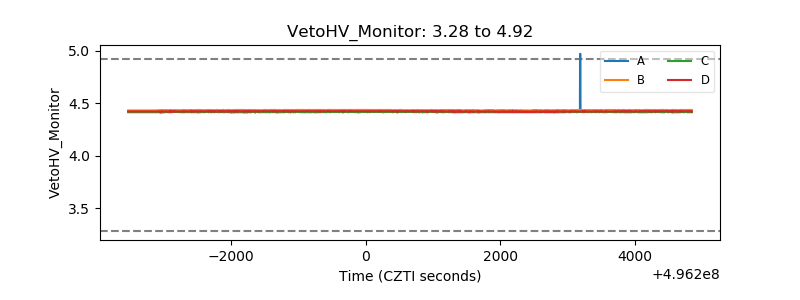 |
| Veto LLD | 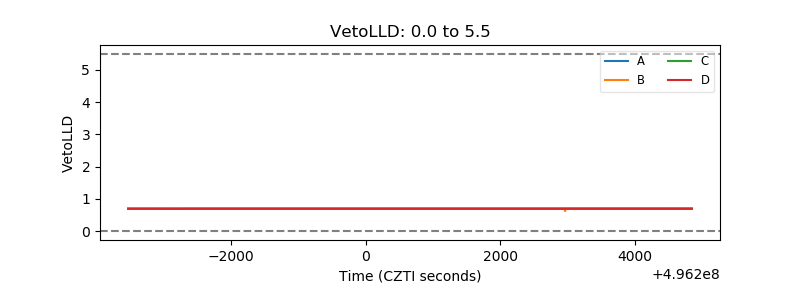 |
| Alpha Counter | 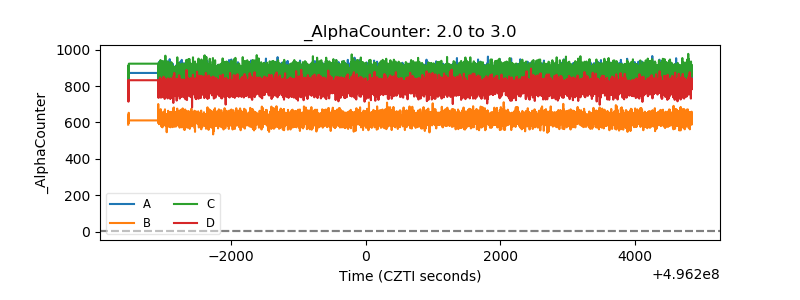 |
| _CPM_Rate | 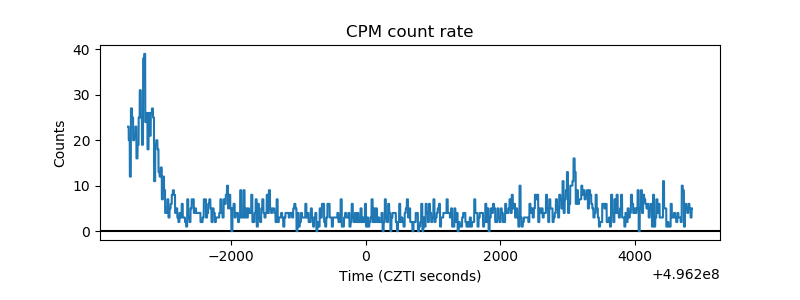 |
| CZT Counter | 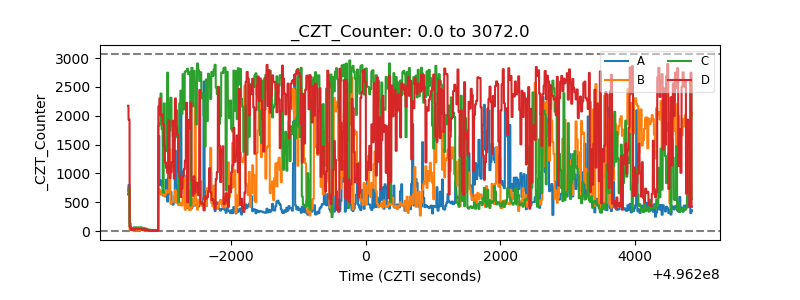 |
| +2.5 Volts monitor |  |
| +5 Volts monitor |  |
| _ROLL_ROT | 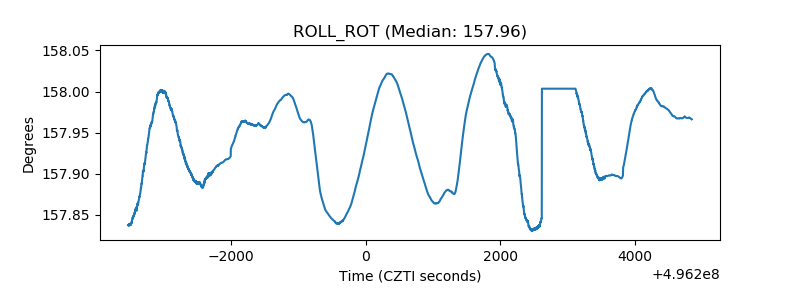 |
| _Roll_DEC | 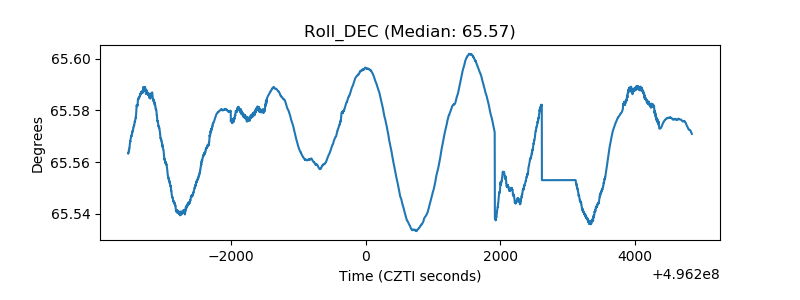 |
| _Roll_RA | 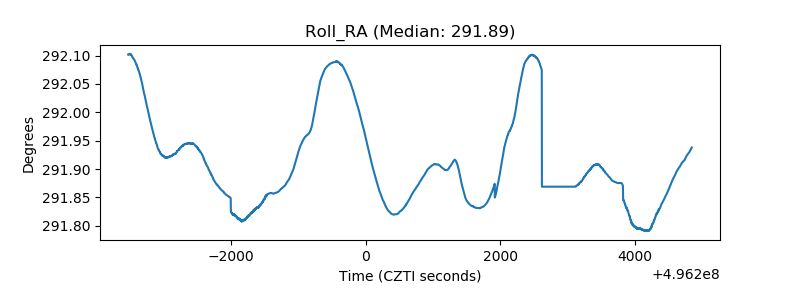 |
| Veto Counter | 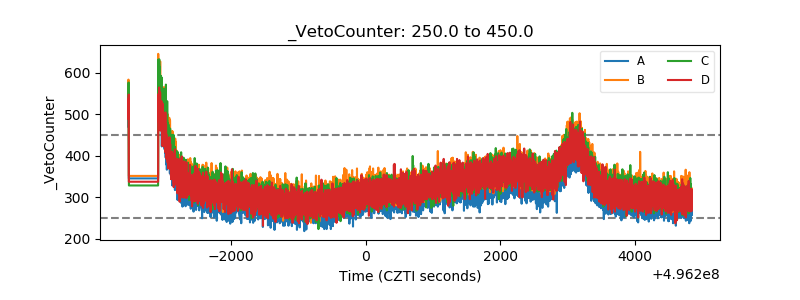 |