| Param | Original file | Final file |
|---|---|---|
| Filename | modeM0/AS1A14_041T01_9000006510_54013cztM0_level2.fits | modeM0/AS1A14_041T01_9000006510_54013cztM0_level2_quad_clean.evt |
| Size (bytes) | 831,801,600 | 101,194,560 |
| Size | 793.3 MB | 96.5 MB |
| Events in quadrant A | 3,770,970 | 739,120 |
| Events in quadrant B | 7,106,563 | 754,688 |
| Events in quadrant C | 7,757,716 | 595,426 |
| Events in quadrant D | 11,536,708 | 419,124 |
| Mode SS | |||
|---|---|---|---|
| Quadrant | BADHDUFLAG | Total packets | Discarded packets |
| A | 0 | 160 | 0 |
| B | 0 | 160 | 0 |
| C | 0 | 160 | 0 |
| D | 0 | 160 | 0 |
| Mode M0 | |||
|---|---|---|---|
| Quadrant | BADHDUFLAG | Total packets | Discarded packets |
| A | 0 | 17291 | 0 |
| B | 0 | 26733 | 0 |
| C | 0 | 28812 | 0 |
| D | 0 | 39869 | 0 |
| Quadrant | Total seconds | Saturated seconds | Saturation percentage |
|---|---|---|---|
| A | 7985 | 62 | 0.776456% |
| B | 7985 | 813 | 10.181590% |
| C | 7986 | 1454 | 18.206862% |
| D | 7986 | 3120 | 39.068370% |
Noise dominated data is calculated using 1-second bins in cleaned event files. If a bin has >2000 counts, and if more than 50% of those come from <1% of pixels, then it is considered to be noise-dominated and hence unusable.
| Quadrant | # 1 sec bins | Bins with >0 counts | Bins with >2000 counts | High rate bins dominated by noise | Noise dominated (total time) | Noise dominated (detector-on time) | Marked lightcurve |
|---|---|---|---|---|---|---|---|
| A | 7985 | 7985 | 38 | 38 | 0.48% | 0.48% | 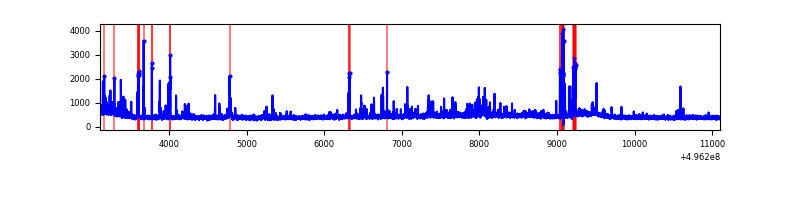 |
| B | 7985 | 7985 | 679 | 679 | 8.50% | 8.50% | 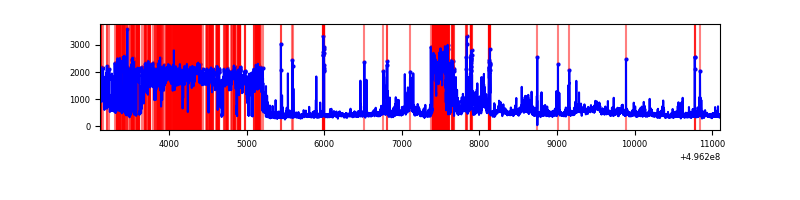 |
| C | 7986 | 7986 | 914 | 914 | 11.45% | 11.45% | 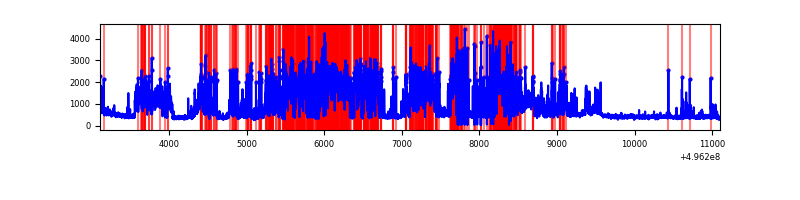 |
| D | 7986 | 7986 | 2373 | 2373 | 29.71% | 29.71% | 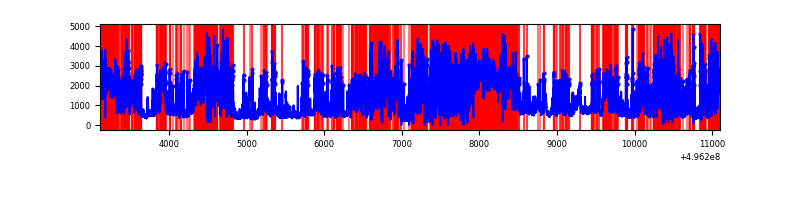 |
Top three noisy pixels from each quadrant. If the there are fewer than three noisy pixels in the level2.evt file, extra rows are filled as -1
| Pixel properties | Quadrant properties | ||||||
|---|---|---|---|---|---|---|---|
| Quadrant | DetID | PixID | Counts | Sigma | Mean | Median | Sigma |
| A | 15 | 174 | 242756 | 1177.26 | 828 | 808 | 205.5 |
| A | 0 | 8 | 74388 | 358.02 | 828 | 808 | 205.5 |
| A | 8 | 249 | 59504 | 285.6 | 828 | 808 | 205.5 |
| B | 2 | 2 | 2610058 | 14986.75 | 815 | 787 | 174.1 |
| B | 5 | 185 | 333644 | 1911.81 | 815 | 787 | 174.1 |
| B | 7 | 0 | 295984 | 1695.51 | 815 | 787 | 174.1 |
| C | 4 | 5 | 3802110 | 18507.56 | 755 | 748 | 205.4 |
| C | 15 | 189 | 676243 | 3288.76 | 755 | 748 | 205.4 |
| C | 13 | 3 | 95805 | 462.8 | 755 | 748 | 205.4 |
| D | 8 | 176 | 7175946 | 41744.56 | 603 | 574 | 171.9 |
| D | 2 | 165 | 996449 | 5793.76 | 603 | 574 | 171.9 |
| D | 15 | 217 | 247377 | 1435.84 | 603 | 574 | 171.9 |
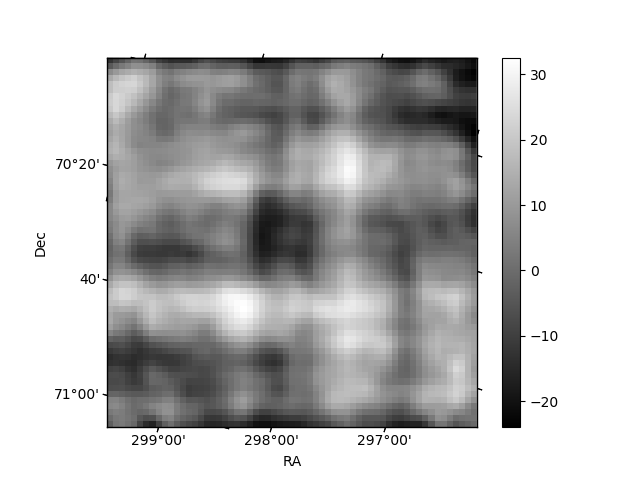
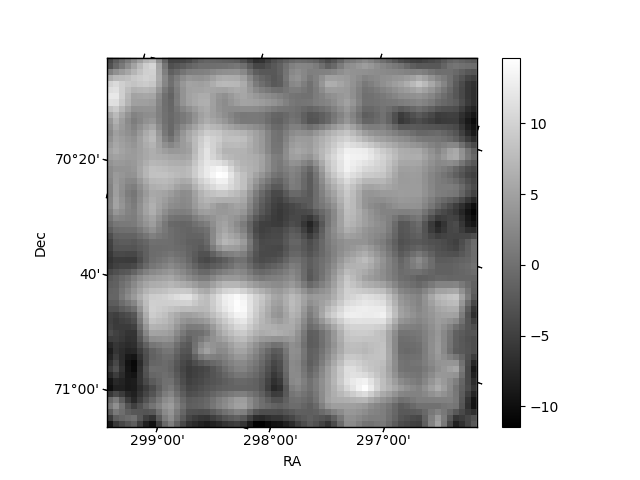
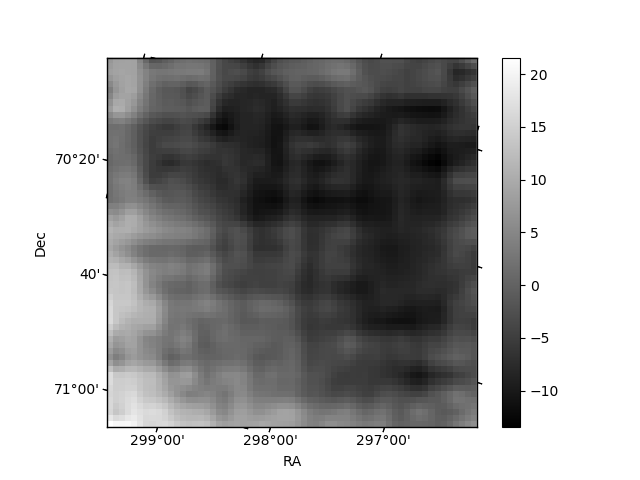
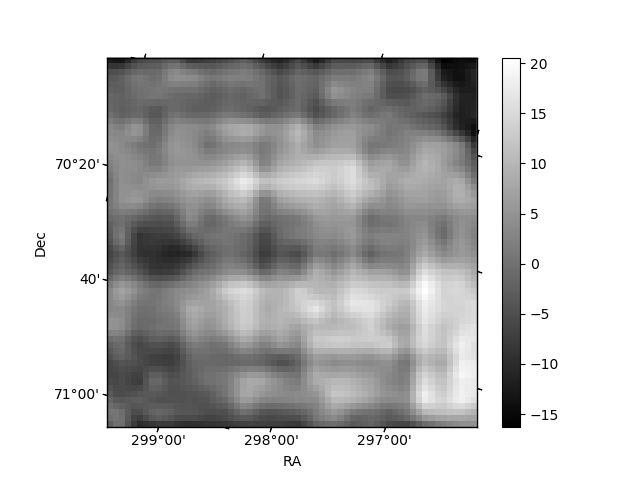
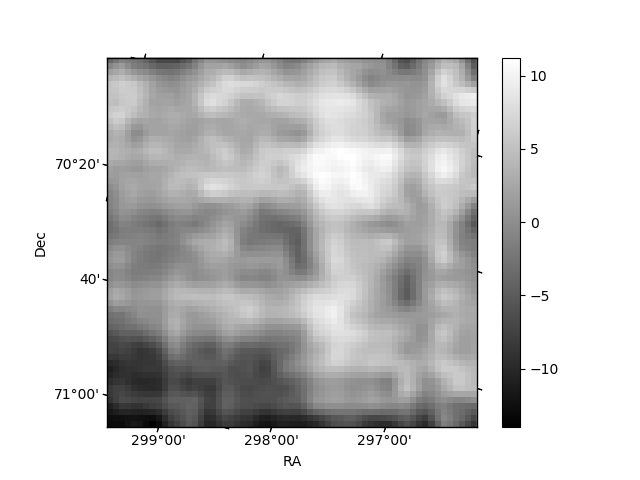
Histogram calculated using DETX and DETY for each event in the final _common_clean file
| Quadrant A | 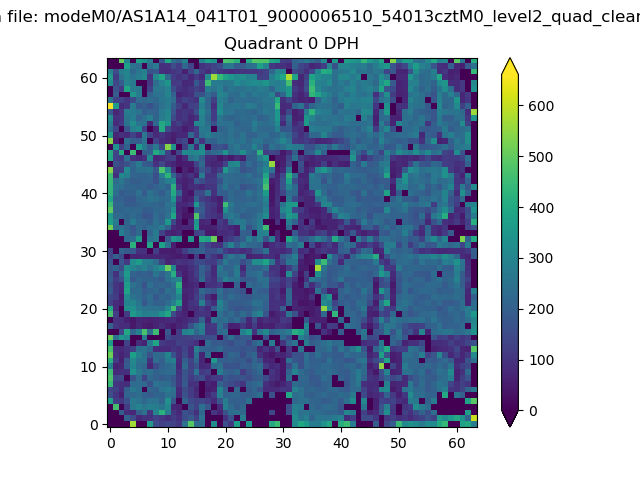 |
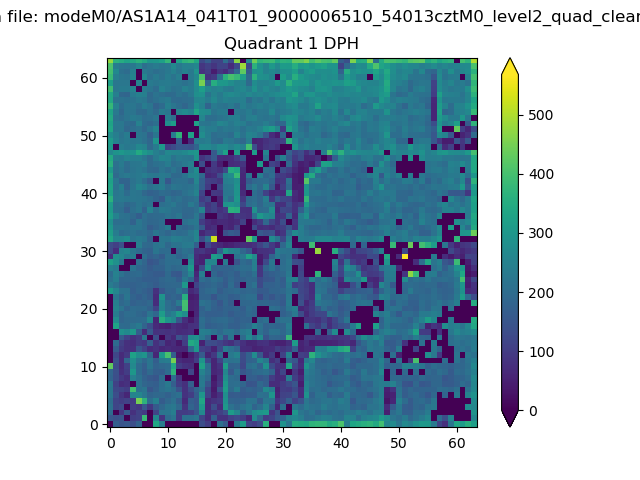 |
Quadrant B |
|---|---|---|---|
| Quadrant D | 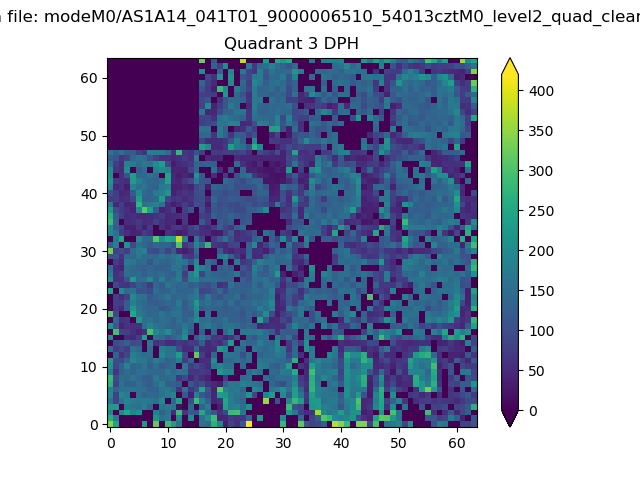 |
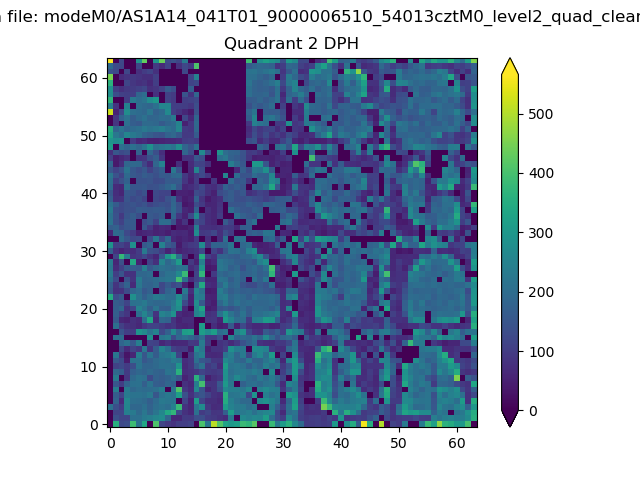 |
Quadrant C |
| Plot type | Count rate plots | Images |
|---|---|---|
| Comparison with Poisson distribution Blue bars denote a histogram of data divided into 1 sec bins. Red curve is a Poisson curve with rate = median count rate of data. |
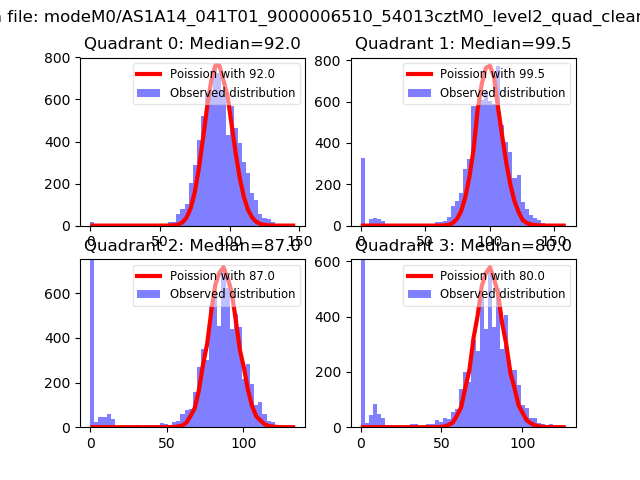 |
 |
| Quadrant-wise count rates Data is divided into 100 sec bins |
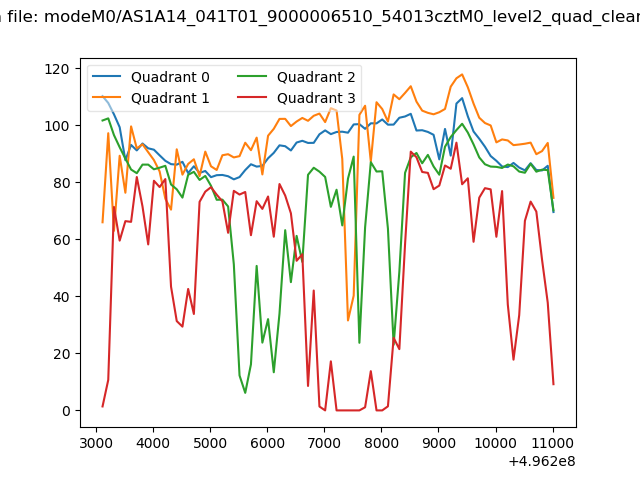 |
|
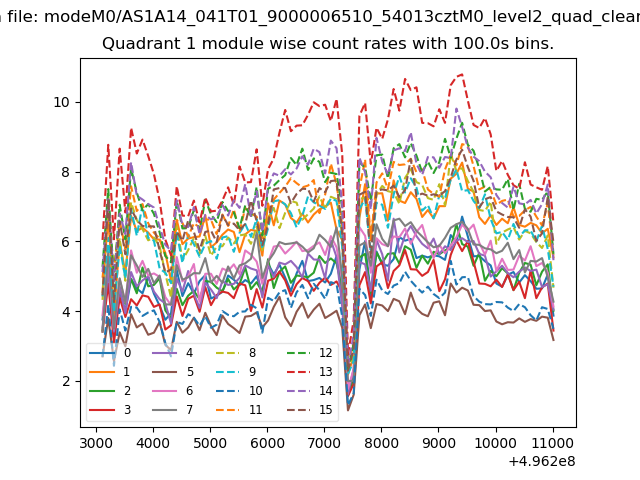
| Module-wise count rates for Quadrant A Data is divided into 100 sec bins |
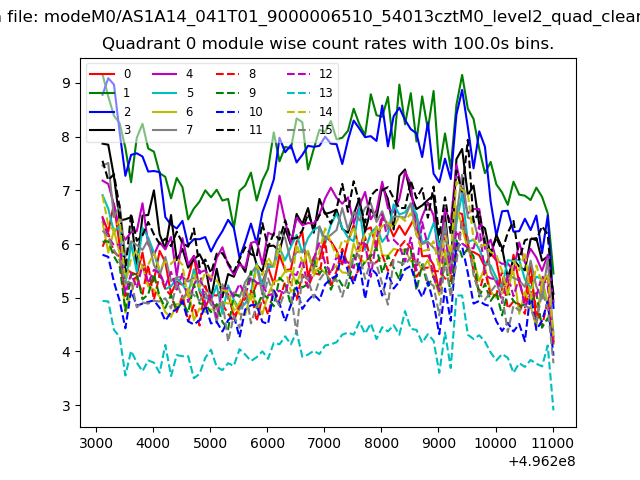 |
 |
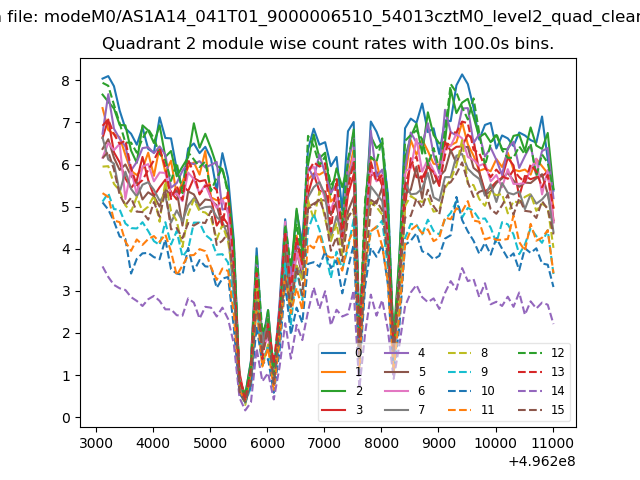
| Module-wise count rates for Quadrant B Data is divided into 100 sec bins |
 |
 |
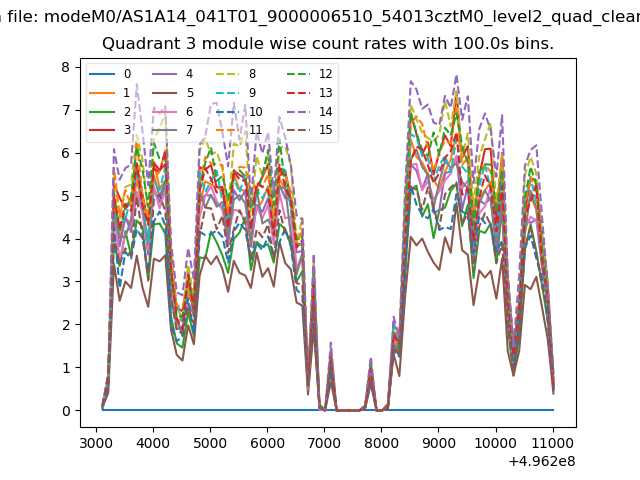
| Module-wise count rates for Quadrant C Data is divided into 100 sec bins |
 |
 |
| Module-wise count rates for Quadrant D Data is divided into 100 sec bins |
 |
 |
| Parameter | Plot |
|---|---|
| CZT HV Monitor | 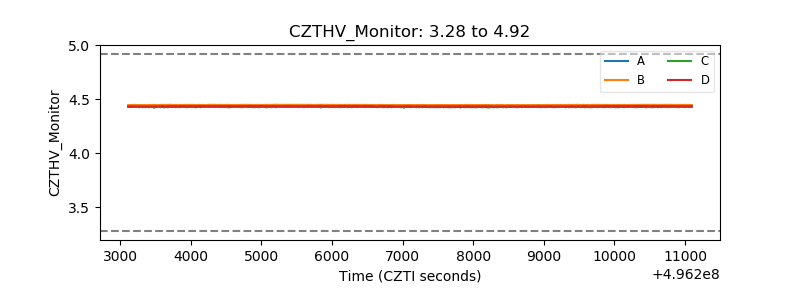 |
| D_VDD | 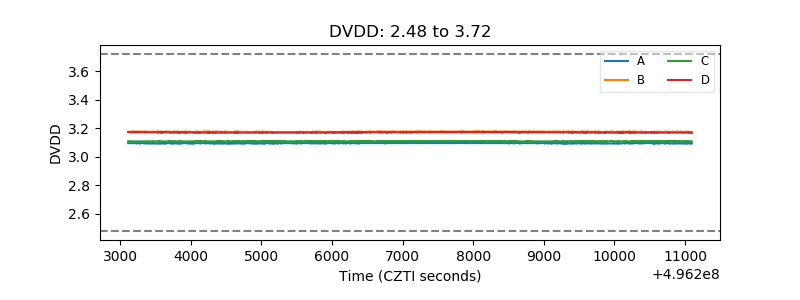 |
| Temperature 1 | 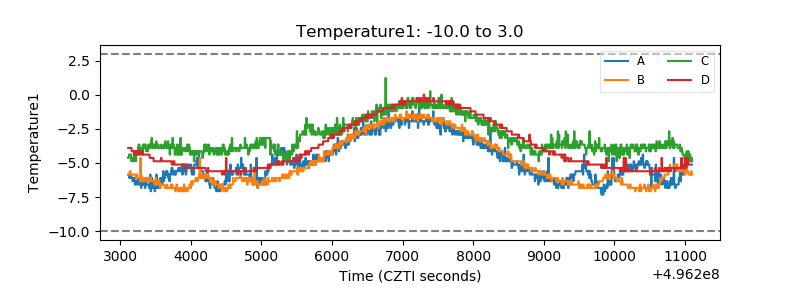 |
| Veto HV Monitor | 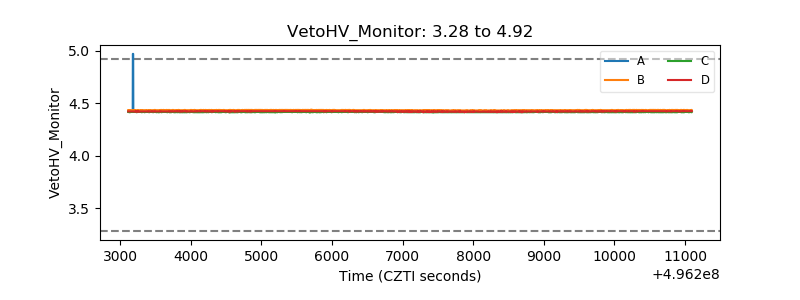 |
| Veto LLD | 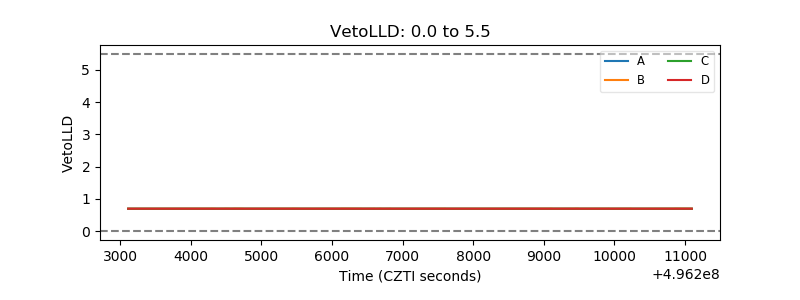 |
| Alpha Counter | 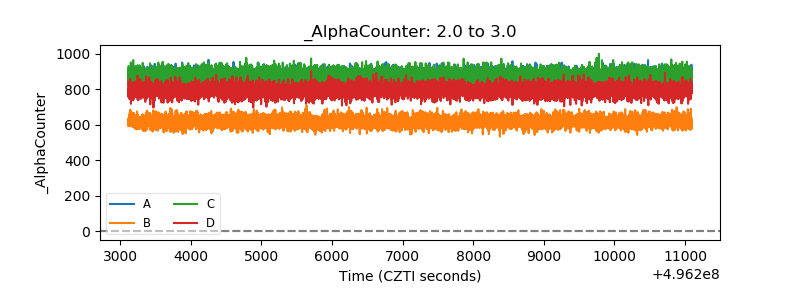 |
| _CPM_Rate | 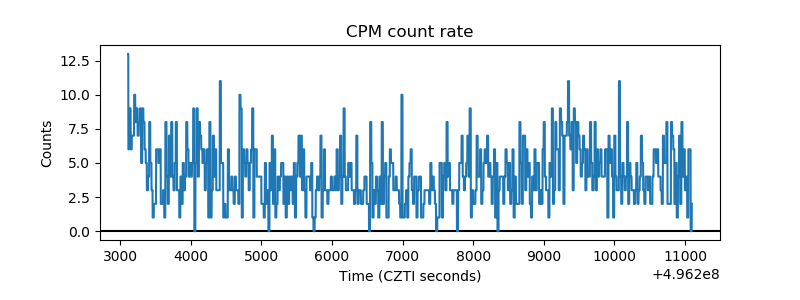 |
| CZT Counter | 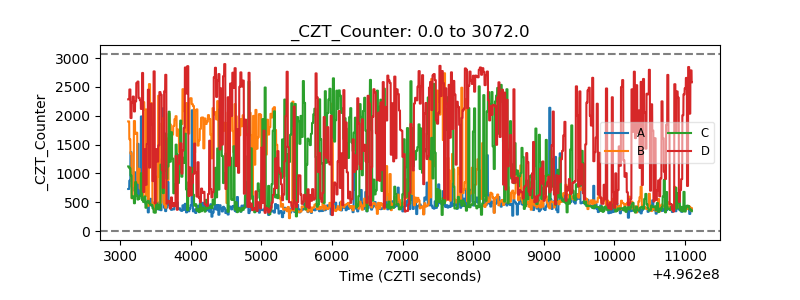 |
| +2.5 Volts monitor |  |
| +5 Volts monitor |  |
| _ROLL_ROT | 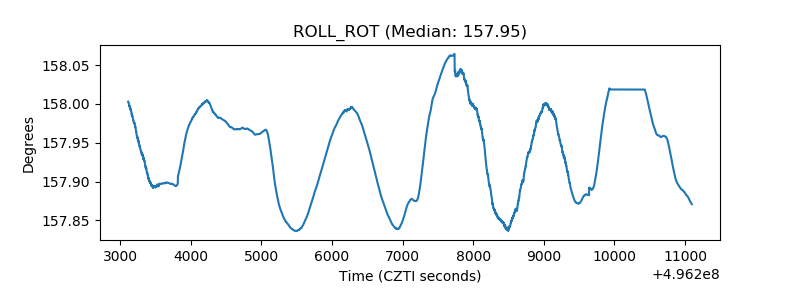 |
| _Roll_DEC | 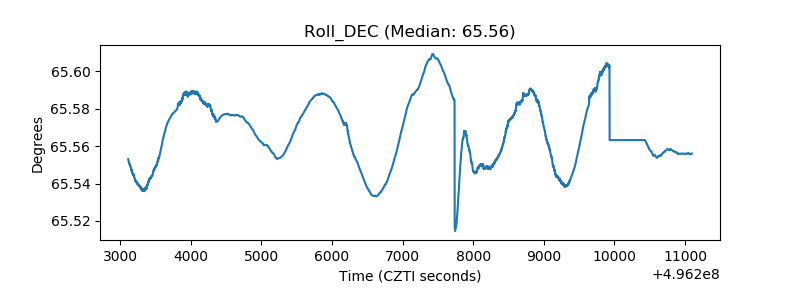 |
| _Roll_RA | 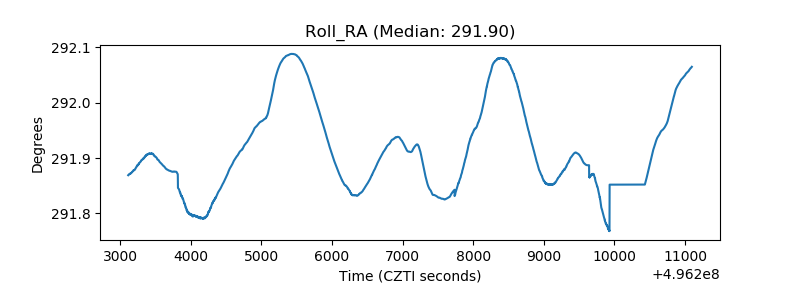 |
| Veto Counter | 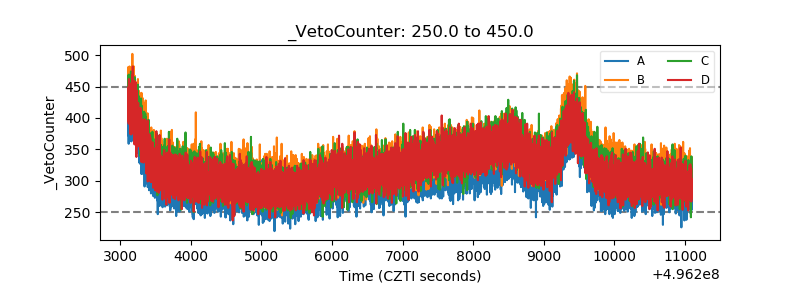 |