| Param | Original file | Final file |
|---|---|---|
| Filename | modeM0/AS1A14_041T01_9000006510_54018cztM0_level2.fits | modeM0/AS1A14_041T01_9000006510_54018cztM0_level2_quad_clean.evt |
| Size (bytes) | 2,480,042,880 | 348,264,000 |
| Size | 2.3 GB | 332.1 MB |
| Events in quadrant A | 13,173,962 | 2,526,524 |
| Events in quadrant B | 18,562,424 | 2,677,418 |
| Events in quadrant C | 15,300,341 | 2,359,083 |
| Events in quadrant D | 42,664,505 | 1,112,386 |
| Mode M9 | |||
|---|---|---|---|
| Quadrant | BADHDUFLAG | Total packets | Discarded packets |
| A | 0 | 18 | 0 |
| B | 0 | 18 | 0 |
| C | 0 | 18 | 0 |
| D | 0 | 18 | 0 |
| Mode SS | |||
|---|---|---|---|
| Quadrant | BADHDUFLAG | Total packets | Discarded packets |
| A | 0 | 548 | 0 |
| B | 0 | 548 | 0 |
| C | 0 | 548 | 0 |
| D | 0 | 548 | 0 |
| Mode M0 | |||
|---|---|---|---|
| Quadrant | BADHDUFLAG | Total packets | Discarded packets |
| A | 0 | 59571 | 9 |
| B | 0 | 74325 | 4 |
| C | 0 | 66109 | 4 |
| D | 0 | 145523 | 23 |
| Quadrant | Total seconds | Saturated seconds | Saturation percentage |
|---|---|---|---|
| A | 27168 | 552 | 2.031802% |
| B | 27170 | 1475 | 5.428782% |
| C | 27170 | 858 | 3.157895% |
| D | 27168 | 13707 | 50.452739% |
Noise dominated data is calculated using 1-second bins in cleaned event files. If a bin has >2000 counts, and if more than 50% of those come from <1% of pixels, then it is considered to be noise-dominated and hence unusable.
| Quadrant | # 1 sec bins | Bins with >0 counts | Bins with >2000 counts | High rate bins dominated by noise | Noise dominated (total time) | Noise dominated (detector-on time) | Marked lightcurve |
|---|---|---|---|---|---|---|---|
| A | 32130 | 27174 | 243 | 243 | 0.76% | 0.89% | 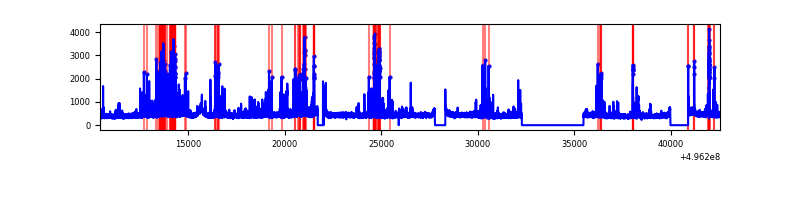 |
| B | 32130 | 27175 | 767 | 767 | 2.39% | 2.82% | 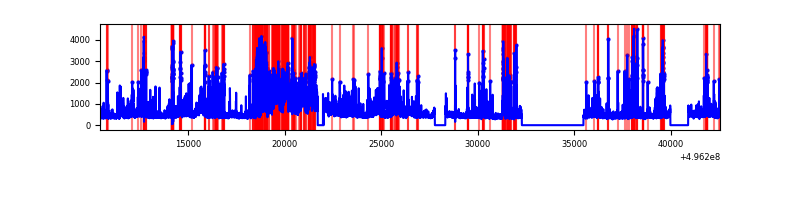 |
| C | 32130 | 27175 | 653 | 653 | 2.03% | 2.40% | 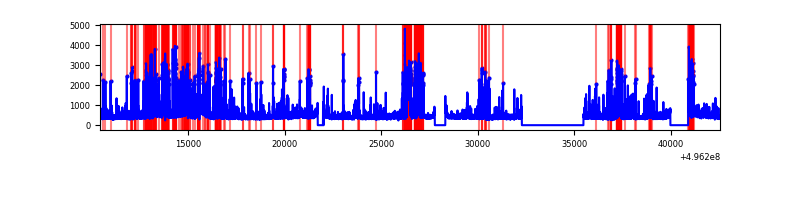 |
| D | 32131 | 27171 | 9477 | 9477 | 29.49% | 34.88% | 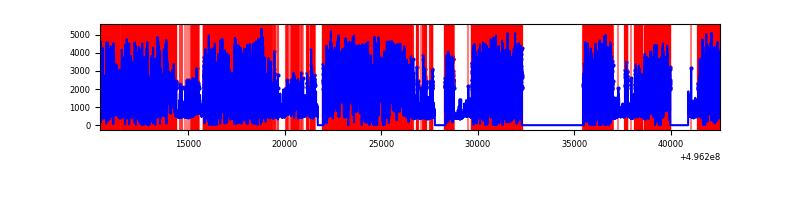 |
Top three noisy pixels from each quadrant. If the there are fewer than three noisy pixels in the level2.evt file, extra rows are filled as -1
| Pixel properties | Quadrant properties | ||||||
|---|---|---|---|---|---|---|---|
| Quadrant | DetID | PixID | Counts | Sigma | Mean | Median | Sigma |
| A | 15 | 174 | 829374 | 1171.22 | 2854 | 2774 | 705.8 |
| A | 8 | 249 | 796640 | 1124.84 | 2854 | 2774 | 705.8 |
| A | 8 | 6 | 103360 | 142.52 | 2854 | 2774 | 705.8 |
| B | 5 | 250 | 2742931 | 4663.82 | 2799 | 2704 | 587.6 |
| B | 0 | 213 | 1390642 | 2362.25 | 2799 | 2704 | 587.6 |
| B | 2 | 2 | 1077332 | 1829.0 | 2799 | 2704 | 587.6 |
| C | 4 | 5 | 1245212 | 1645.86 | 2757 | 2734 | 754.9 |
| C | 14 | 80 | 483107 | 636.33 | 2757 | 2734 | 754.9 |
| C | 5 | 10 | 452942 | 596.37 | 2757 | 2734 | 754.9 |
| D | 8 | 176 | 32671092 | 62802.92 | 1838 | 1760 | 520.2 |
| D | 2 | 165 | 1159532 | 2225.68 | 1838 | 1760 | 520.2 |
| D | 10 | 172 | 226863 | 432.73 | 1838 | 1760 | 520.2 |
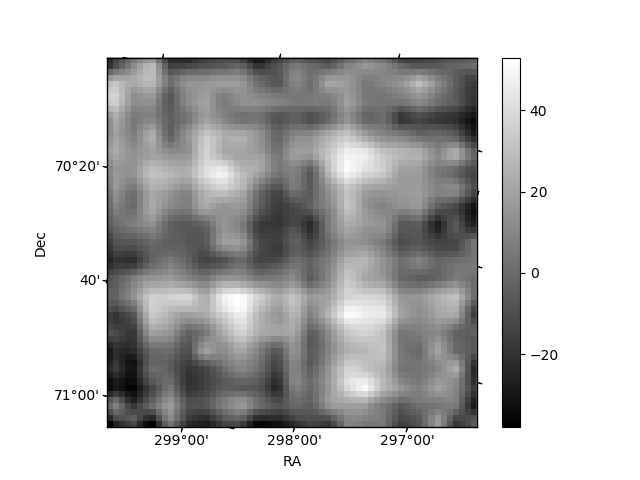
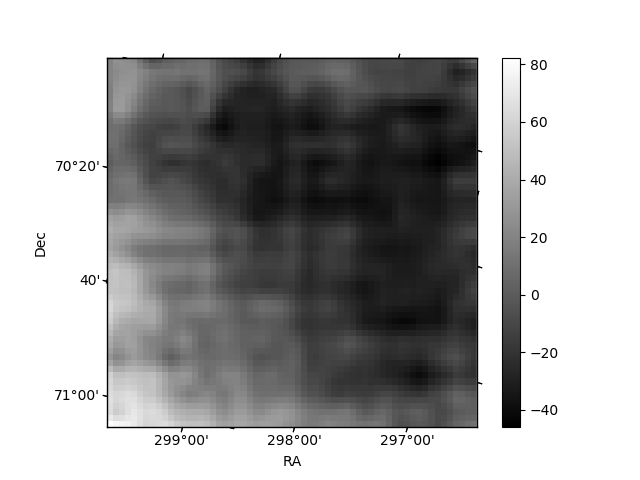
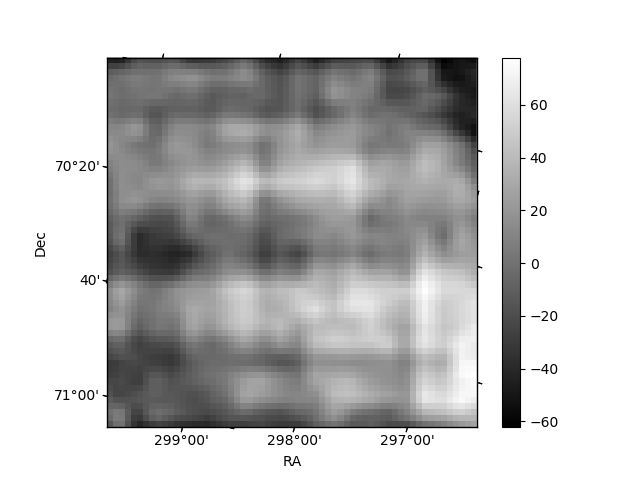
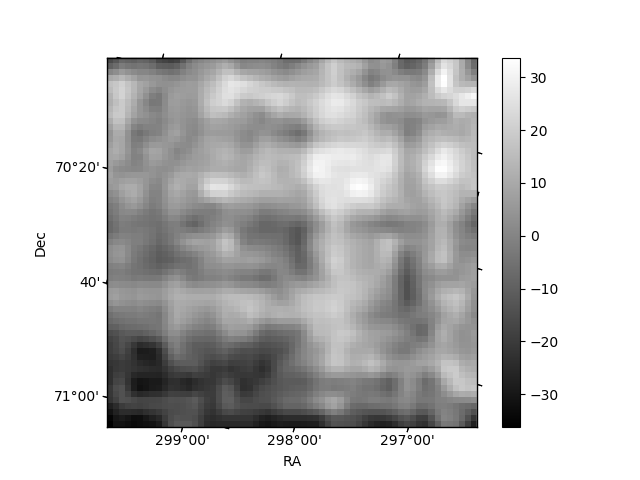
Histogram calculated using DETX and DETY for each event in the final _common_clean file
| Quadrant A | 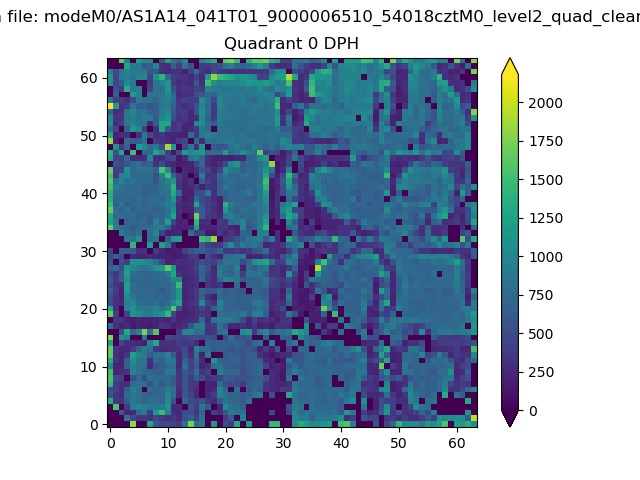 |
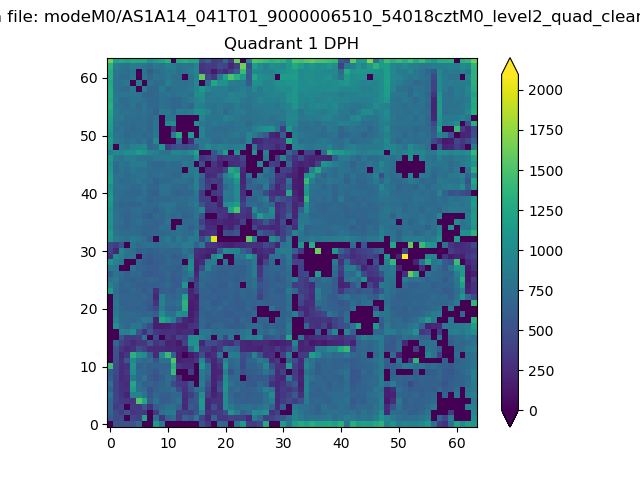 |
Quadrant B |
|---|---|---|---|
| Quadrant D | 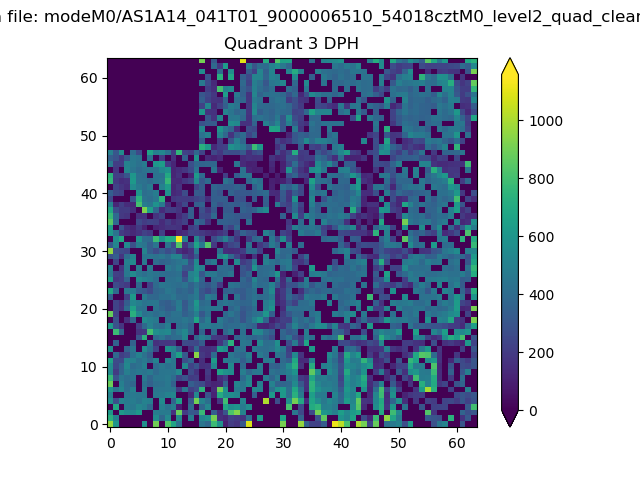 |
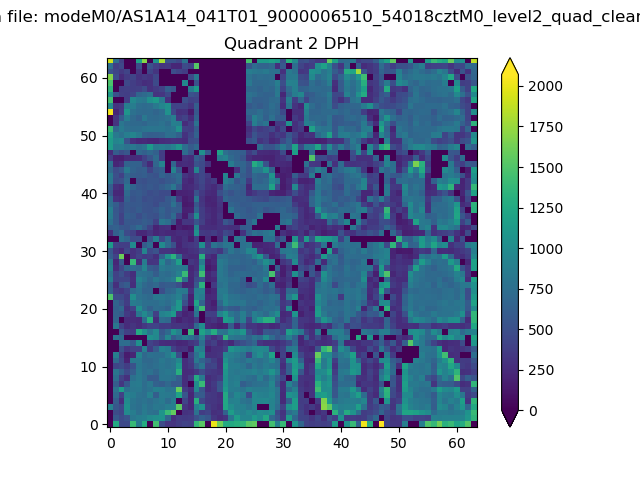 |
Quadrant C |
| Plot type | Count rate plots | Images |
|---|---|---|
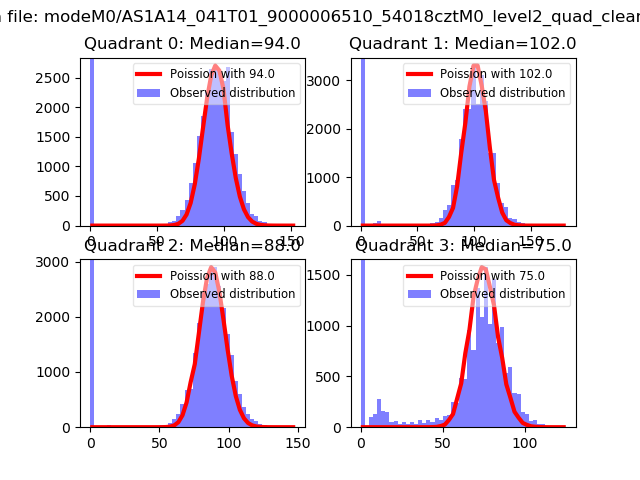
| Comparison with Poisson distribution Blue bars denote a histogram of data divided into 1 sec bins. Red curve is a Poisson curve with rate = median count rate of data. |
 |
 |
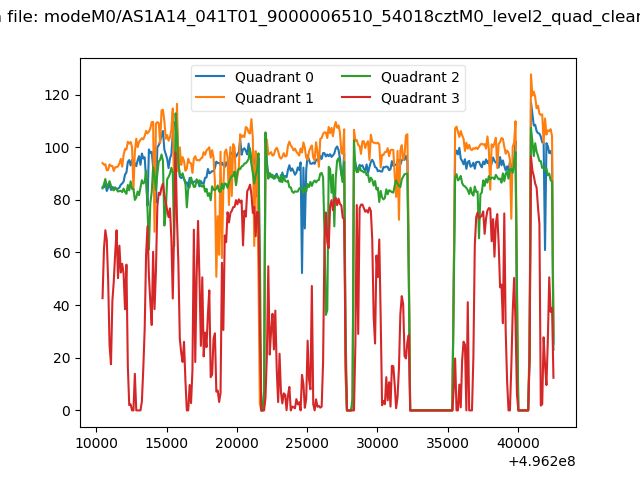
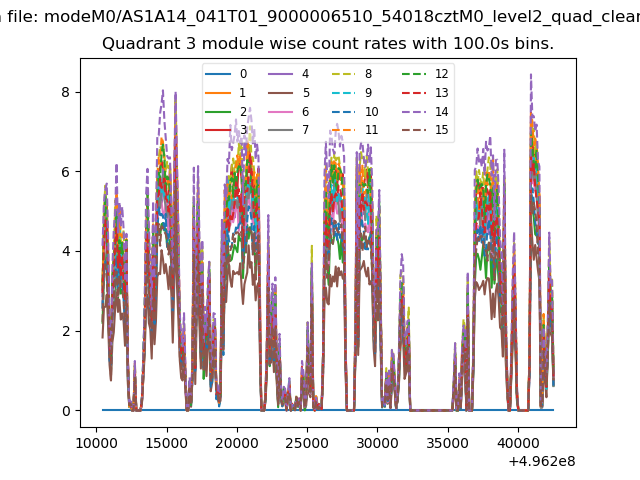
| Quadrant-wise count rates Data is divided into 100 sec bins |
 |
|
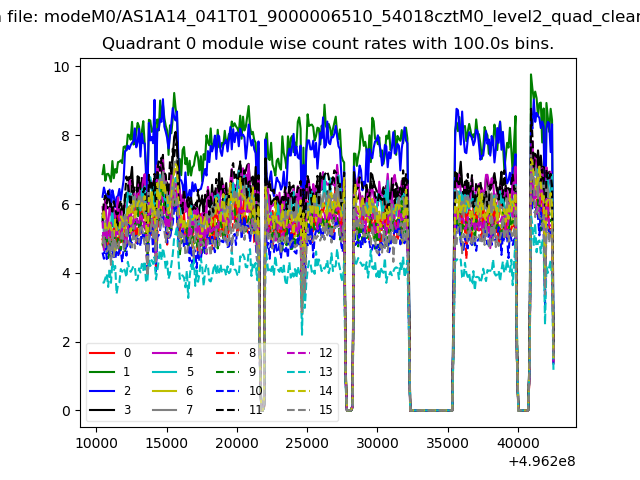
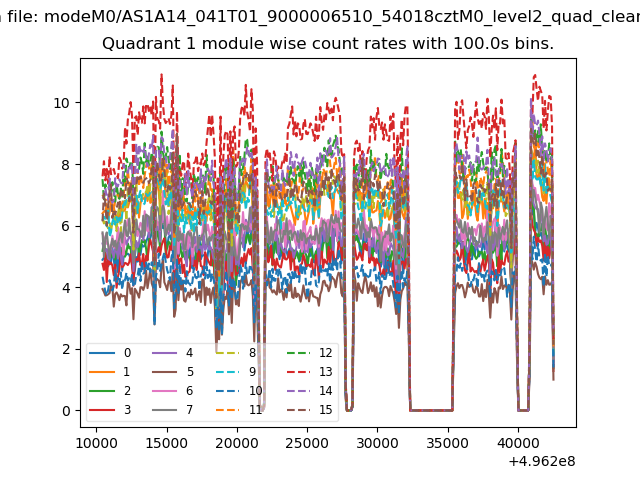
| Module-wise count rates for Quadrant A Data is divided into 100 sec bins |
 |
 |
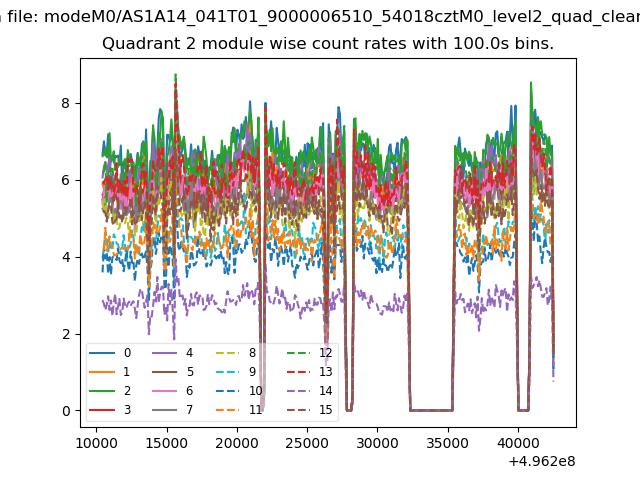
| Module-wise count rates for Quadrant B Data is divided into 100 sec bins |
 |
 |
| Module-wise count rates for Quadrant C Data is divided into 100 sec bins |
 |
 |
| Module-wise count rates for Quadrant D Data is divided into 100 sec bins |
 |
 |
| Parameter | Plot |
|---|---|
| CZT HV Monitor | 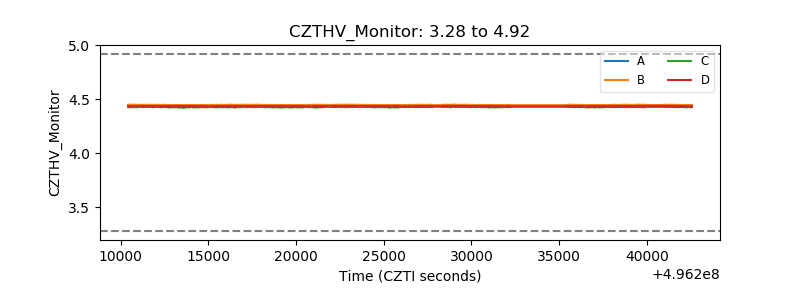 |
| D_VDD | 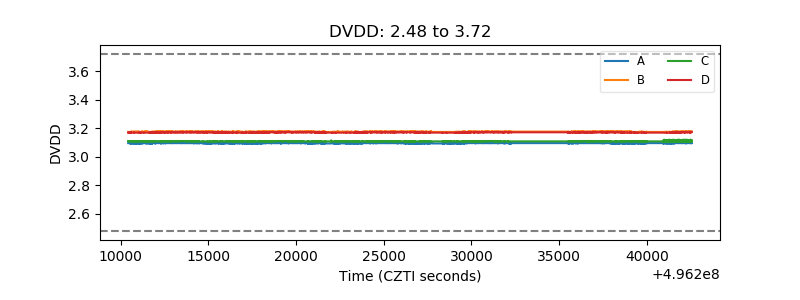 |
| Temperature 1 | 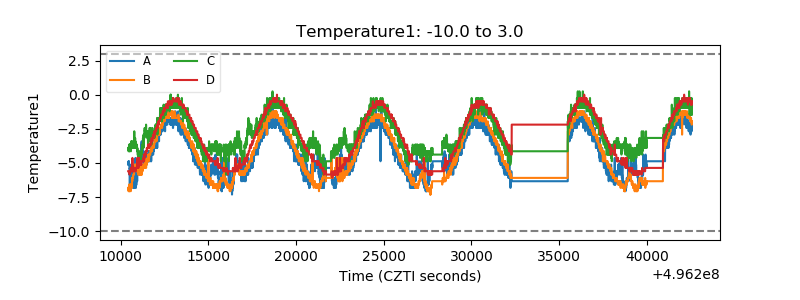 |
| Veto HV Monitor |  |
| Veto LLD | 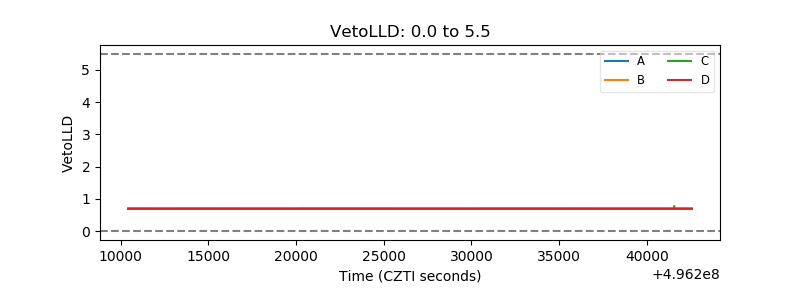 |
| Alpha Counter | 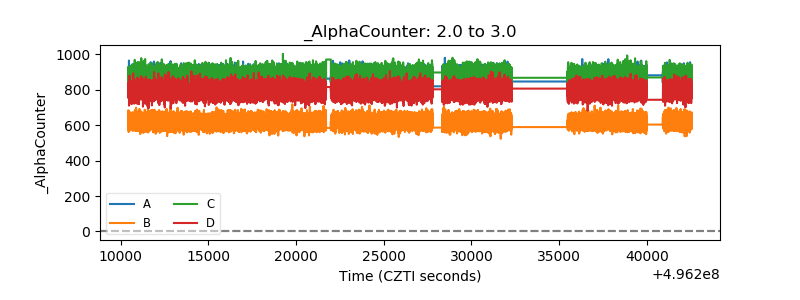 |
| _CPM_Rate | 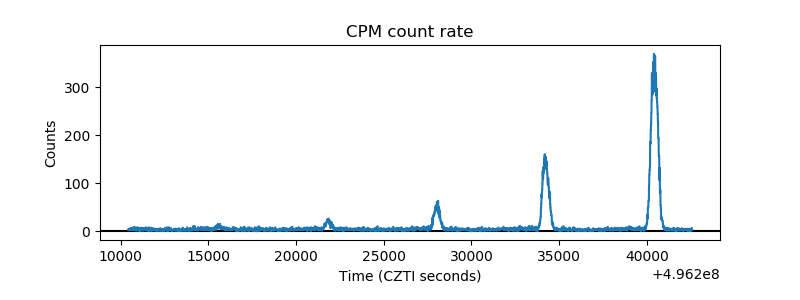 |
| CZT Counter | 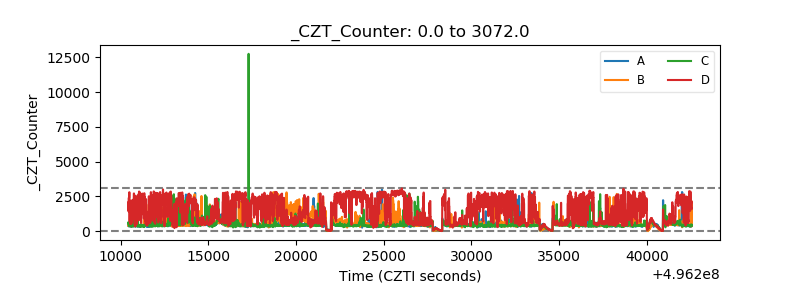 |
| +2.5 Volts monitor |  |
| +5 Volts monitor | 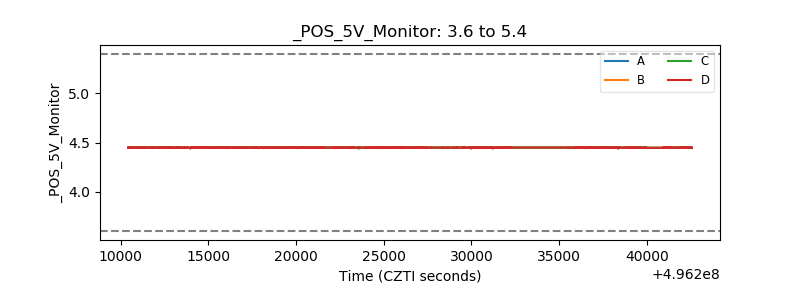 |
| _ROLL_ROT | 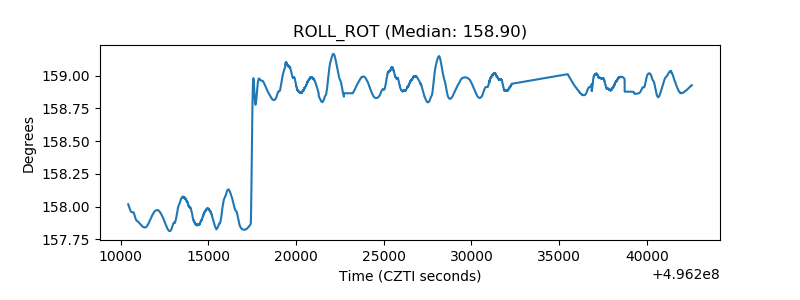 |
| _Roll_DEC | 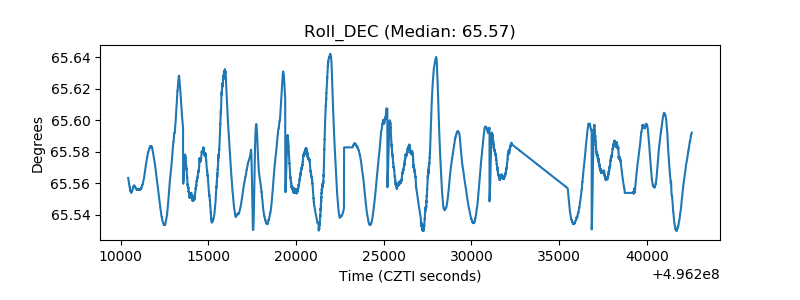 |
| _Roll_RA | 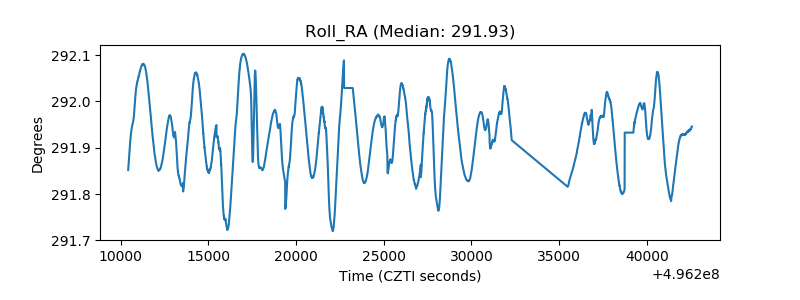 |
| Veto Counter | 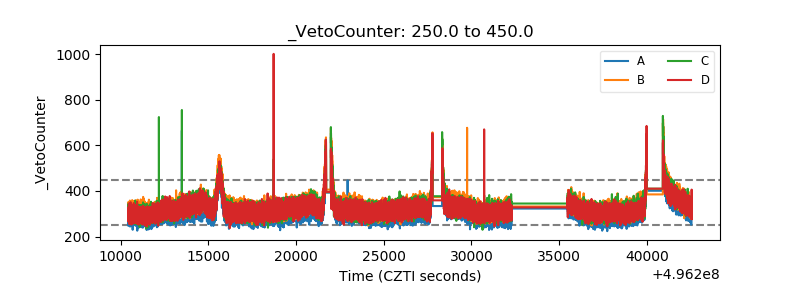 |