| Param | Original file | Final file |
|---|---|---|
| Filename | modeM0/AS1A14_041T01_9000006510_54020cztM0_level2.fits | modeM0/AS1A14_041T01_9000006510_54020cztM0_level2_quad_clean.evt |
| Size (bytes) | 536,834,880 | 83,897,280 |
| Size | 512.0 MB | 80.0 MB |
| Events in quadrant A | 3,085,794 | 608,908 |
| Events in quadrant B | 3,318,558 | 659,091 |
| Events in quadrant C | 3,507,509 | 557,882 |
| Events in quadrant D | 9,473,207 | 277,948 |
| Mode M9 | |||
|---|---|---|---|
| Quadrant | BADHDUFLAG | Total packets | Discarded packets |
| A | 0 | 10 | 0 |
| B | 0 | 10 | 0 |
| C | 0 | 10 | 0 |
| D | 0 | 10 | 0 |
| Mode SS | |||
|---|---|---|---|
| Quadrant | BADHDUFLAG | Total packets | Discarded packets |
| A | 0 | 128 | 0 |
| B | 0 | 128 | 0 |
| C | 0 | 128 | 0 |
| D | 0 | 128 | 0 |
| Mode M0 | |||
|---|---|---|---|
| Quadrant | BADHDUFLAG | Total packets | Discarded packets |
| A | 0 | 13747 | 1 |
| B | 0 | 14302 | 1 |
| C | 0 | 15093 | 1 |
| D | 0 | 32541 | 2 |
| Quadrant | Total seconds | Saturated seconds | Saturation percentage |
|---|---|---|---|
| A | 6247 | 136 | 2.177045% |
| B | 6248 | 129 | 2.064661% |
| C | 6248 | 248 | 3.969270% |
| D | 6247 | 3162 | 50.616296% |
Noise dominated data is calculated using 1-second bins in cleaned event files. If a bin has >2000 counts, and if more than 50% of those come from <1% of pixels, then it is considered to be noise-dominated and hence unusable.
| Quadrant | # 1 sec bins | Bins with >0 counts | Bins with >2000 counts | High rate bins dominated by noise | Noise dominated (total time) | Noise dominated (detector-on time) | Marked lightcurve |
|---|---|---|---|---|---|---|---|
| A | 7292 | 6248 | 80 | 80 | 1.10% | 1.28% | 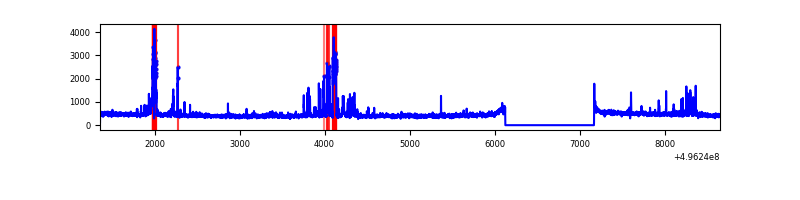 |
| B | 7293 | 6249 | 63 | 63 | 0.86% | 1.01% | 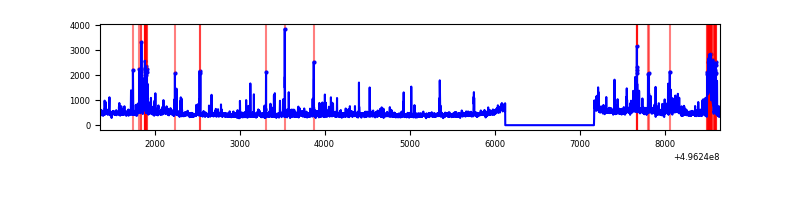 |
| C | 7293 | 6249 | 145 | 145 | 1.99% | 2.32% | 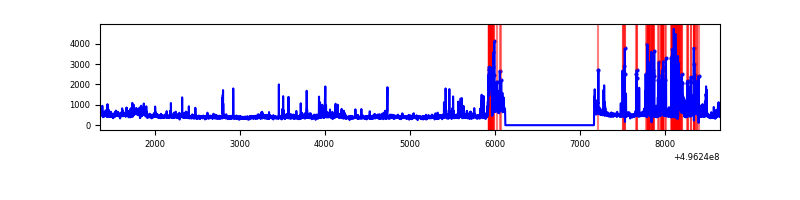 |
| D | 7292 | 6247 | 2153 | 2153 | 29.53% | 34.46% | 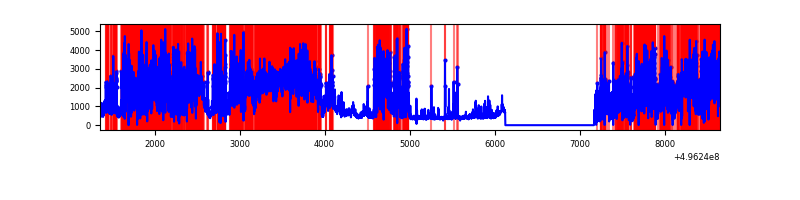 |
Top three noisy pixels from each quadrant. If the there are fewer than three noisy pixels in the level2.evt file, extra rows are filled as -1
| Pixel properties | Quadrant properties | ||||||
|---|---|---|---|---|---|---|---|
| Quadrant | DetID | PixID | Counts | Sigma | Mean | Median | Sigma |
| A | 15 | 174 | 415939 | 2547.35 | 664 | 649 | 163.0 |
| A | 3 | 14 | 33684 | 202.63 | 664 | 649 | 163.0 |
| A | 13 | 254 | 13431 | 78.4 | 664 | 649 | 163.0 |
| B | 0 | 213 | 173048 | 1224.99 | 660 | 638 | 140.7 |
| B | 0 | 155 | 123367 | 872.0 | 660 | 638 | 140.7 |
| B | 5 | 185 | 122002 | 862.3 | 660 | 638 | 140.7 |
| C | 14 | 80 | 388781 | 2212.64 | 639 | 632 | 175.4 |
| C | 15 | 189 | 210396 | 1195.76 | 639 | 632 | 175.4 |
| C | 9 | 38 | 110093 | 623.98 | 639 | 632 | 175.4 |
| D | 8 | 176 | 7236080 | 61183.02 | 412 | 393 | 118.3 |
| D | 3 | 144 | 130289 | 1098.37 | 412 | 393 | 118.3 |
| D | 14 | 20 | 74329 | 625.18 | 412 | 393 | 118.3 |
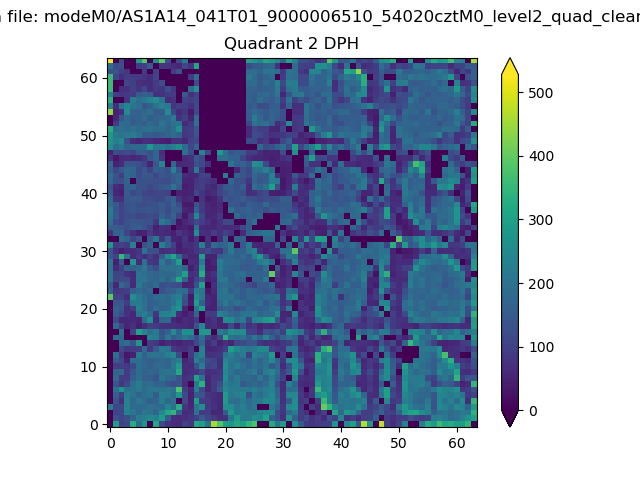
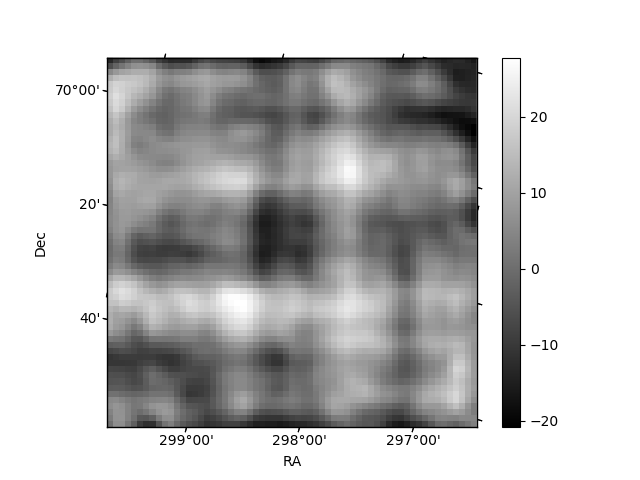
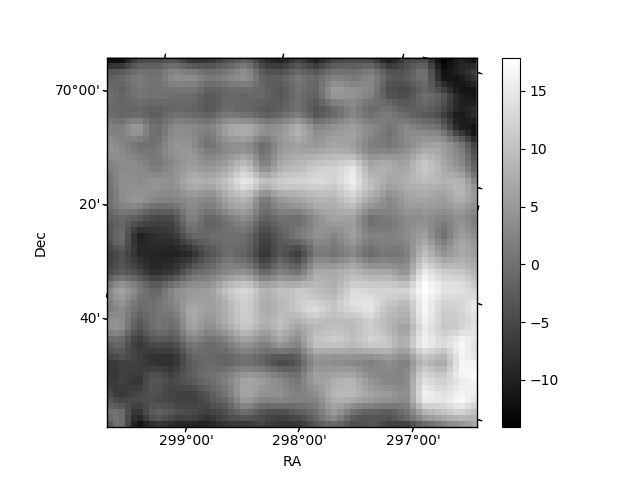
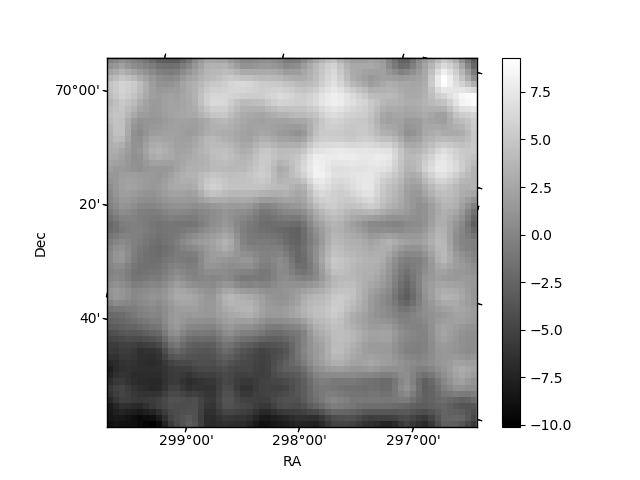
Histogram calculated using DETX and DETY for each event in the final _common_clean file
| Quadrant A | 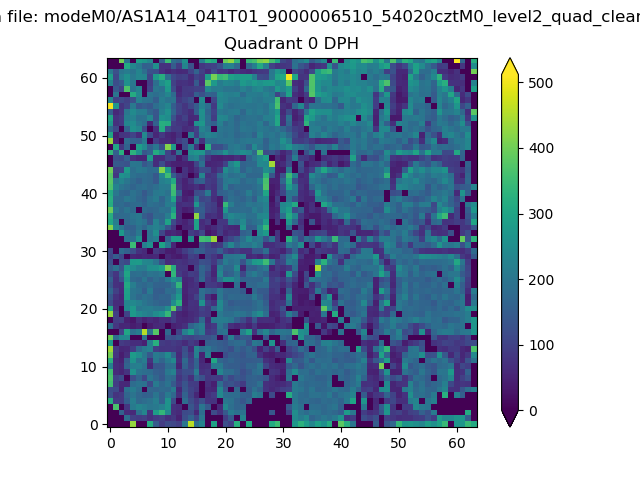 |
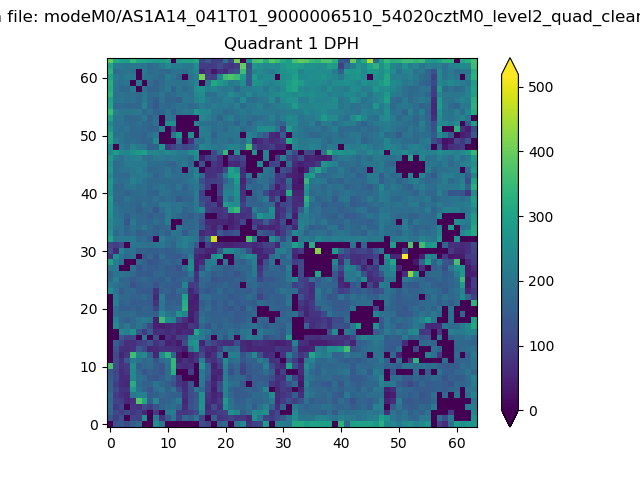 |
Quadrant B |
|---|---|---|---|
| Quadrant D | 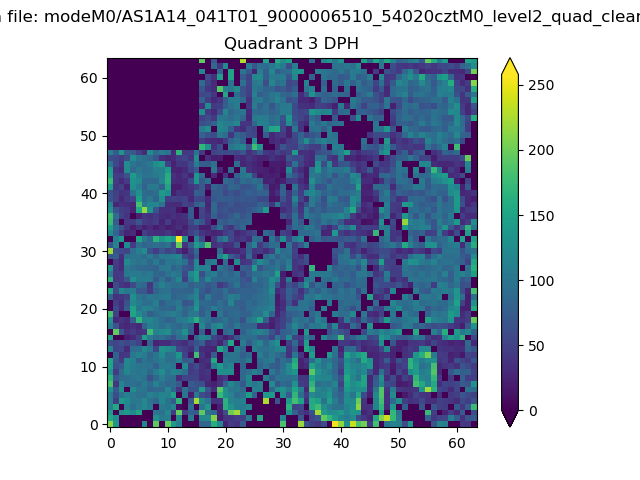 |
 |
Quadrant C |
| Plot type | Count rate plots | Images |
|---|---|---|
| Comparison with Poisson distribution Blue bars denote a histogram of data divided into 1 sec bins. Red curve is a Poisson curve with rate = median count rate of data. |
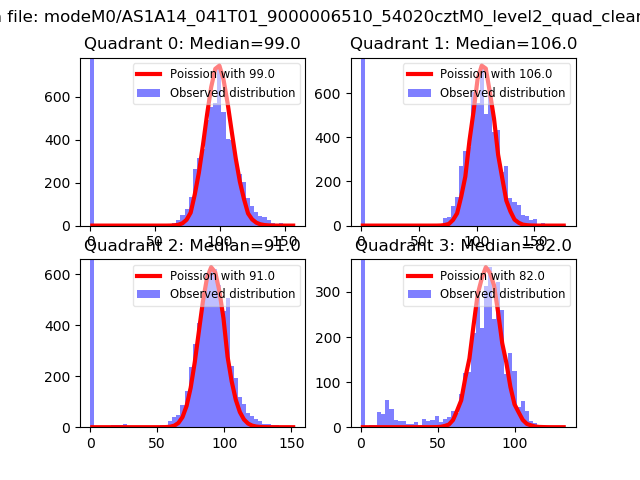 |
 |
| Quadrant-wise count rates Data is divided into 100 sec bins |
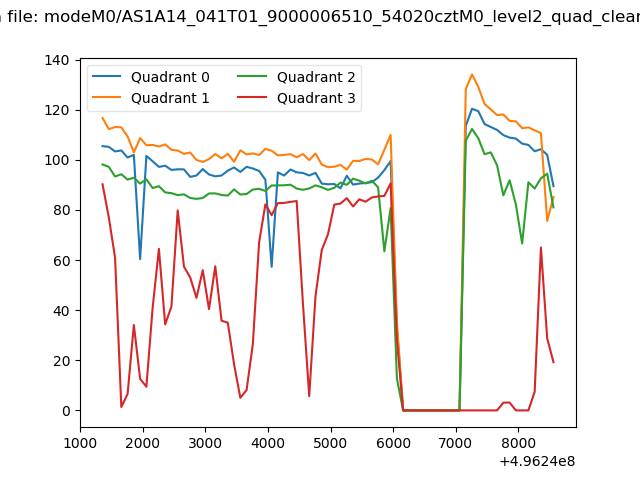 |
|
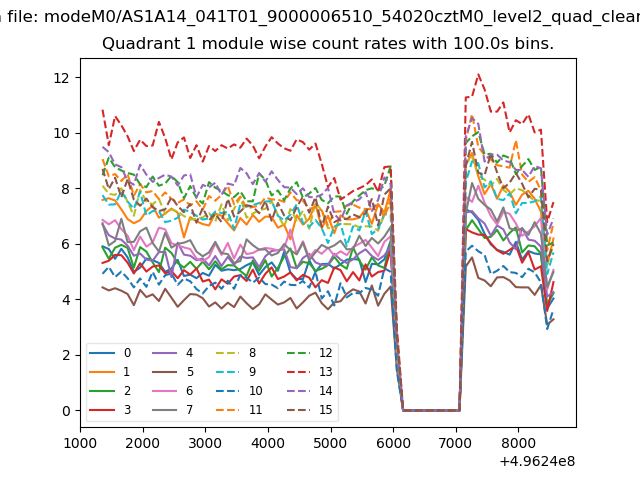
| Module-wise count rates for Quadrant A Data is divided into 100 sec bins |
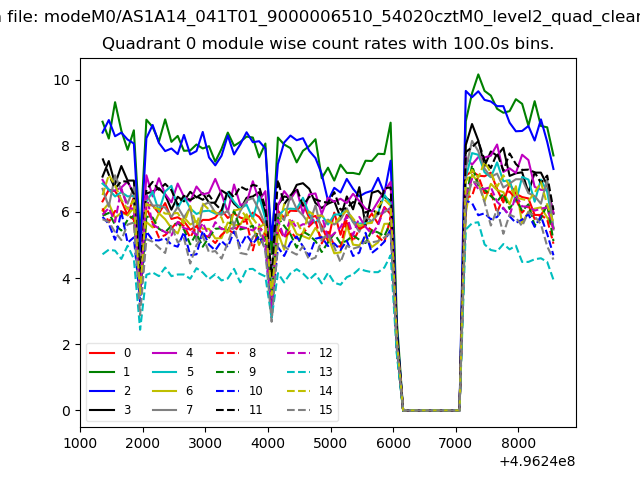 |
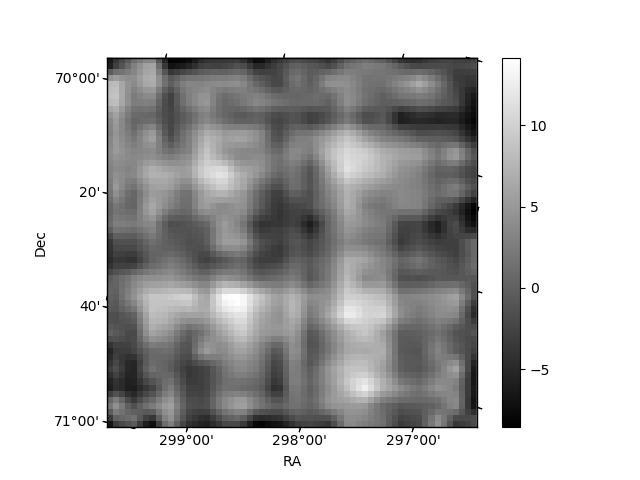 |
| Module-wise count rates for Quadrant B Data is divided into 100 sec bins |
 |
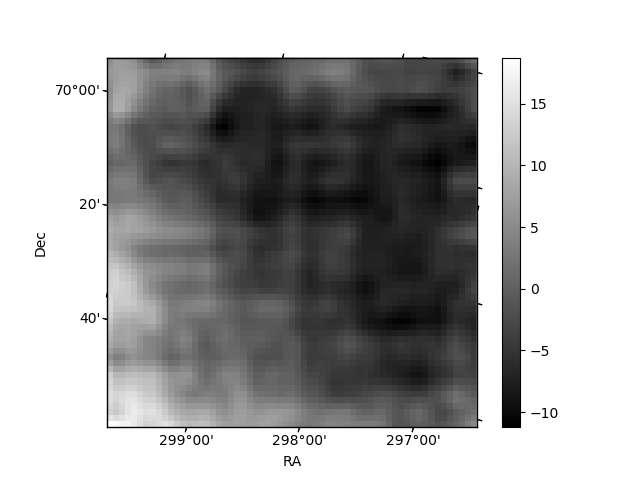 |
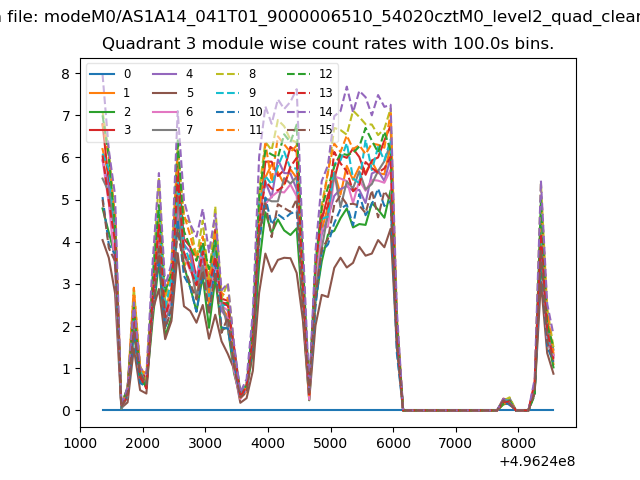
| Module-wise count rates for Quadrant C Data is divided into 100 sec bins |
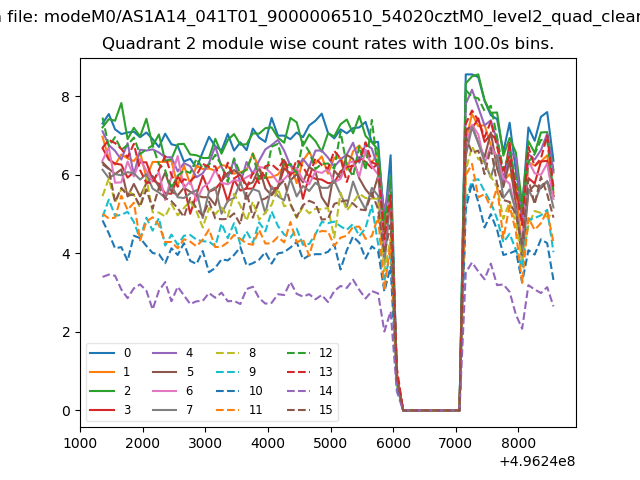 |
 |
| Module-wise count rates for Quadrant D Data is divided into 100 sec bins |
 |
 |
| Parameter | Plot |
|---|---|
| CZT HV Monitor | 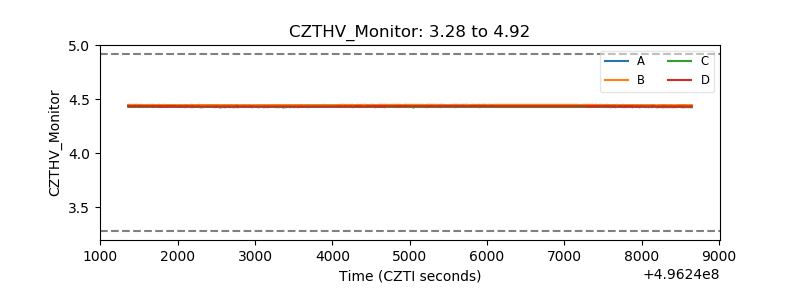 |
| D_VDD | 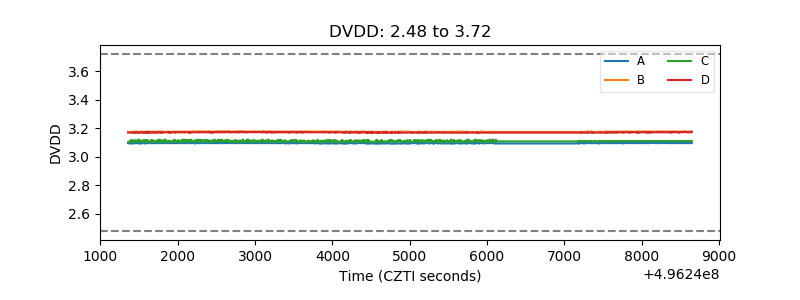 |
| Temperature 1 | 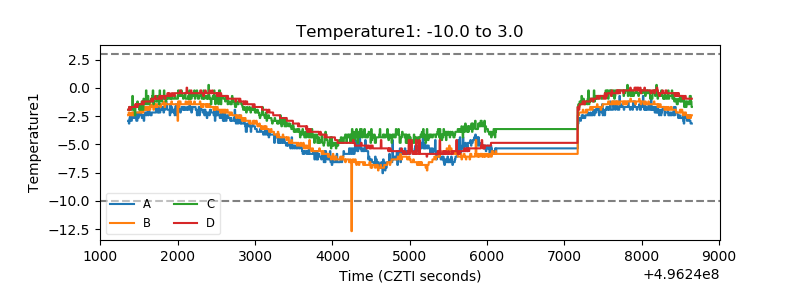 |
| Veto HV Monitor | 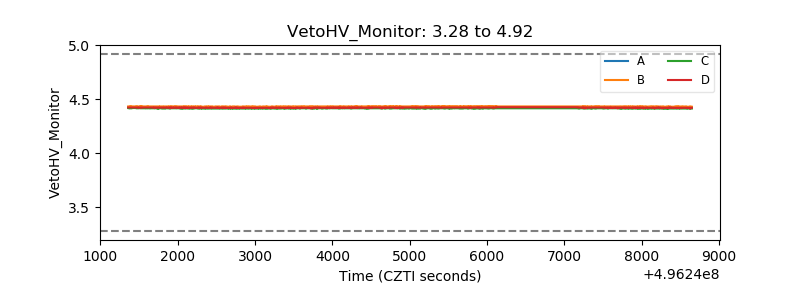 |
| Veto LLD | 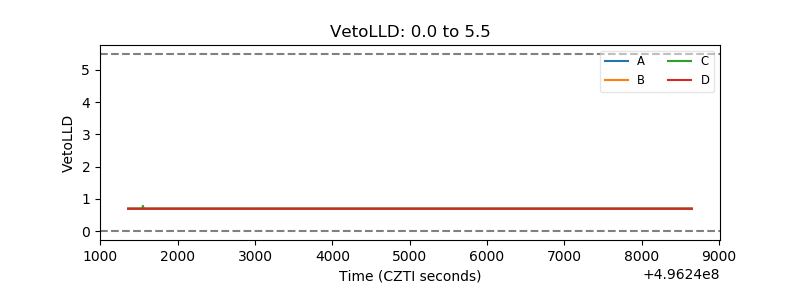 |
| Alpha Counter | 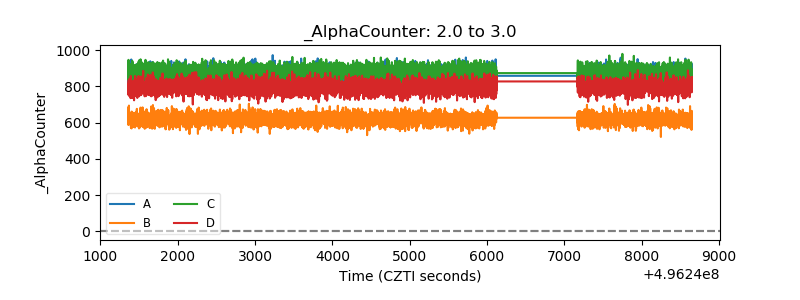 |
| _CPM_Rate | 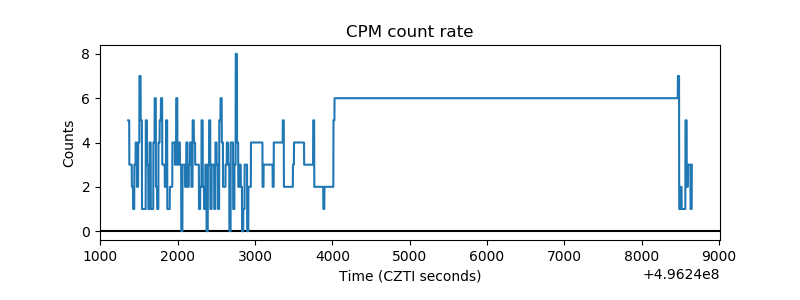 |
| CZT Counter | 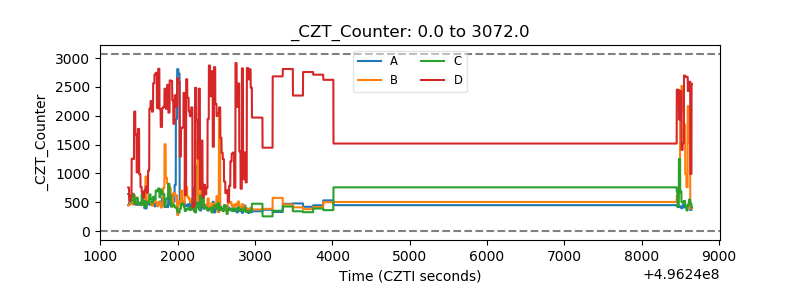 |
| +2.5 Volts monitor |  |
| +5 Volts monitor |  |
| _ROLL_ROT | 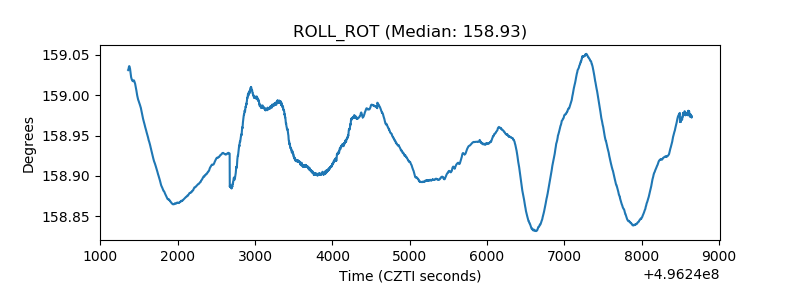 |
| _Roll_DEC | 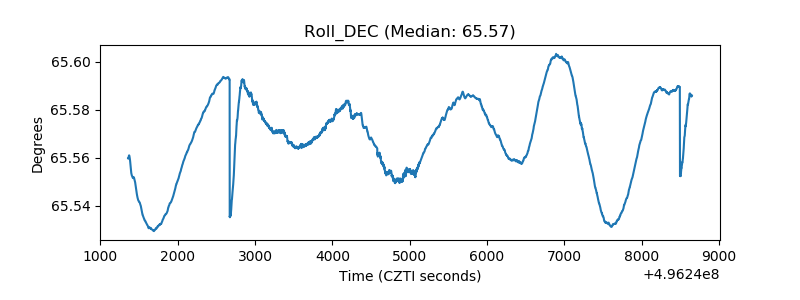 |
| _Roll_RA | 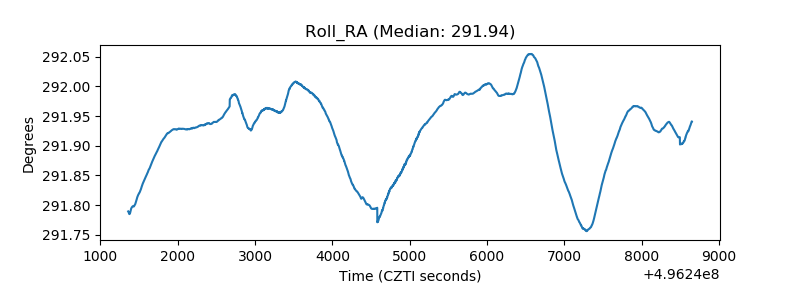 |
| Veto Counter | 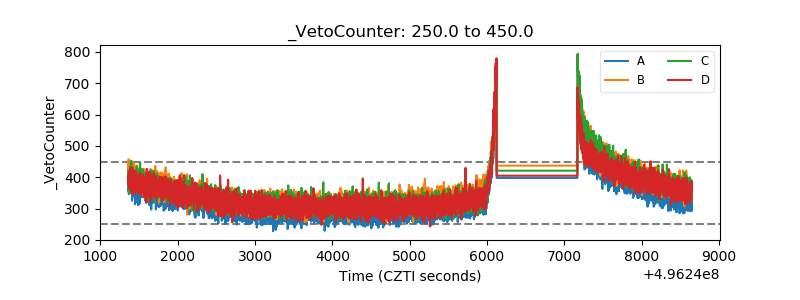 |