| Param | Original file | Final file |
|---|---|---|
| Filename | modeM0/AS1A14_041T01_9000006510_54021cztM0_level2.fits | modeM0/AS1A14_041T01_9000006510_54021cztM0_level2_quad_clean.evt |
| Size (bytes) | 1,198,146,240 | 177,160,320 |
| Size | 1.1 GB | 169.0 MB |
| Events in quadrant A | 6,620,024 | 1,296,504 |
| Events in quadrant B | 7,457,923 | 1,387,308 |
| Events in quadrant C | 7,141,135 | 1,203,481 |
| Events in quadrant D | 22,090,667 | 549,306 |
| Mode M9 | |||
|---|---|---|---|
| Quadrant | BADHDUFLAG | Total packets | Discarded packets |
| A | 0 | 20 | 0 |
| B | 0 | 20 | 0 |
| C | 0 | 20 | 0 |
| D | 0 | 20 | 0 |
| Mode SS | |||
|---|---|---|---|
| Quadrant | BADHDUFLAG | Total packets | Discarded packets |
| A | 0 | 270 | 0 |
| B | 0 | 270 | 0 |
| C | 0 | 270 | 0 |
| D | 0 | 270 | 0 |
| Mode M0 | |||
|---|---|---|---|
| Quadrant | BADHDUFLAG | Total packets | Discarded packets |
| A | 0 | 29634 | 5 |
| B | 0 | 31910 | 2 |
| C | 0 | 31283 | 2 |
| D | 0 | 74914 | 6 |
| Quadrant | Total seconds | Saturated seconds | Saturation percentage |
|---|---|---|---|
| A | 13427 | 221 | 1.645937% |
| B | 13430 | 446 | 3.320923% |
| C | 13430 | 321 | 2.390171% |
| D | 13429 | 7366 | 54.851441% |
Noise dominated data is calculated using 1-second bins in cleaned event files. If a bin has >2000 counts, and if more than 50% of those come from <1% of pixels, then it is considered to be noise-dominated and hence unusable.
| Quadrant | # 1 sec bins | Bins with >0 counts | Bins with >2000 counts | High rate bins dominated by noise | Noise dominated (total time) | Noise dominated (detector-on time) | Marked lightcurve |
|---|---|---|---|---|---|---|---|
| A | 25170 | 13430 | 82 | 82 | 0.33% | 0.61% | 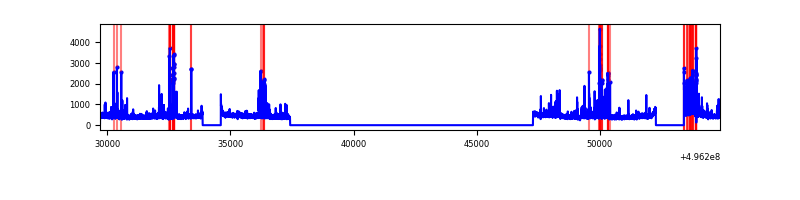 |
| B | 25171 | 13433 | 222 | 222 | 0.88% | 1.65% | 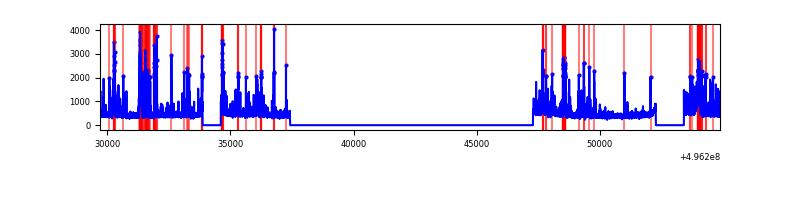 |
| C | 25171 | 13433 | 212 | 212 | 0.84% | 1.58% | 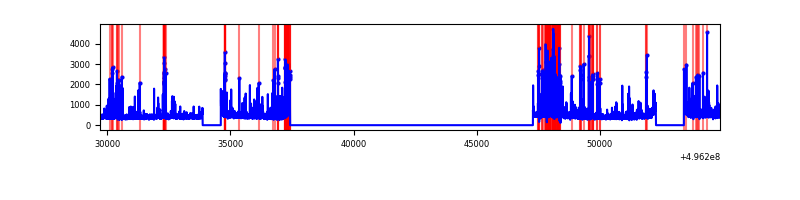 |
| D | 25170 | 13430 | 4978 | 4978 | 19.78% | 37.07% | 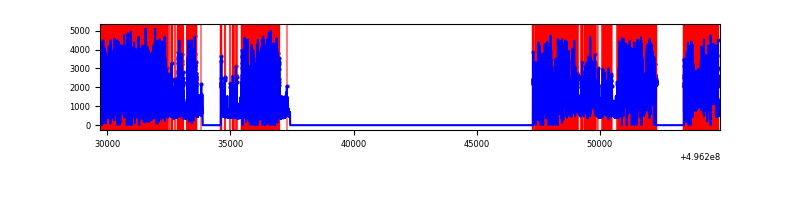 |
Top three noisy pixels from each quadrant. If the there are fewer than three noisy pixels in the level2.evt file, extra rows are filled as -1
| Pixel properties | Quadrant properties | ||||||
|---|---|---|---|---|---|---|---|
| Quadrant | DetID | PixID | Counts | Sigma | Mean | Median | Sigma |
| A | 15 | 174 | 527648 | 1493.18 | 1426 | 1388 | 352.4 |
| A | 12 | 115 | 164433 | 462.61 | 1426 | 1388 | 352.4 |
| A | 0 | 8 | 152640 | 429.15 | 1426 | 1388 | 352.4 |
| B | 0 | 213 | 734363 | 2484.06 | 1406 | 1359 | 295.1 |
| B | 0 | 155 | 345940 | 1167.74 | 1406 | 1359 | 295.1 |
| B | 5 | 185 | 145457 | 488.33 | 1406 | 1359 | 295.1 |
| C | 14 | 80 | 487438 | 1290.27 | 1382 | 1366 | 376.7 |
| C | 12 | 250 | 277933 | 734.14 | 1382 | 1366 | 376.7 |
| C | 3 | 233 | 213141 | 562.15 | 1382 | 1366 | 376.7 |
| D | 8 | 176 | 17713924 | 73880.34 | 848 | 810 | 239.8 |
| D | 2 | 172 | 120676 | 499.95 | 848 | 810 | 239.8 |
| D | 3 | 144 | 98392 | 407.01 | 848 | 810 | 239.8 |
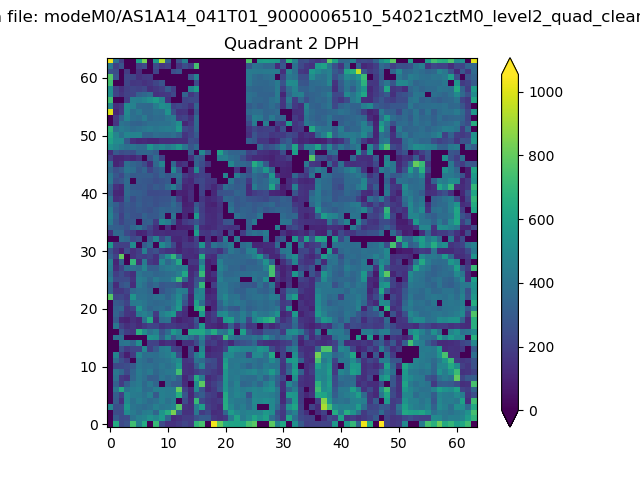
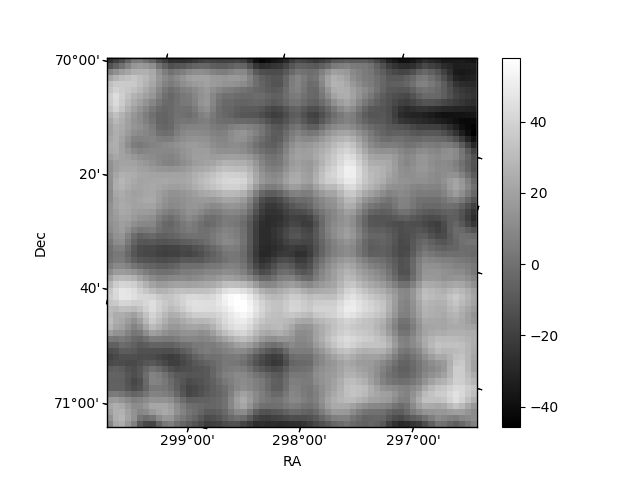
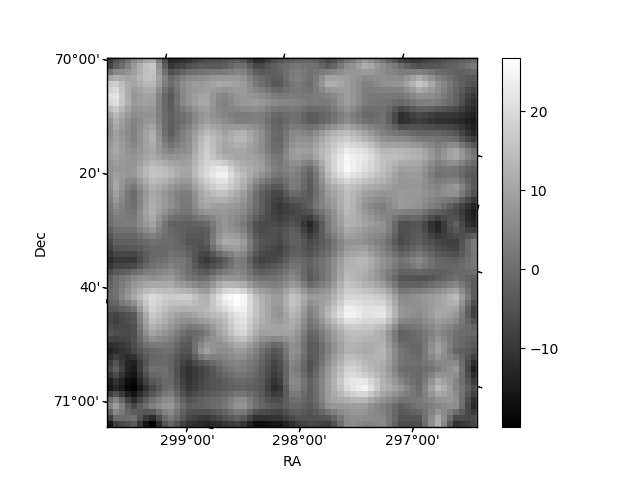
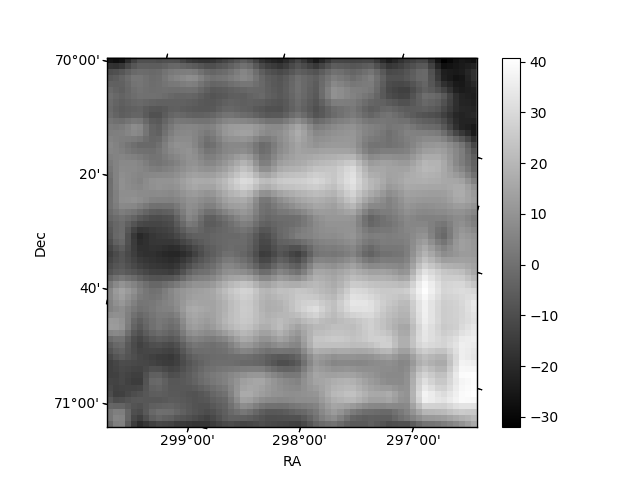
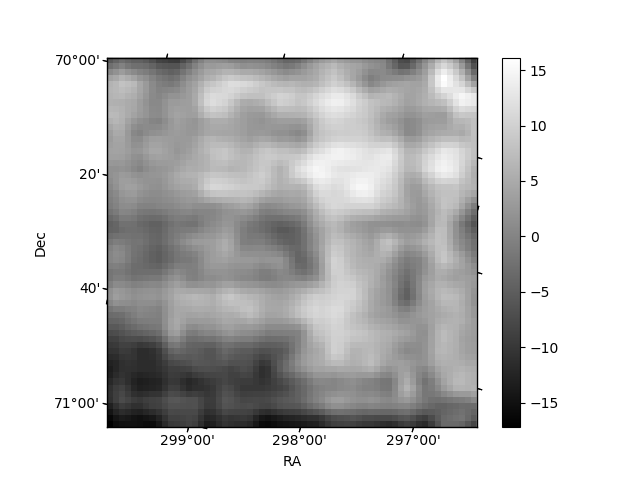
Histogram calculated using DETX and DETY for each event in the final _common_clean file
| Quadrant A | 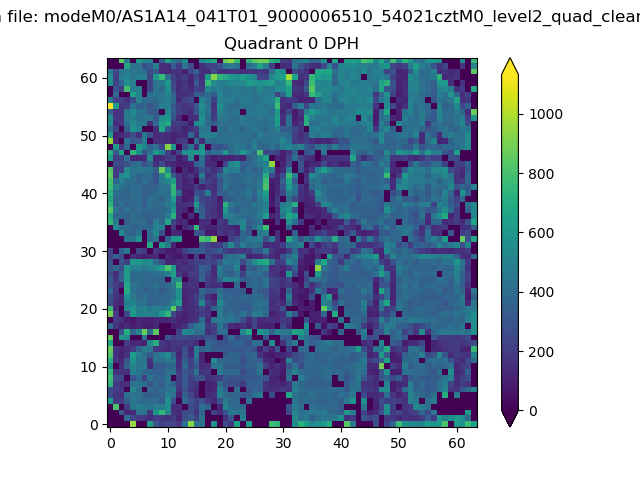 |
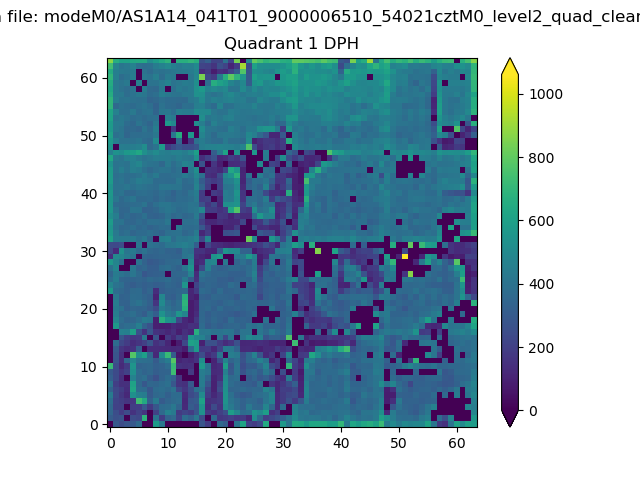 |
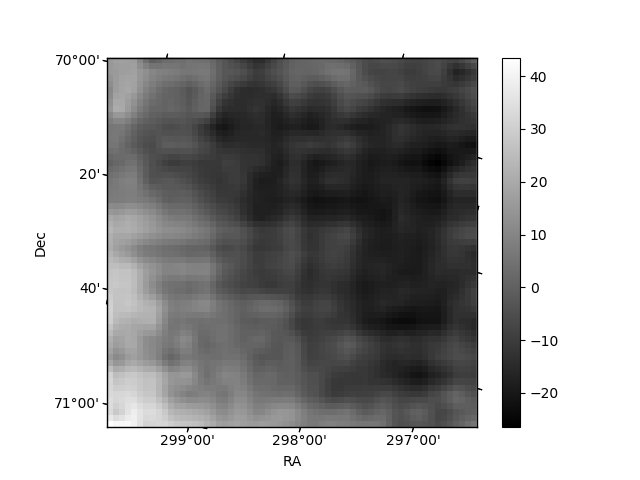
Quadrant B |
|---|---|---|---|
| Quadrant D | 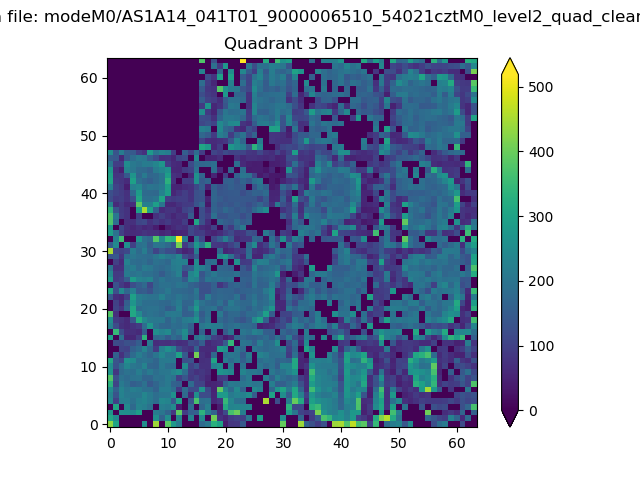 |
 |
Quadrant C |
| Plot type | Count rate plots | Images |
|---|---|---|
| Comparison with Poisson distribution Blue bars denote a histogram of data divided into 1 sec bins. Red curve is a Poisson curve with rate = median count rate of data. |
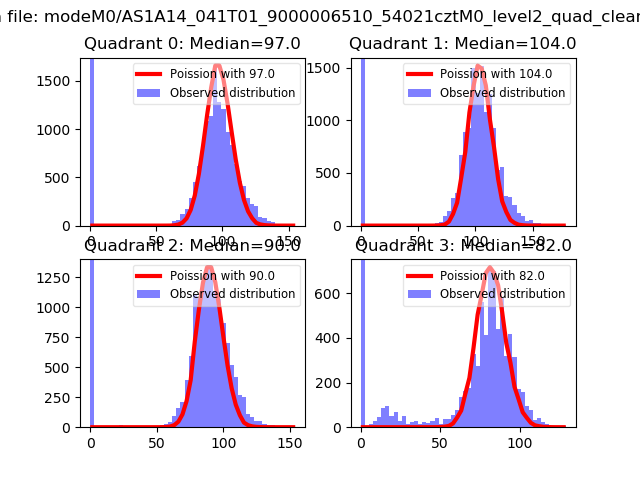 |
 |
| Quadrant-wise count rates Data is divided into 100 sec bins |
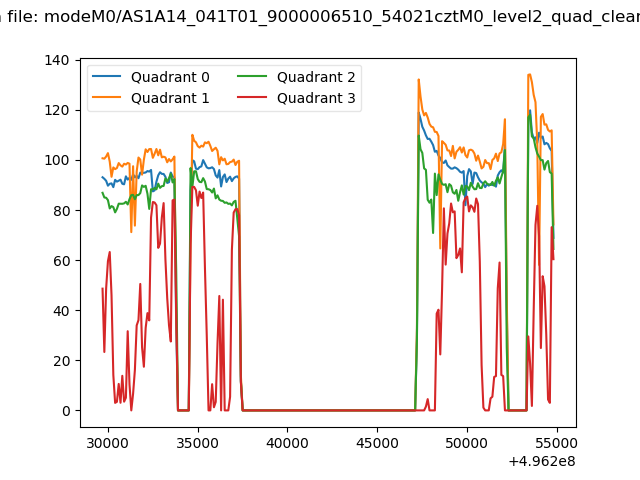 |
|
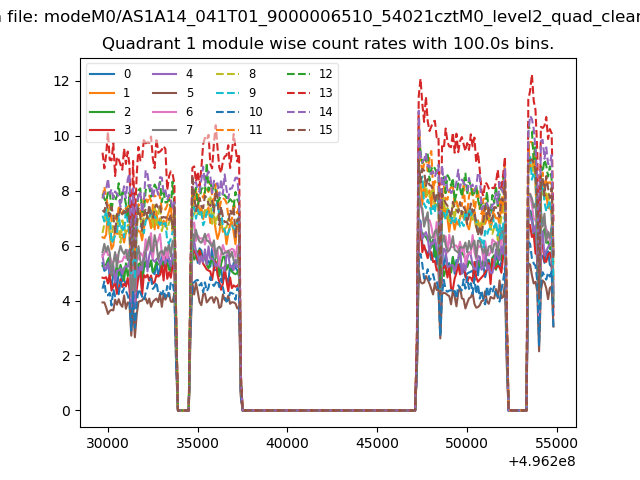
| Module-wise count rates for Quadrant A Data is divided into 100 sec bins |
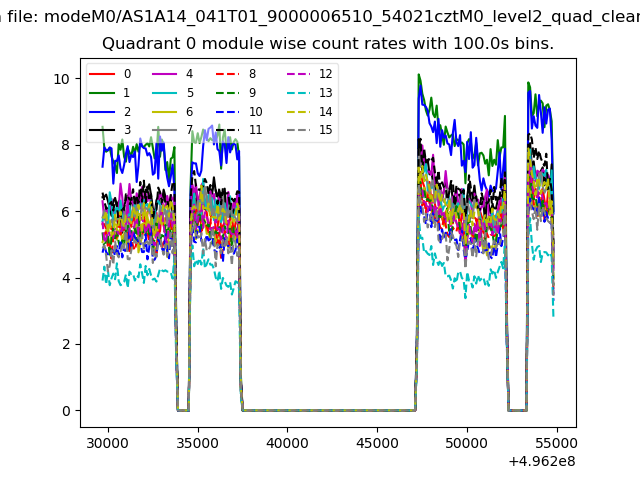 |
 |
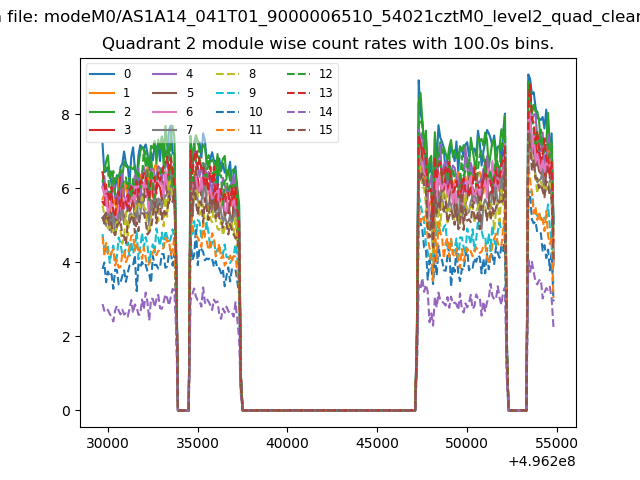
| Module-wise count rates for Quadrant B Data is divided into 100 sec bins |
 |
 |
| Module-wise count rates for Quadrant C Data is divided into 100 sec bins |
 |
 |
| Module-wise count rates for Quadrant D Data is divided into 100 sec bins |
 |
 |
| Parameter | Plot |
|---|---|
| CZT HV Monitor | 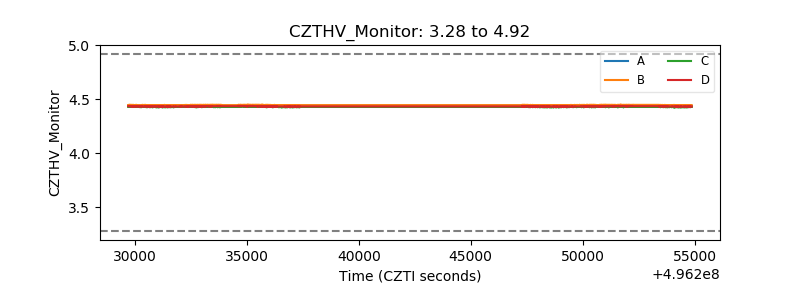 |
| D_VDD | 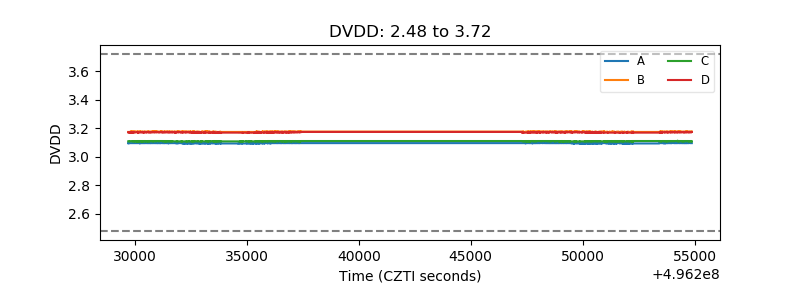 |
| Temperature 1 | 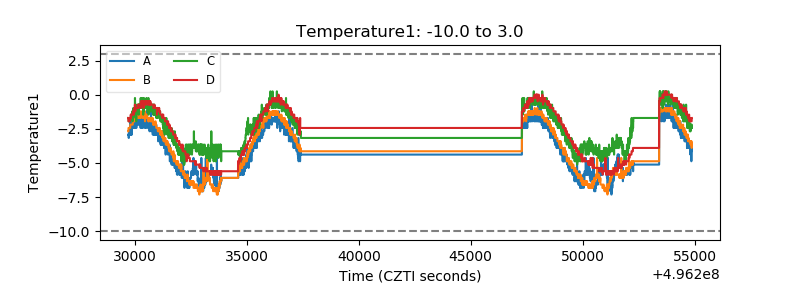 |
| Veto HV Monitor | 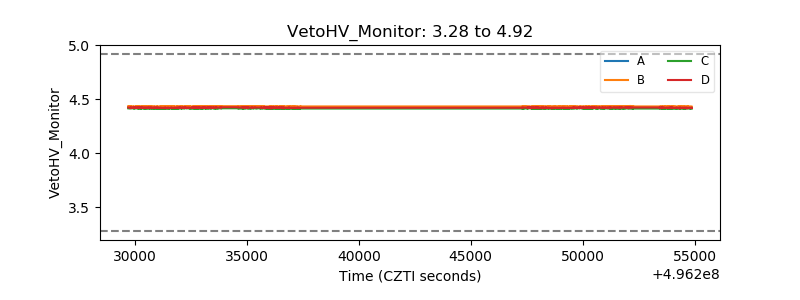 |
| Veto LLD | 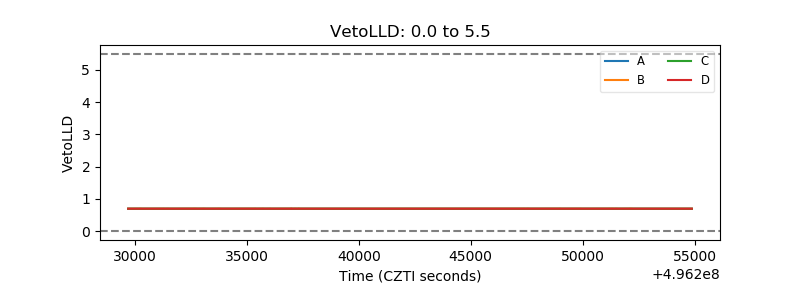 |
| Alpha Counter | 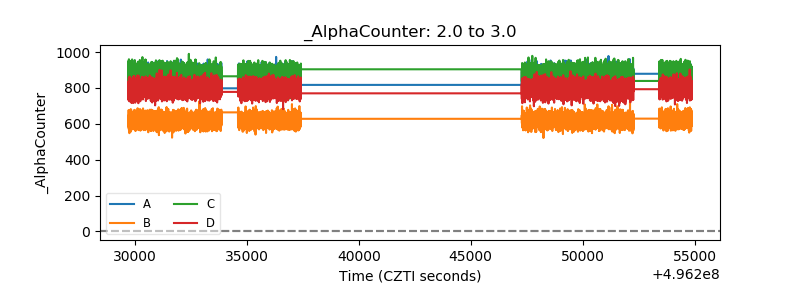 |
| _CPM_Rate | 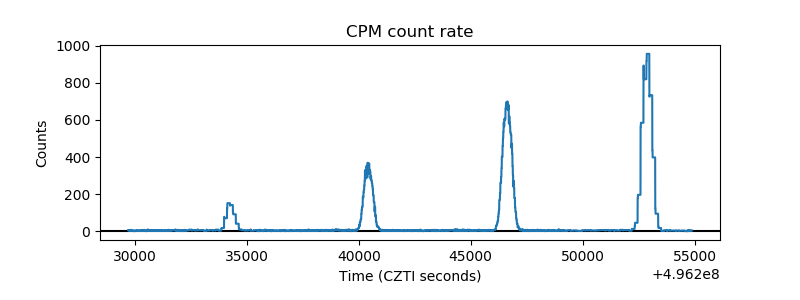 |
| CZT Counter | 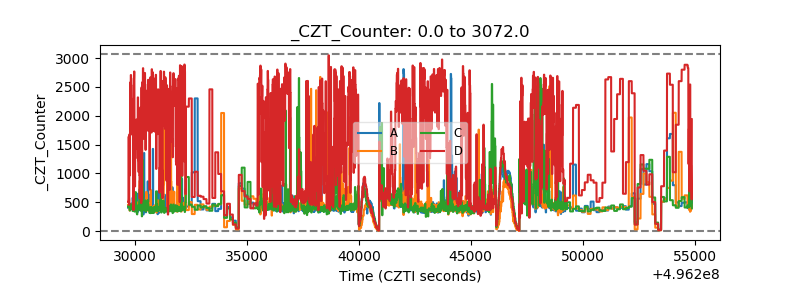 |
| +2.5 Volts monitor |  |
| +5 Volts monitor |  |
| _ROLL_ROT | 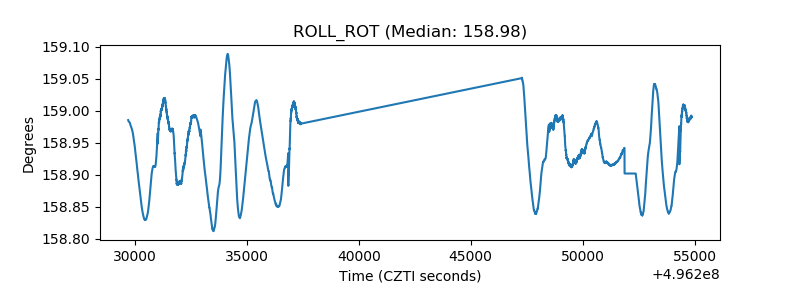 |
| _Roll_DEC | 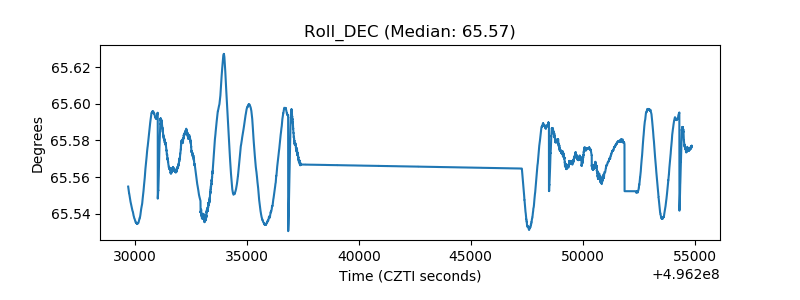 |
| _Roll_RA | 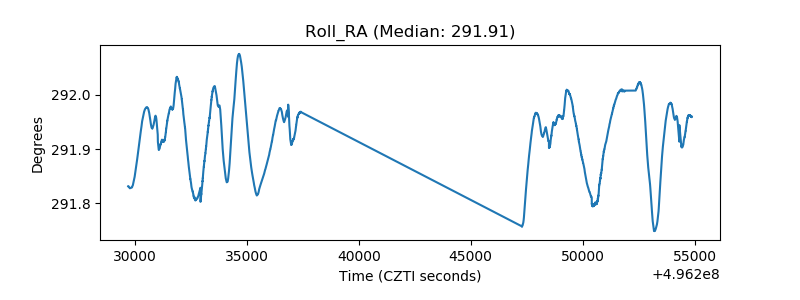 |
| Veto Counter | 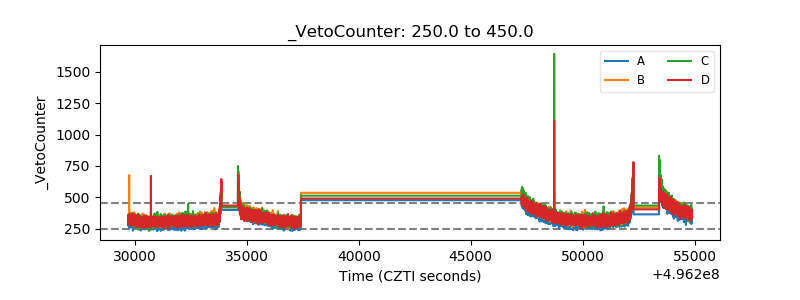 |