| Param | Original file | Final file |
|---|---|---|
| Filename | modeM0/AS1A14_041T01_9000006510_54023cztM0_level2.fits | modeM0/AS1A14_041T01_9000006510_54023cztM0_level2_quad_clean.evt |
| Size (bytes) | 558,636,480 | 87,255,360 |
| Size | 532.8 MB | 83.2 MB |
| Events in quadrant A | 2,841,216 | 634,780 |
| Events in quadrant B | 4,248,316 | 646,280 |
| Events in quadrant C | 4,183,744 | 591,554 |
| Events in quadrant D | 8,916,697 | 330,652 |
| Mode M9 | |||
|---|---|---|---|
| Quadrant | BADHDUFLAG | Total packets | Discarded packets |
| A | 0 | 12 | 0 |
| B | 0 | 12 | 0 |
| C | 0 | 12 | 0 |
| D | 0 | 12 | 0 |
| Mode SS | |||
|---|---|---|---|
| Quadrant | BADHDUFLAG | Total packets | Discarded packets |
| A | 0 | 128 | 0 |
| B | 0 | 128 | 0 |
| C | 0 | 128 | 0 |
| D | 0 | 128 | 0 |
| Mode M0 | |||
|---|---|---|---|
| Quadrant | BADHDUFLAG | Total packets | Discarded packets |
| A | 0 | 13120 | 2 |
| B | 0 | 17206 | 4 |
| C | 0 | 16821 | 1 |
| D | 0 | 30931 | 1 |
| Quadrant | Total seconds | Saturated seconds | Saturation percentage |
|---|---|---|---|
| A | 6285 | 18 | 0.286396% |
| B | 6285 | 473 | 7.525855% |
| C | 6286 | 211 | 3.356666% |
| D | 6286 | 2694 | 42.857143% |
Noise dominated data is calculated using 1-second bins in cleaned event files. If a bin has >2000 counts, and if more than 50% of those come from <1% of pixels, then it is considered to be noise-dominated and hence unusable.
| Quadrant | # 1 sec bins | Bins with >0 counts | Bins with >2000 counts | High rate bins dominated by noise | Noise dominated (total time) | Noise dominated (detector-on time) | Marked lightcurve |
|---|---|---|---|---|---|---|---|
| A | 7497 | 6288 | 8 | 8 | 0.11% | 0.13% | 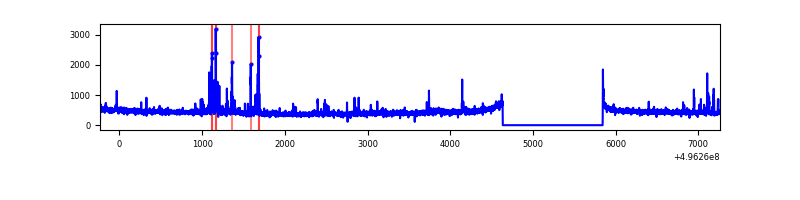 |
| B | 7496 | 6287 | 306 | 306 | 4.08% | 4.87% | 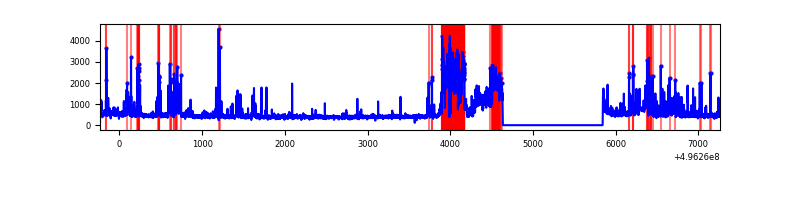 |
| C | 7497 | 6288 | 156 | 156 | 2.08% | 2.48% | 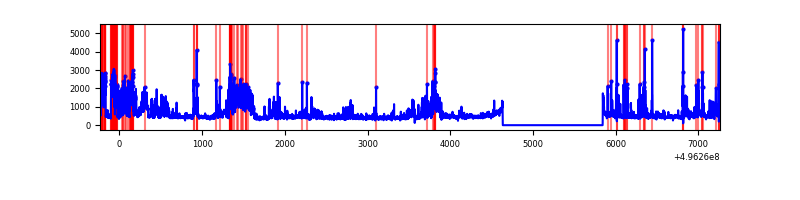 |
| D | 7497 | 6285 | 1728 | 1728 | 23.05% | 27.49% | 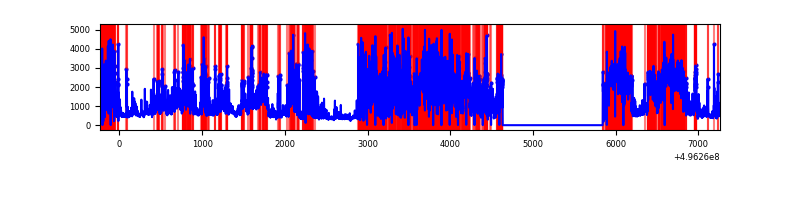 |
Top three noisy pixels from each quadrant. If the there are fewer than three noisy pixels in the level2.evt file, extra rows are filled as -1
| Pixel properties | Quadrant properties | ||||||
|---|---|---|---|---|---|---|---|
| Quadrant | DetID | PixID | Counts | Sigma | Mean | Median | Sigma |
| A | 15 | 174 | 139651 | 840.88 | 667 | 648 | 165.3 |
| A | 2 | 143 | 22660 | 133.16 | 667 | 648 | 165.3 |
| A | 4 | 3 | 20729 | 121.48 | 667 | 648 | 165.3 |
| B | 5 | 236 | 1112287 | 8193.58 | 644 | 623 | 135.7 |
| B | 0 | 155 | 231149 | 1699.11 | 644 | 623 | 135.7 |
| B | 5 | 172 | 103917 | 761.33 | 644 | 623 | 135.7 |
| C | 4 | 5 | 694709 | 3826.87 | 657 | 650 | 181.4 |
| C | 9 | 38 | 439081 | 2417.4 | 657 | 650 | 181.4 |
| C | 13 | 3 | 135626 | 744.22 | 657 | 650 | 181.4 |
| D | 8 | 176 | 6831403 | 55419.19 | 428 | 407 | 123.3 |
| D | 2 | 249 | 75032 | 605.43 | 428 | 407 | 123.3 |
| D | 14 | 52 | 59194 | 476.93 | 428 | 407 | 123.3 |
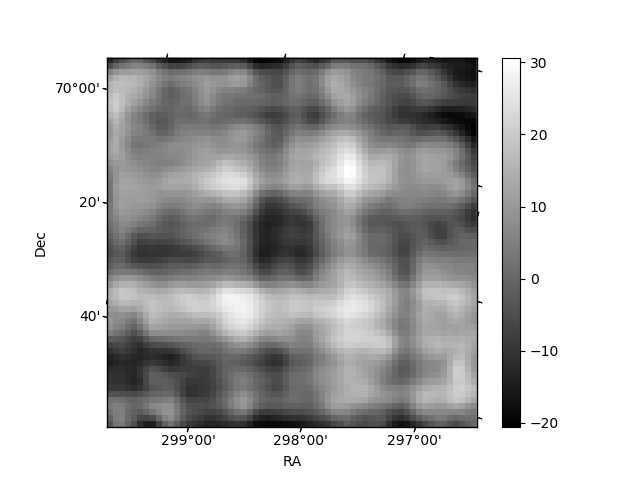
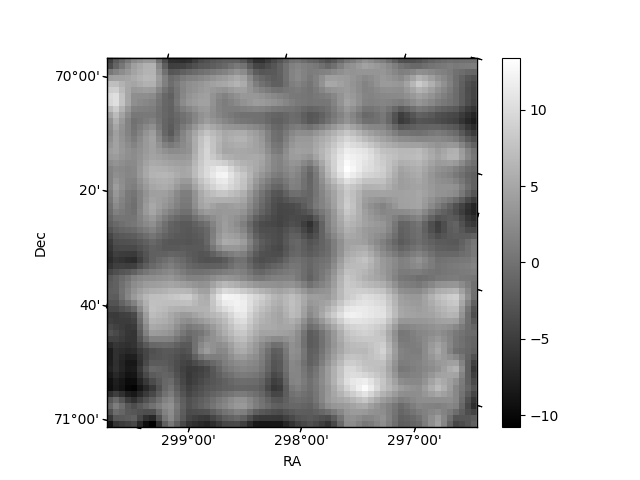
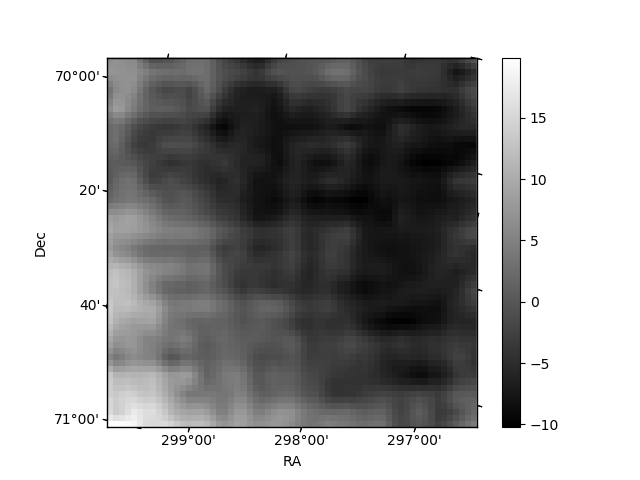
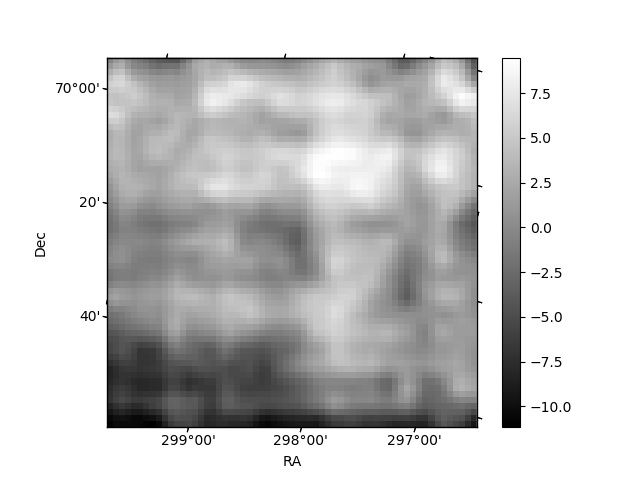
Histogram calculated using DETX and DETY for each event in the final _common_clean file
| Quadrant A | 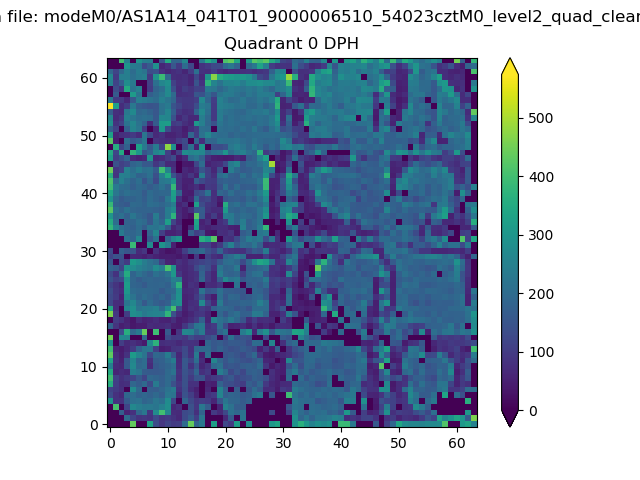 |
 |
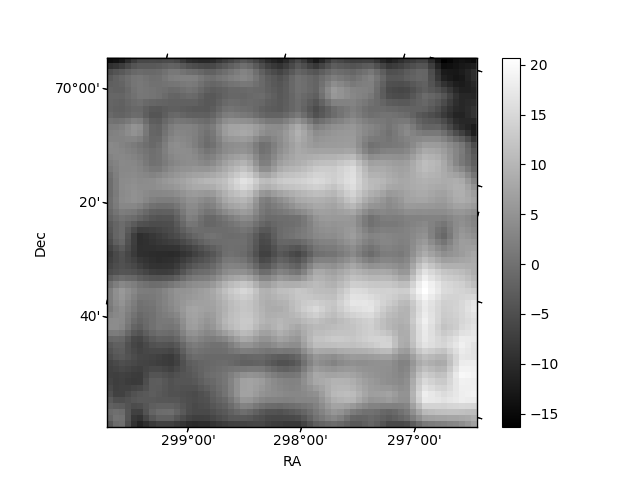
Quadrant B |
|---|---|---|---|
| Quadrant D | 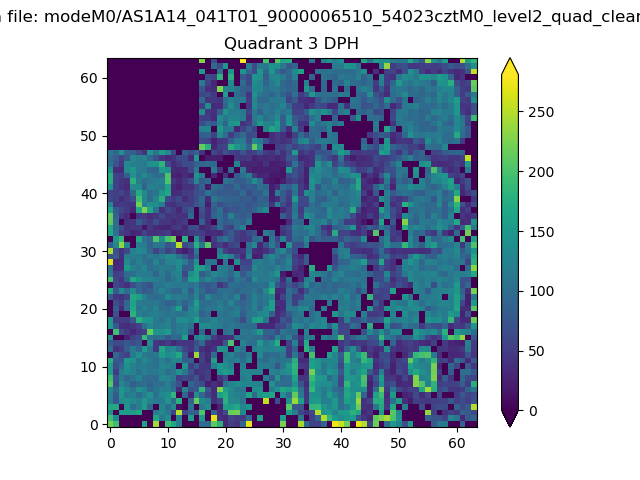 |
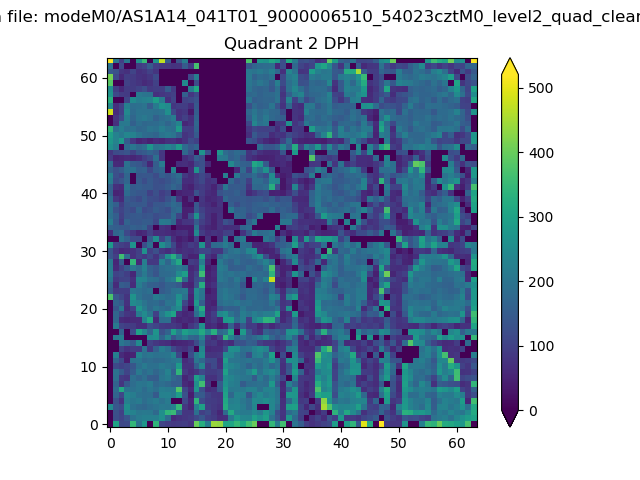 |
Quadrant C |
| Plot type | Count rate plots | Images |
|---|---|---|
| Comparison with Poisson distribution Blue bars denote a histogram of data divided into 1 sec bins. Red curve is a Poisson curve with rate = median count rate of data. |
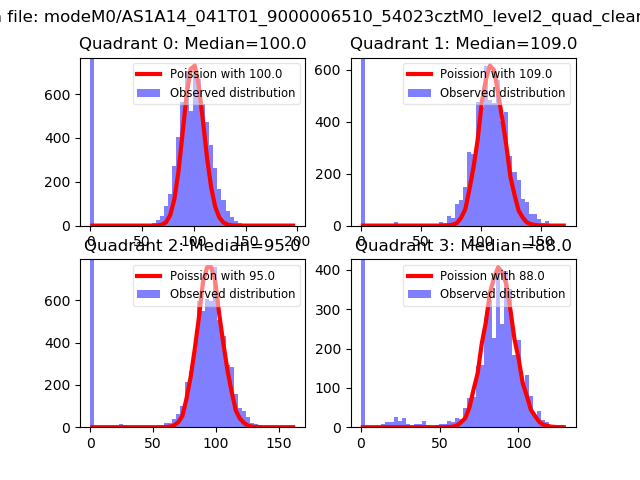 |
 |
| Quadrant-wise count rates Data is divided into 100 sec bins |
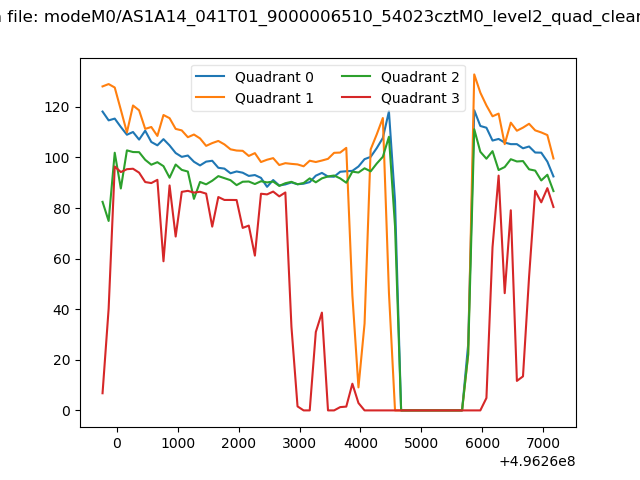 |
|
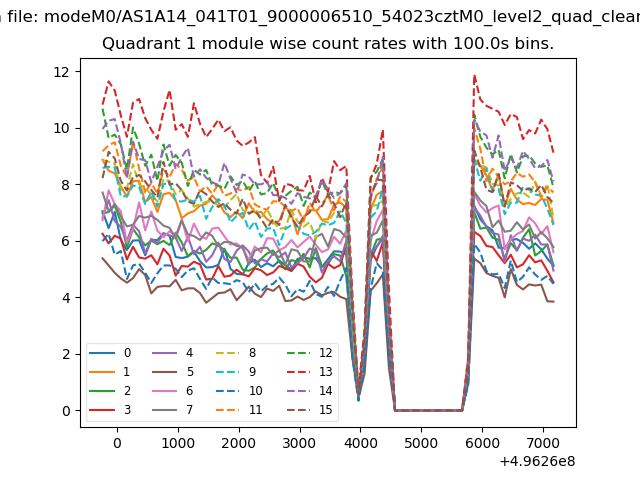
| Module-wise count rates for Quadrant A Data is divided into 100 sec bins |
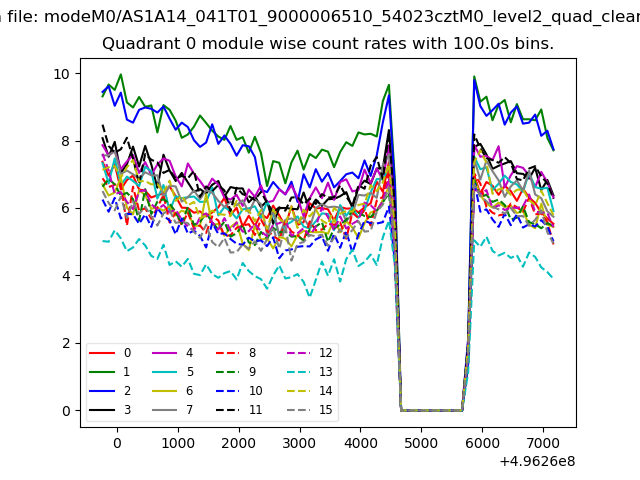 |
 |
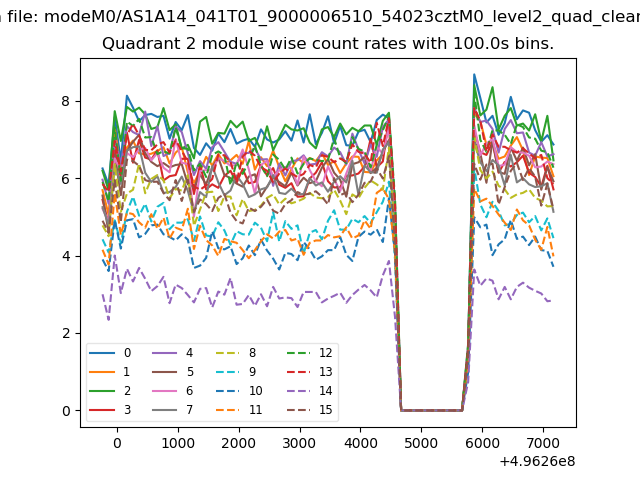
| Module-wise count rates for Quadrant B Data is divided into 100 sec bins |
 |
 |
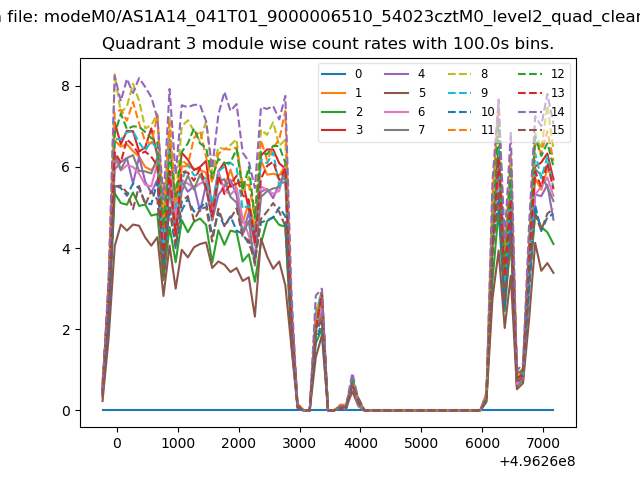
| Module-wise count rates for Quadrant C Data is divided into 100 sec bins |
 |
 |
| Module-wise count rates for Quadrant D Data is divided into 100 sec bins |
 |
 |
| Parameter | Plot |
|---|---|
| CZT HV Monitor | 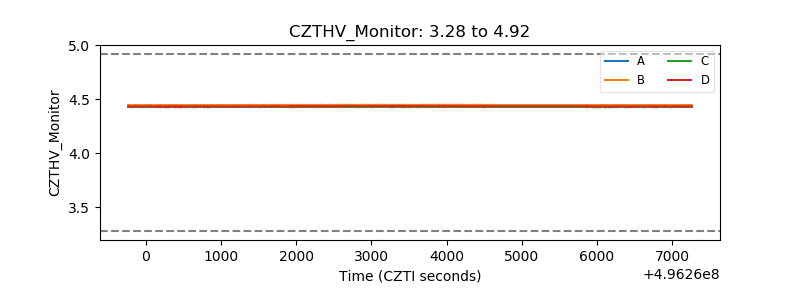 |
| D_VDD | 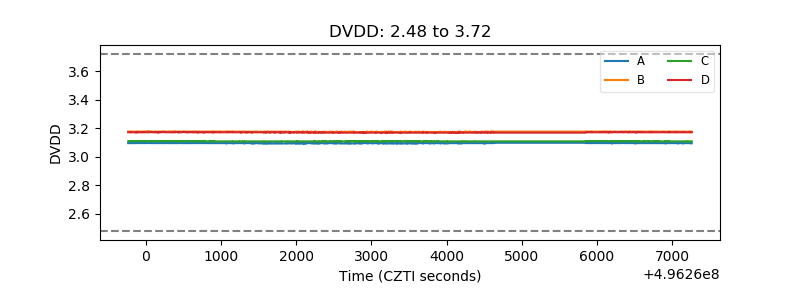 |
| Temperature 1 | 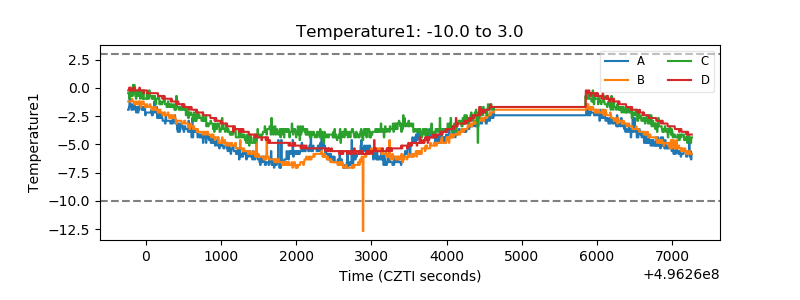 |
| Veto HV Monitor |  |
| Veto LLD | 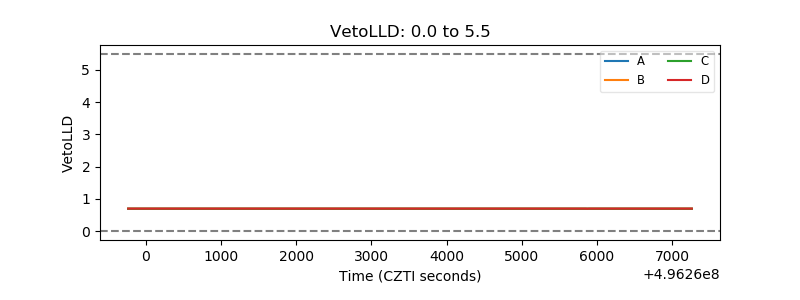 |
| Alpha Counter | 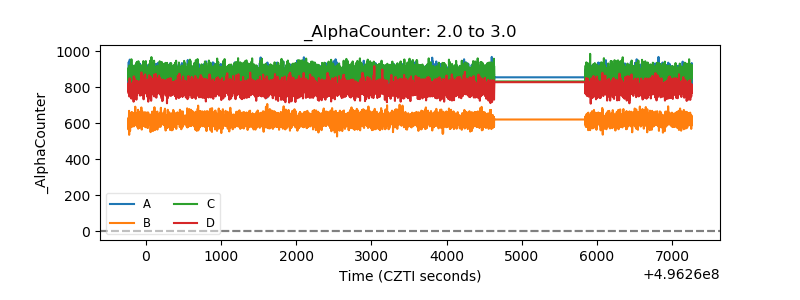 |
| _CPM_Rate | 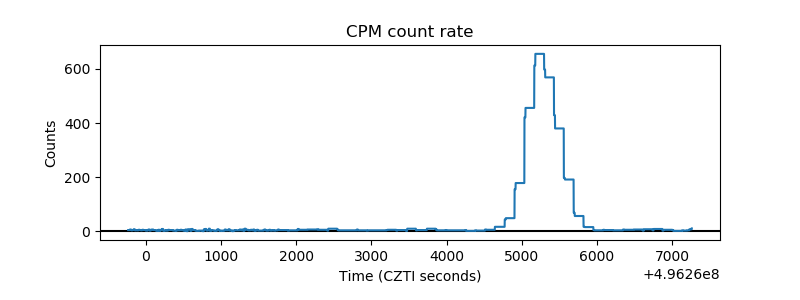 |
| CZT Counter | 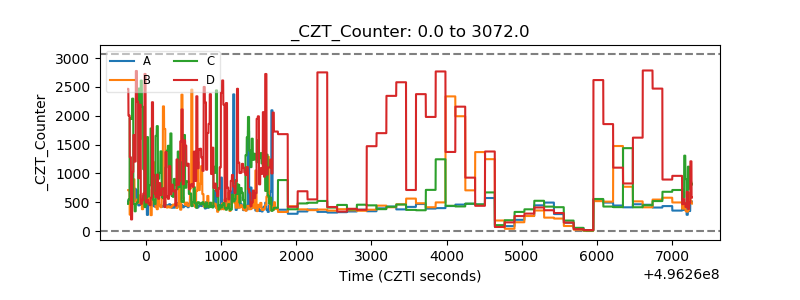 |
| +2.5 Volts monitor |  |
| +5 Volts monitor |  |
| _ROLL_ROT | 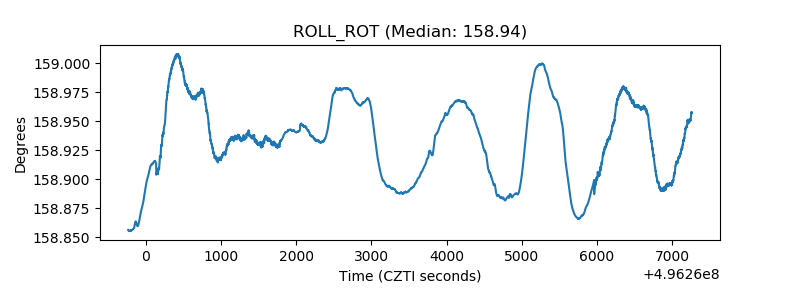 |
| _Roll_DEC | 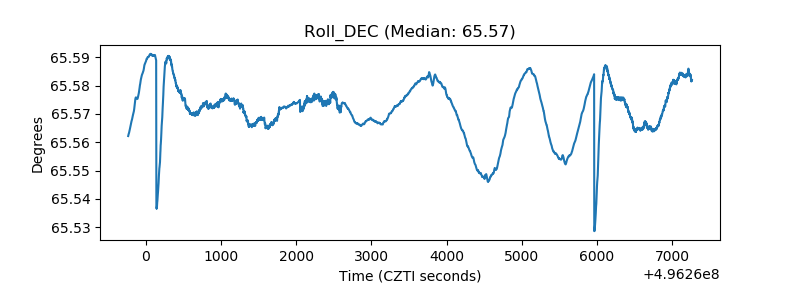 |
| _Roll_RA | 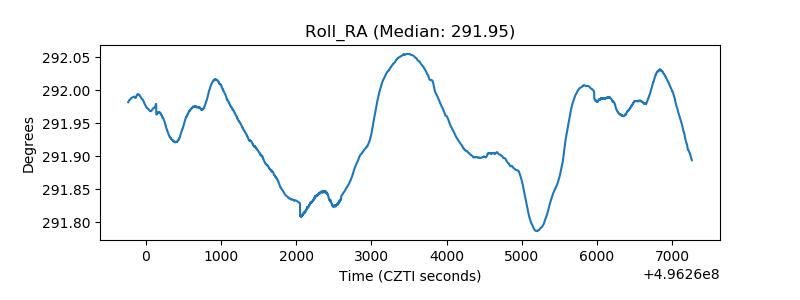 |
| Veto Counter | 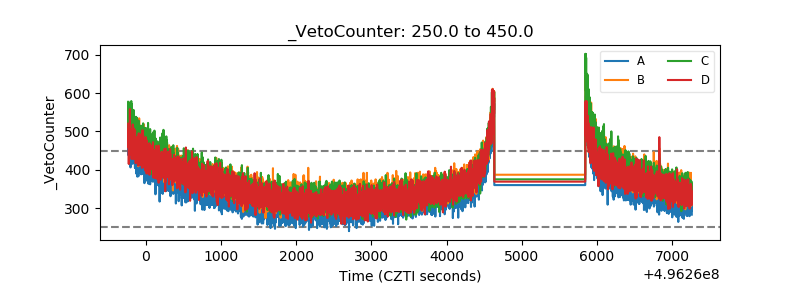 |