| Param | Original file | Final file |
|---|---|---|
| Filename | modeM0/AS1A14_041T01_9000006510_54025cztM0_level2.fits | modeM0/AS1A14_041T01_9000006510_54025cztM0_level2_quad_clean.evt |
| Size (bytes) | 732,568,320 | 86,031,360 |
| Size | 698.6 MB | 82.0 MB |
| Events in quadrant A | 3,273,590 | 649,300 |
| Events in quadrant B | 5,813,868 | 610,389 |
| Events in quadrant C | 3,798,697 | 619,010 |
| Events in quadrant D | 13,700,927 | 250,255 |
| Mode M9 | |||
|---|---|---|---|
| Quadrant | BADHDUFLAG | Total packets | Discarded packets |
| A | 0 | 13 | 0 |
| B | 0 | 13 | 0 |
| C | 0 | 14 | 0 |
| D | 0 | 14 | 0 |
| Mode SS | |||
|---|---|---|---|
| Quadrant | BADHDUFLAG | Total packets | Discarded packets |
| A | 0 | 138 | 0 |
| B | 0 | 138 | 0 |
| C | 0 | 138 | 0 |
| D | 0 | 138 | 0 |
| Mode M0 | |||
|---|---|---|---|
| Quadrant | BADHDUFLAG | Total packets | Discarded packets |
| A | 0 | 15035 | 2 |
| B | 0 | 22056 | 2 |
| C | 0 | 16388 | 2 |
| D | 0 | 45415 | 2 |
| Quadrant | Total seconds | Saturated seconds | Saturation percentage |
|---|---|---|---|
| A | 6830 | 84 | 1.229868% |
| B | 6830 | 1063 | 15.563690% |
| C | 6830 | 152 | 2.225476% |
| D | 6829 | 4108 | 60.155220% |
Noise dominated data is calculated using 1-second bins in cleaned event files. If a bin has >2000 counts, and if more than 50% of those come from <1% of pixels, then it is considered to be noise-dominated and hence unusable.
| Quadrant | # 1 sec bins | Bins with >0 counts | Bins with >2000 counts | High rate bins dominated by noise | Noise dominated (total time) | Noise dominated (detector-on time) | Marked lightcurve |
|---|---|---|---|---|---|---|---|
| A | 7590 | 6831 | 51 | 51 | 0.67% | 0.75% | 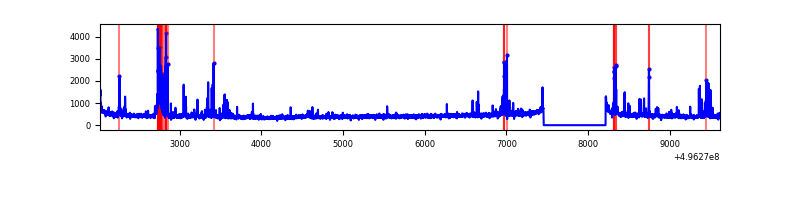 |
| B | 7590 | 6829 | 778 | 778 | 10.25% | 11.39% | 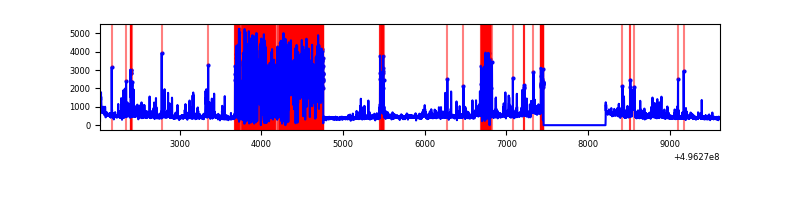 |
| C | 7590 | 6831 | 92 | 92 | 1.21% | 1.35% | 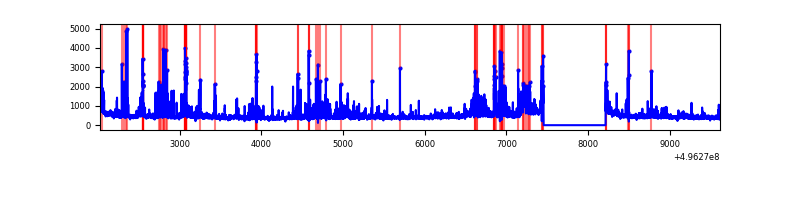 |
| D | 7589 | 6828 | 3651 | 3651 | 48.11% | 53.47% | 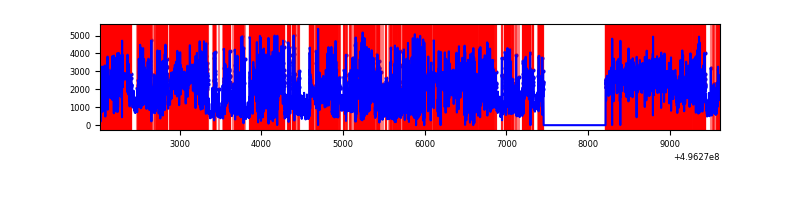 |
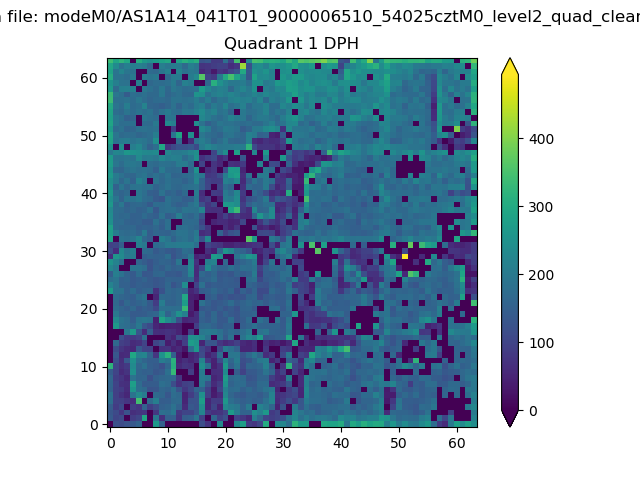
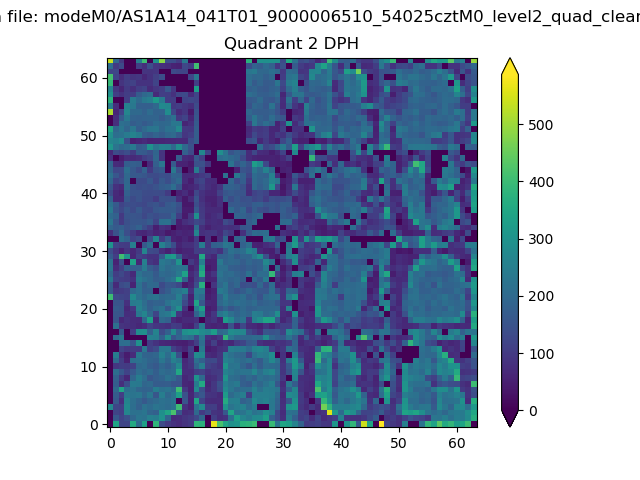
Top three noisy pixels from each quadrant. If the there are fewer than three noisy pixels in the level2.evt file, extra rows are filled as -1
| Pixel properties | Quadrant properties | ||||||
|---|---|---|---|---|---|---|---|
| Quadrant | DetID | PixID | Counts | Sigma | Mean | Median | Sigma |
| A | 15 | 174 | 356042 | 2027.31 | 709 | 691 | 175.3 |
| A | 0 | 8 | 42315 | 237.47 | 709 | 691 | 175.3 |
| A | 10 | 253 | 34505 | 192.91 | 709 | 691 | 175.3 |
| B | 5 | 236 | 2440483 | 17529.64 | 656 | 633 | 139.2 |
| B | 2 | 249 | 229109 | 1641.54 | 656 | 633 | 139.2 |
| B | 0 | 213 | 120803 | 863.39 | 656 | 633 | 139.2 |
| C | 13 | 3 | 501586 | 2637.19 | 693 | 685 | 189.9 |
| C | 9 | 53 | 184045 | 965.37 | 693 | 685 | 189.9 |
| C | 14 | 254 | 85878 | 448.53 | 693 | 685 | 189.9 |
| D | 8 | 176 | 11271943 | 87651.3 | 442 | 422 | 128.6 |
| D | 2 | 165 | 136509 | 1058.26 | 442 | 422 | 128.6 |
| D | 3 | 144 | 92006 | 712.19 | 442 | 422 | 128.6 |
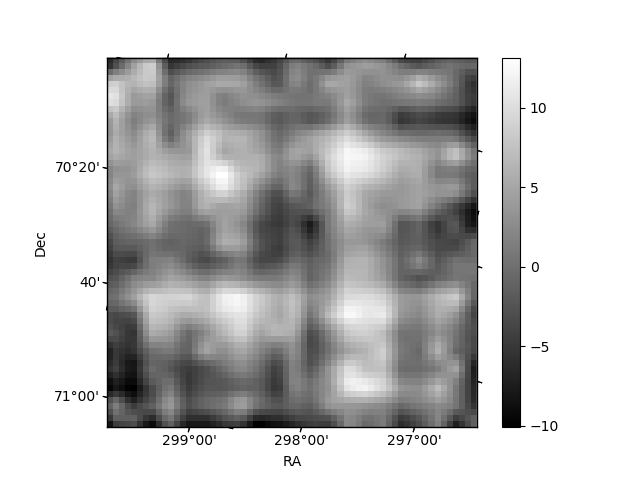
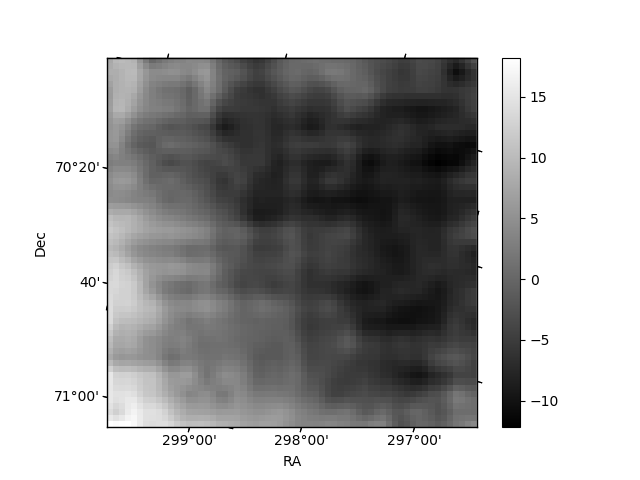
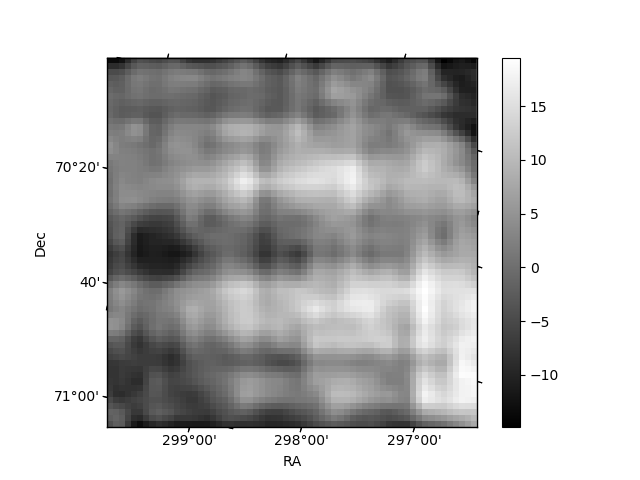
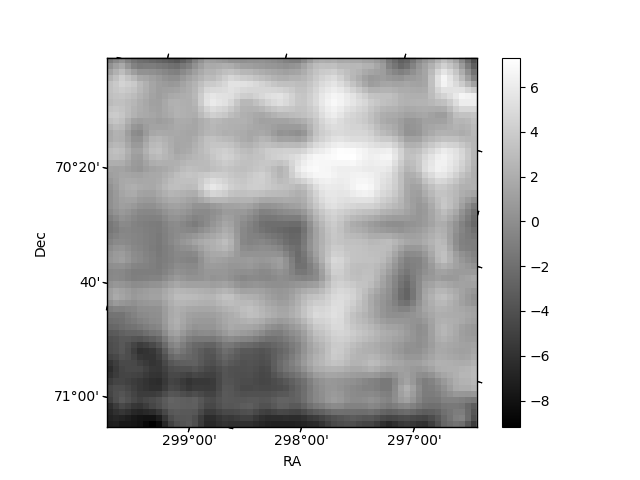
Histogram calculated using DETX and DETY for each event in the final _common_clean file
| Quadrant A | 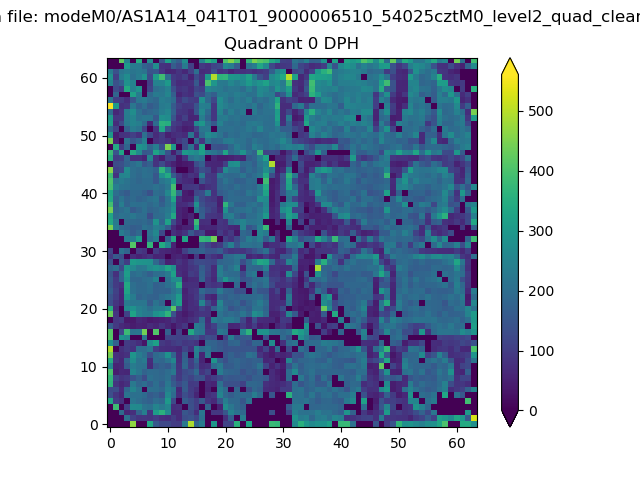 |
 |
Quadrant B |
|---|---|---|---|
| Quadrant D | 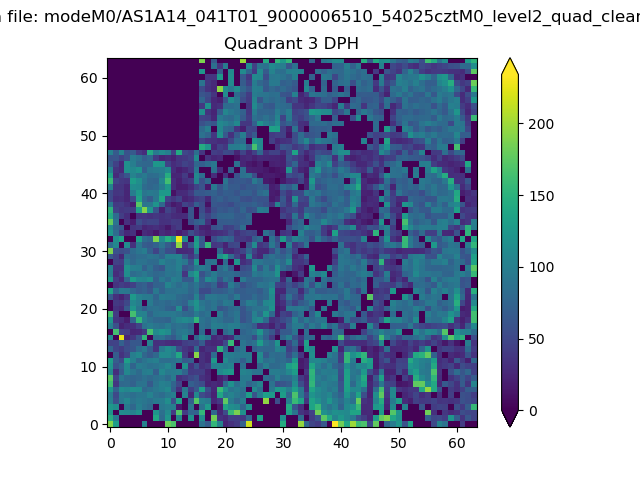 |
 |
Quadrant C |
| Plot type | Count rate plots | Images |
|---|---|---|
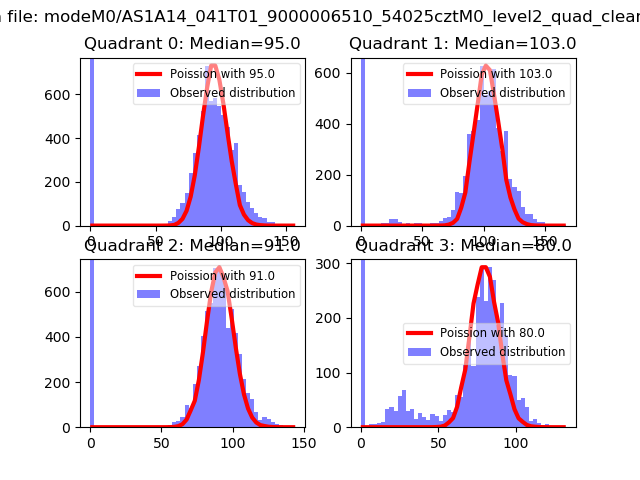
| Comparison with Poisson distribution Blue bars denote a histogram of data divided into 1 sec bins. Red curve is a Poisson curve with rate = median count rate of data. |
 |
 |
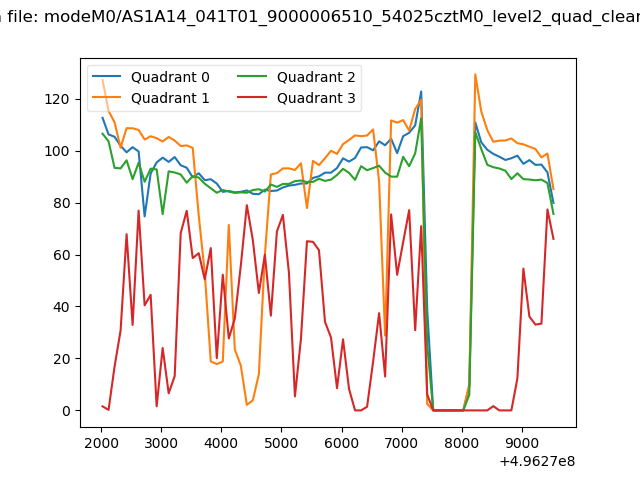
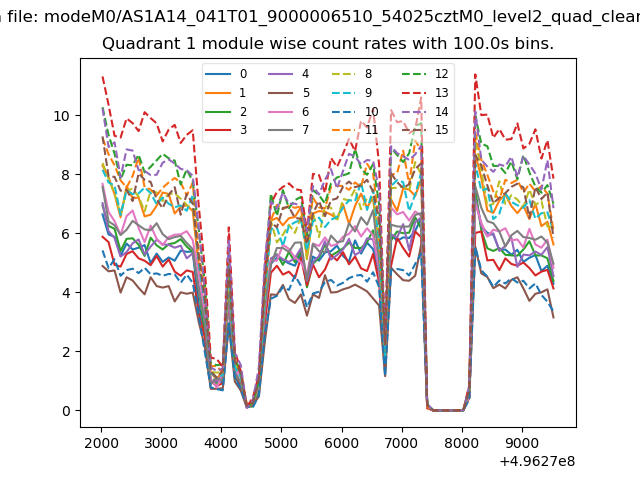
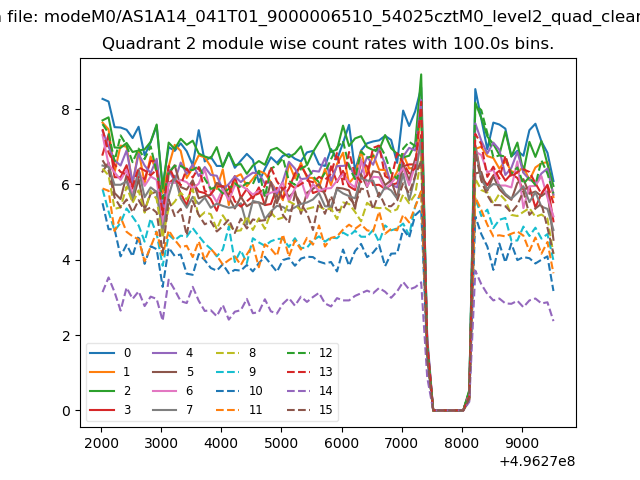
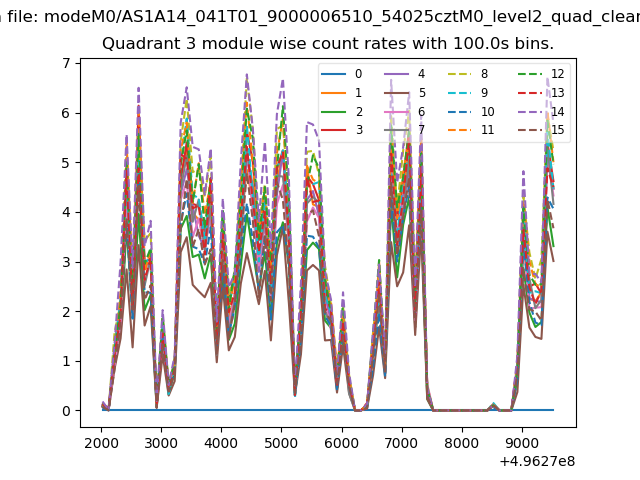
| Quadrant-wise count rates Data is divided into 100 sec bins |
 |
|
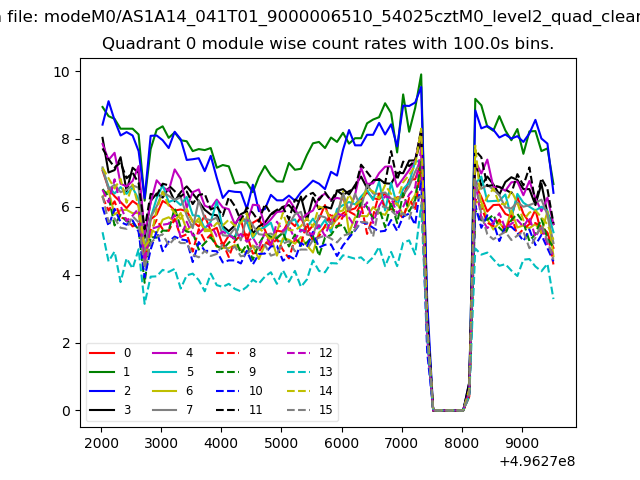
| Module-wise count rates for Quadrant A Data is divided into 100 sec bins |
 |
 |
| Module-wise count rates for Quadrant B Data is divided into 100 sec bins |
 |
 |
| Module-wise count rates for Quadrant C Data is divided into 100 sec bins |
 |
 |
| Module-wise count rates for Quadrant D Data is divided into 100 sec bins |
 |
 |
| Parameter | Plot |
|---|---|
| CZT HV Monitor | 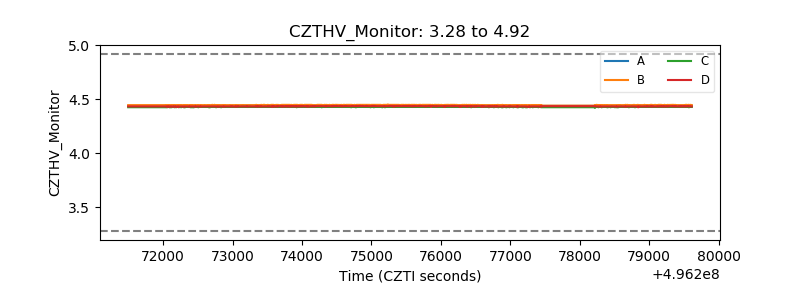 |
| D_VDD | 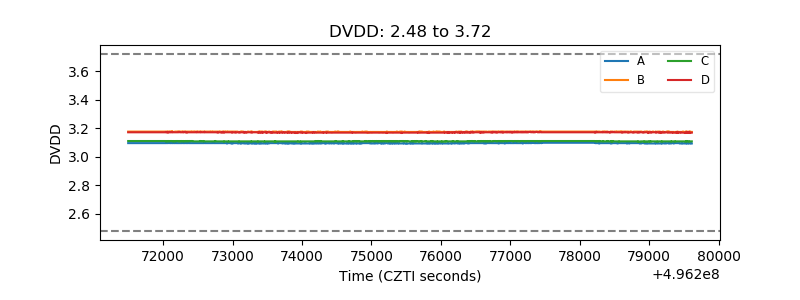 |
| Temperature 1 | 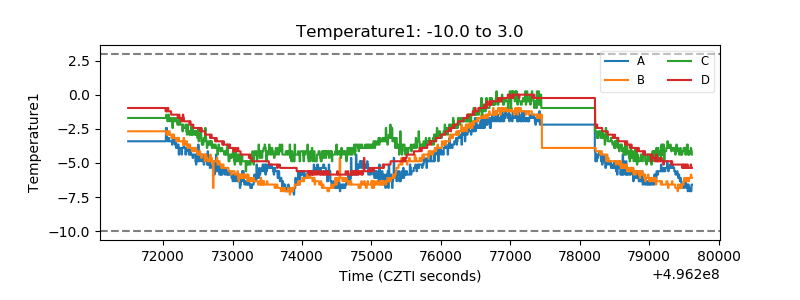 |
| Veto HV Monitor | 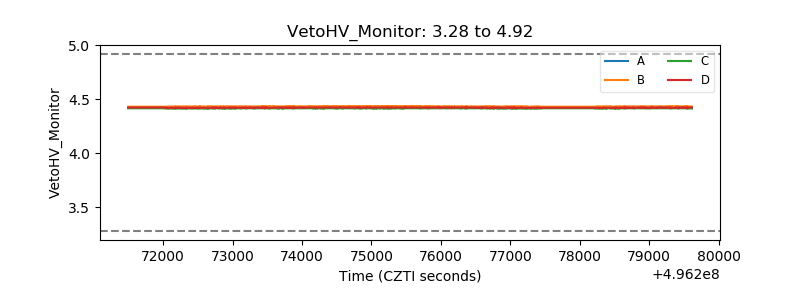 |
| Veto LLD | 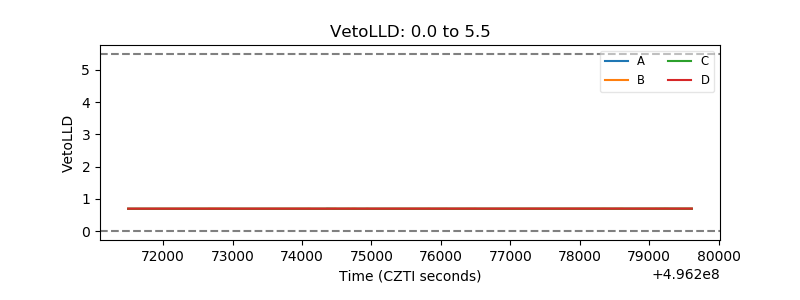 |
| Alpha Counter | 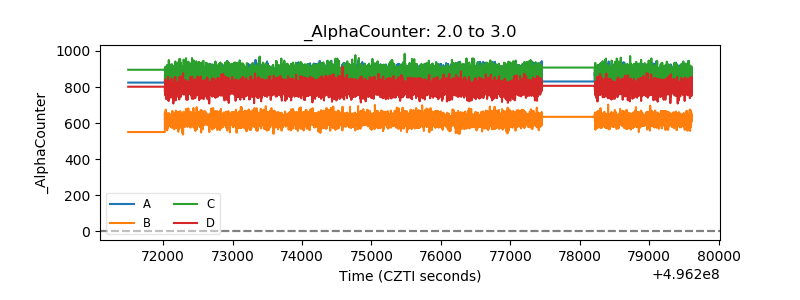 |
| _CPM_Rate | 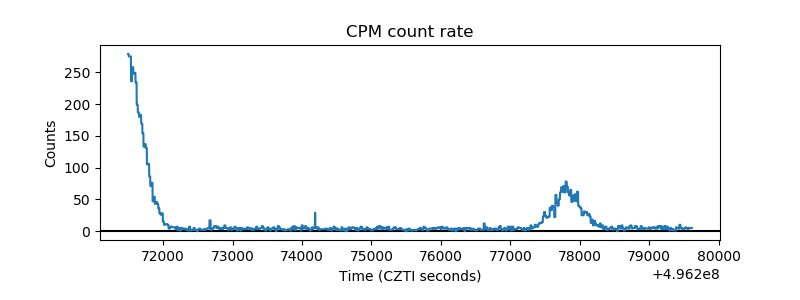 |
| CZT Counter | 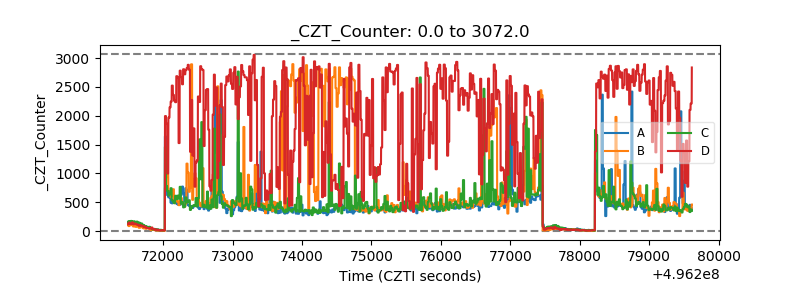 |
| +2.5 Volts monitor |  |
| +5 Volts monitor |  |
| _ROLL_ROT | 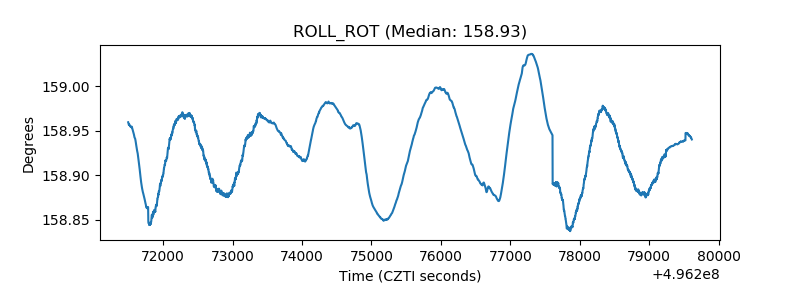 |
| _Roll_DEC | 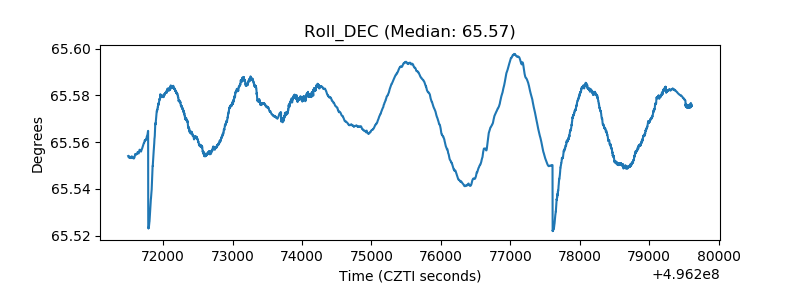 |
| _Roll_RA | 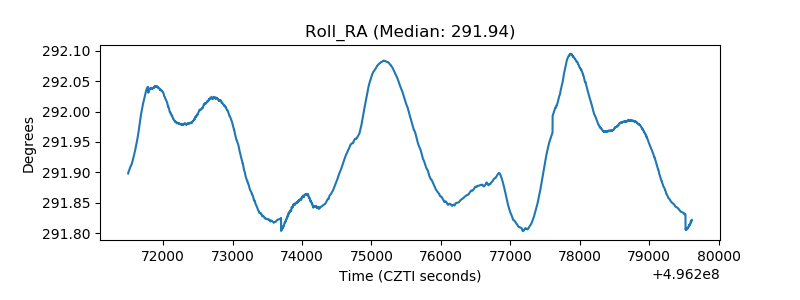 |
| Veto Counter | 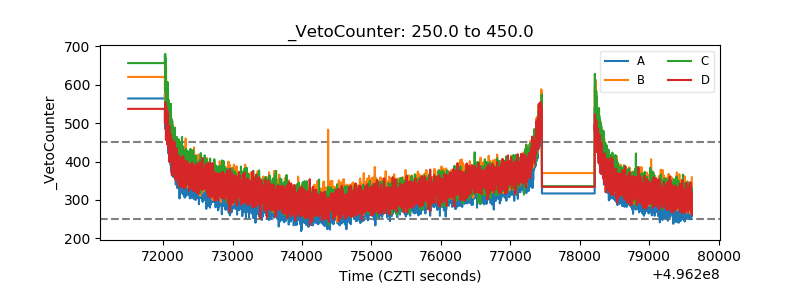 |